


Multiscale multi-technique characterization of the pore network structure for nickel-iron-based industrial catalysts
 0
0 Abstract
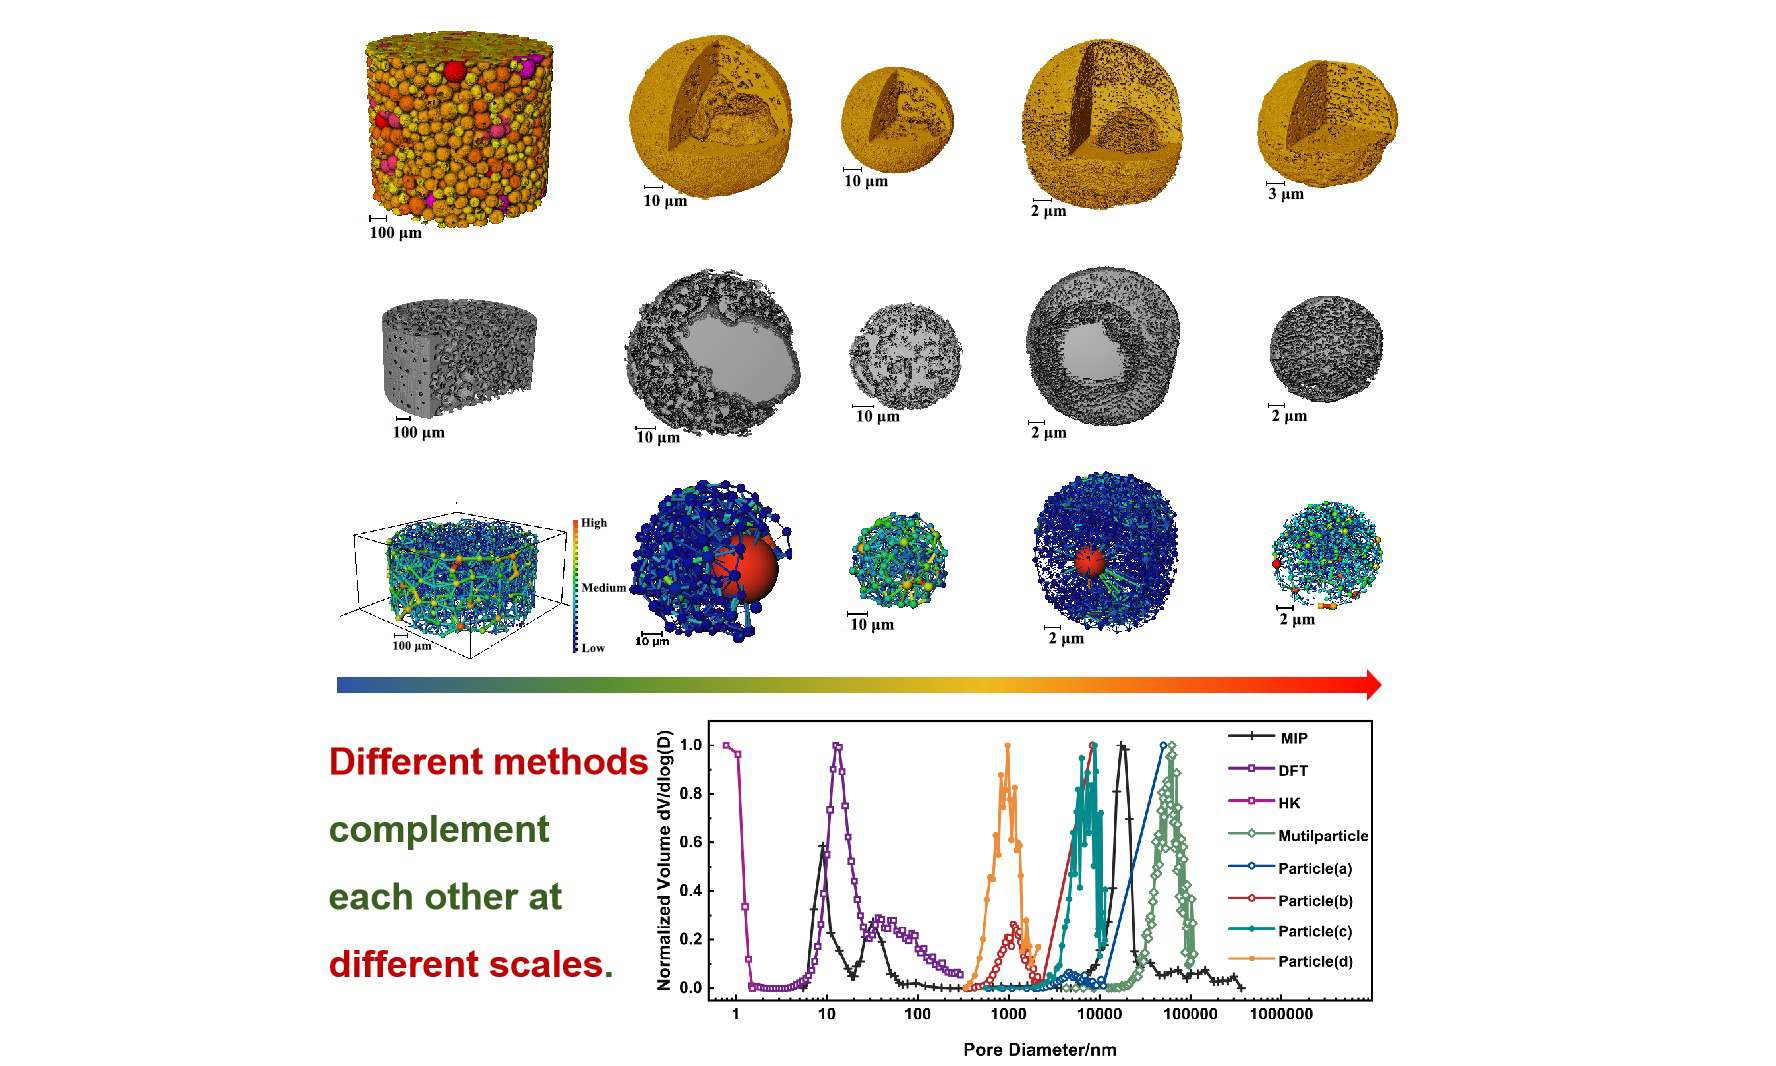
Pore structures, critical for catalyst mass transfer efficiency and active site accessibility, present a cross-scale complexity that challenges conventional characterization methods. This study integrated synchrotron multiscale CT, mercury intrusion porosimetry, and N2 adsorption (N2 adsorption) to achieve a comprehensive, full-scale analysis of the pore network in Ni-Fe industrial catalysts, spanning 1.48 nm to 365 μm. Through 3D reconstruction, the study unveiled complex structural features, such as cavity structures and “ink-bottle” pores, which are hard to capture with traditional single techniques. Comparing results from the three methods clarified the limitations of conventional approaches in analyzing complex pore sizes. Based on the pore characteristics of Ni-Fe catalysts, this study proposes a hierarchical pore structure design to optimize mass transfer and enhance performance. The integration of multiple techniques achieved complementary advantages, and the in-depth analysis based on this multimodal approach provides quantitative guidance for catalyst optimization and preparation. The findings offer a theoretical basis for developing more efficient and stable industrial catalysts and advancing catalyst design toward a digital and rational approach.
Keywords
INTRODUCTION
Catalytic technology is fundamental to the chemical industry, serving as a key driver of scientific advancement and industrial innovation. In heterogeneous catalysis, the pore structure - a conduit for material transport within the medium - has become a critical factor in investigating catalyst performance. Numerous studies have shown that meticulous pore engineering can significantly enhance catalytic performance[1-4]. However, pore plugging, due to factors such as temperature cycling, metal poisoning, and structural deformation, is a primary cause of catalyst deactivation[5,6]. It has been demonstrated that an optimally designed pore structure can greatly improve the accessibility of active sites, refine mass transfer efficiency, and increase the thermal and mechanical stability of the catalyst[7-9]. In industrial applications, the pore structure significantly affects pressure drop and bed stability within catalytic reactors[10]. Therefore, accurate characterization of catalyst pore structures is crucial not only for understanding the distribution of active sites and mass transfer properties but also for the development of new catalysts and the optimization of catalyst performance in industrial settings.
Pore structure, a key determinant of catalyst performance, is determined by their morphology and size, strongly influenced by the preparation techniques used. According to the International Union of Pure and Applied MIP Chemistry classification, pores are categorized by size into micropores (d < 2 nm, where d is the diameter of the pore), mesopores (2 nm ≤ d < 50 nm), and macropores (d ≥ 50 nm). The diverse pore structures observed across different scales play specific roles in catalyzing chemical reactions and enhancing mass transport efficiency[11-13]. Among the array of pore structure analysis techniques, mercury intrusion porosimetry (MIP), gas adsorption methods, and computed tomography (CT) scanning are among the most frequently utilized. These methods are particularly effective at analyzing pore structures at varying scales, providing insights into their function in catalysis and mass transport.
MIP is a well-established, albeit destructive, method for assessing material porosity by measuring the volume of mercury that intrudes into the pores under varying pressures. This technique offers an extensive testing range, covering pore diameters from 2 nm to 800 μm, but it is limited to the measurement of interconnected pores and may not fully disclose the complete pore characteristics of a material, particularly when it comes to closed pores[14]. Gas adsorption analysis, which determines the specific surface area and pore size distribution by analyzing the adsorption isotherms of gas molecules on the material's surface at different pressures, is a key technique for determining specific surface area and pore size distribution. While effective for microporous and mesoporous materials, its sensitivity is limited for macroporous materials, where weaker adsorption signals can lead to less accurate pore structure characterization[15-17]. These two methodologies, despite being extensively applied in pore structure analysis across various domains[18-20], encounter theoretical constraints. In particular, when examining complex pore geometries, such as ink-bottle pores with narrow necks and broad bodies, the computational models that assume cylindrical pores may not accurately reflect the actual conditions[21,22]. Such limitations could lead to an imprecise analysis of the material's intricate pore structure, consequently impairing a thorough comprehension of the material's performance. To address these challenges, advanced three-dimensional (3D) characterization techniques offer a more intuitive and precise approach to probing the internal pore structure of materials. These methods, such as CT and focused ion beam scanning electron microscopy (FIB-SEM), provide detailed 3D reconstructions of pore networks, enabling the accurate analysis of intricate pore geometries and facilitating a deeper comprehension of material behavior.
It is worth mentioning that FIB-SEM technology, with its remarkable resolution, holds a significant position in the field of 3D imaging, capable of achieving high-resolution 3D imaging ranging from a few nanometers to hundreds of nanometers. However, it has limitations in characterizing catalyst pores. First, the limited field of view restricts FIB-SEM’s ability to fully capture the overall structural characteristics of catalyst particles[23]. Second, gas adsorption analysis is a more viable alternative to FIB-SEM for detecting microporous structures, particularly in revealing pore size distribution and surface area details that are challenging to obtain with FIB-SEM. Furthermore, the high equipment costs, lengthy testing periods, and potential destructiveness further prompt this study to decide not to use FIB-SEM technology for the multiscale structural analysis of Ni-Fe catalysts.
CT technology, utilizing a non-destructive 3D imaging approach, offers detailed visualization of the internal structure of materials. Despite the limitations of traditional CT in resolution and quantitative analysis capabilities, the emergence of synchrotron CT has marked a significant breakthrough. This technology, with its high throughput, high resolution, and continuously adjustable energy, substantially enhances the non-destructive 3D inspection of materials[24]. Combined with advanced image processing, CT technology can quantitatively obtain key parameters like material size, porosity, pore size distribution, and connectivity, which are crucial for understanding the relationship between microstructures and macroscopic properties.
CT technology offers significant advantages in pore analysis. Unlike traditional methods, it provides detailed pore size and spatial distribution information. Its local, non-averaged nature improves accuracy and reliability in analyzing complex pore networks. Unlike MIP, CT technology can detect both connected and isolated pores, aiding in porous material preparation. Furthermore, the non-destructive nature of CT technology allows multidimensional, repeated characterization of individual particles, including 3D structure and elemental valence distribution, offering an efficient method for multimodal material characterization. In the characterization of complex materials with multiple structures and hierarchical levels, comprehensive characterization techniques are especially critical[25,26]. CT technology, which is capable of collecting data across various resolution modes, facilitates the observation of internal structural details at multiple scales. Its flexible resolution modes enable multiscale analysis of internal material structures. These advantages have made multiscale CT increasingly popular in fields like energy batteries, environmental materials, and chemical catalysis[27-34], playing a key role in characterizing complex materials. As a widely used characterization tool, CT technology is essential for material science and opens new possibilities for innovative material design and performance optimization. Through targeted structural analysis and optimization, CT technology is becoming a driving force in advancing material science.
This study leveraged an integrated approach, harnessing the complementary strengths of MIP, low-temperature N2 adsorption, and multiscale synchrotron radiation CT, to thoroughly investigate the pore network structure of a nickel-iron (Ni-Fe) based industrial catalyst. The concurrent application of these advanced techniques unveiled the intricate pore structure characteristics and delineated a comprehensive pore size distribution across the sample. This multidimensional characterization furnishes extensive structural insights, which are essential for a thorough comprehension of the catalyst’s performance and behavior under various conditions.
MATERIALS AND METHODS
Material
Ni-Fe-based catalysts are distinguished by a suite of advantageous properties, including low production costs, readily available raw materials, superior processability, and high redox activity. These characteristics render them highly effective in a spectrum of catalytic reactions, such as hydrogen production via water electrolysis, dry reforming of methane with CO2, steam reforming of ethanol, and the synthesis of gas from biomass tar[35-38]. The potential of these catalysts to replace more costly noble metal catalysts and to achieve broad industrial application is significant. However, in practical applications, Ni-Fe-based catalysts encounter challenges such as inadequate thermal stability, activity decay, and pore structure blockage[39,40]. A thorough investigation of the pore structure of Ni-Fe-based catalysts is essential for elucidating deactivation mechanisms, guiding the preparation and modification of catalysts, and exploring strategies to enhance catalytic performance.
Additionally, the energy range of the nano-CT beamline (5-14 keV) encompasses the absorption edges of Ni and Fe. Consequently, the Ni-Fe-based catalyst is not only suitable for current 3D structural and pore analysis but also ensures the feasibility of future element valence analysis. This meets the experimental requirements for developing a multimodal imaging method. Such characteristics make it an ideal choice for research, as it can support both current structural characterization and future in-depth chemical state analysis.
The sample in this study is an industrial-grade Ni-Fe-based catalyst purchased from LeYan (leyan.com.cn, Shanghai Haohong Biomedical Technology Co., Ltd.). As illustrated in Figure 1A, the unused catalyst appears as an orange-yellow powder with a density of approximately 2.417 g/cm3, and the particle size spans from 5 to 150 μm. Figure 1B shows the powder sample photographs within a glass capillary, indicating the granular sample's placement at the tip of a capillary. Figure 1C presents an optical microscope image of a single particle, highlighting its spherical morphology.
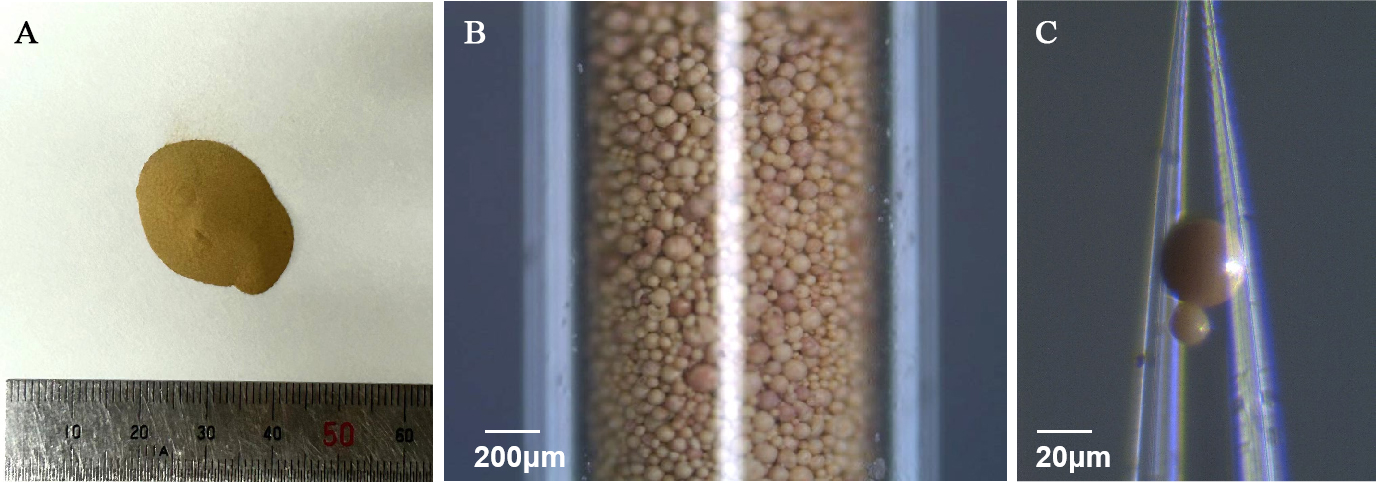
Figure 1. Photographs of the industrial Ni-Fe-based catalyst powder: (A) Powder sample; (B) Multiple particles packed in capillary; (C) Single particle located at the tip of a capillary tube. Ni-Fe: Nickel-iron.
Methods
MIP and N2 adsorption
The Micromeritics Auto Pore V9600 (Version 2.03.00) was utilized for MIP to assess porosity, featuring a measurement range from 0.002 to 800 μm. In the testing protocol, samples were preconditioned under vacuum conditions, followed by the incremental application of mercury pressure to record the corresponding intrusion volumes. Subsequently, pore size distribution and porosity were determined using the established Washburn equation as the computational algorithm. The high precision and automation of the equipment ensure the reliability of the data, and the analysis of two sample sets confirms the repeatability of the findings.
Additionally, nitrogen (N2) adsorption tests were conducted using the Micromeritics ASAP 2460 (Version 3.01.02). Prior to testing, the samples underwent vacuum treatment at 150 °C to remove surface moisture and other volatiles. The samples were then placed in liquid nitrogen at -196 °C, and nitrogen gas was gradually introduced to perform the adsorption experiment. During the adsorption process, the instrument measured changes in nitrogen volume at varying pressures to obtain isotherm adsorption curves. The pore size distribution of the material was analyzed using three distinct methods: Density Functional Theory (DFT), Non-Local Density Functional Theory (NLDFT), and the Horvath-Kawazoe (HK) method. The DFT method calculates pore size distribution by simulating the arrangement of adsorbate molecules within the pores[41]. In contrast, the NLDFT method offers an improved approach by incorporating non-local effects in the simulation, which can provide more accurate results for certain materials. Compared to DFT, NLDFT typically requires more computational resources but can yield better predictions for specific systems[41,42]. Meanwhile, the HK algorithm statistically analyzes the material’s pore size distribution based on the isotherm adsorption lines of the adsorbate molecules within the pores[43]. This equipment is equipped with a high-precision pressure and temperature control system, ensuring the accuracy and repeatability of the data.
Synchrotron radiation multiscale CT
The X-ray imaging and biomedical applications beamline BL13HB[44]and the 3D nano-imaging beamline BL18B[45] were established at the Shanghai Synchrotron Radiation Facility (SSRF). Utilizing these advanced beamlines, micro- and nano-CT were performed on the catalyst samples, enabling the non-destructive acquisition of 3D structural data.
The BL13HB beamline, as illustrated in Figure 2A, functions within an X-ray energy range of 0-40 keV. Its X-ray energy range is 8-40 keV and it is equipped with several sets of X-ray imaging detectors with different pixel sizes. By employing a 10×/20× lens, the system can achieve resolutions of 650 nm and 325 nm/pixel, respectively. Utilizing an X-ray energy of 20 keV, micro-CT scans were conducted at these two distinct resolutions to capture the 3D structures of both multiparticle and single-particle samples. The exposure times for individual projections were set to 2 seconds and 300 milliseconds. During the CT acquisition, the sample was rotated over a range of 0 ° to 180 °, and a total of 720 projection images were collected. Additionally, two background images were captured at 30 ° intervals to facilitate subsequent image processing.
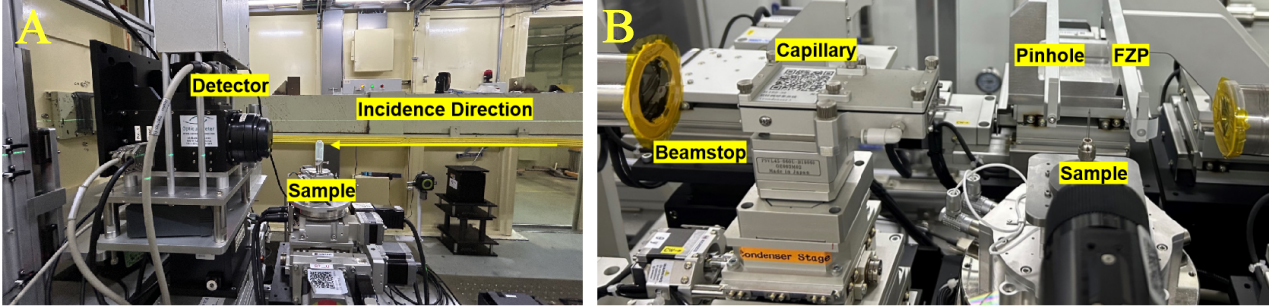
Figure 2. SSRF Multiscale CT beamlines (a) BL13HB: Micro-CT end-station (B) BL18B: nano-CT end-station. FZP: SSRF: Shanghai Synchrotron Radiation Facility; CT: computed tomography.
The nano-CT beamline BL18B, as depicted in Figure 2B, operates within an energy range of 5-14 keV. For the nano-CT of single-particle catalysts, an X-ray energy of 8.4 keV was selected, yielding a pixel size of 45 nm and an exposure time of 1.5 seconds per projection image. Throughout the scanning process, the sample was incrementally rotated from 0 ° to 180 ° with a step size of 0.5 °, culminating in the acquisition of 360 projection images. To enhance image processing, two background images were captured every 30 ° rotation.
The projection data were reconstructed using appropriate CT reconstruction algorithms to generate cross-sectional images suitable for 3D visualization analysis. Specifically, the projection data acquired from micro-CT were processed utilizing the PITRE software. Then, the nano-CT data underwent processing through the in-house developed Adu-Recon software. Following these initial steps, the slices data were imported into Avizo software for advanced 3D visualization and comprehensive quantitative analysis. Within this software, the Pore Network Model (PNM) module was employed to meticulously construct a network representation of the catalyst's pore structure, as detailed in[46].
RESULTS AND DISCUSSION
Porosity from MIP and N2 adsorption
MIP tests revealed a total porosity of 62.67% and an interstitial porosity of 47.63% for the Ni-Fe-based catalyst. These data were extrapolated to estimate the porosity of an individual particle at 28.72%. Supplementary Figure 1 shows the mercury intrusion and extrusion curves of MIP. The intrusion curve indicates that as the applied pressure increases, mercury initially penetrates the interparticle pores and subsequently infiltrates the intraparticle pores, resulting in an increase in cumulative volume. In contrast, the extrusion curve shows that mercury is not completely expelled from the sample, suggesting a complex pore structure within the catalyst. Figure 3 illustrates the pore volume versus pore size distribution curves obtained from both MIP and N2 adsorption using the DFT/HK algorithm. The MIP curves indicate that mercury intrusion peaks at 17.3 μm, 32.4 nm, and 9.1 nm, corresponding to increasing pressure levels. These peaks suggest that the catalyst's macropores, which represent the interstitial spaces between particles, predominantly fall within the range of 14-22 μm. Conversely, the mesopores, which are the internal pores within the particles, are primarily concentrated in the 7-40 nm range. In contrast, the DFT curve derived from N2 adsorption reveals a single peak at 12.6 nm.
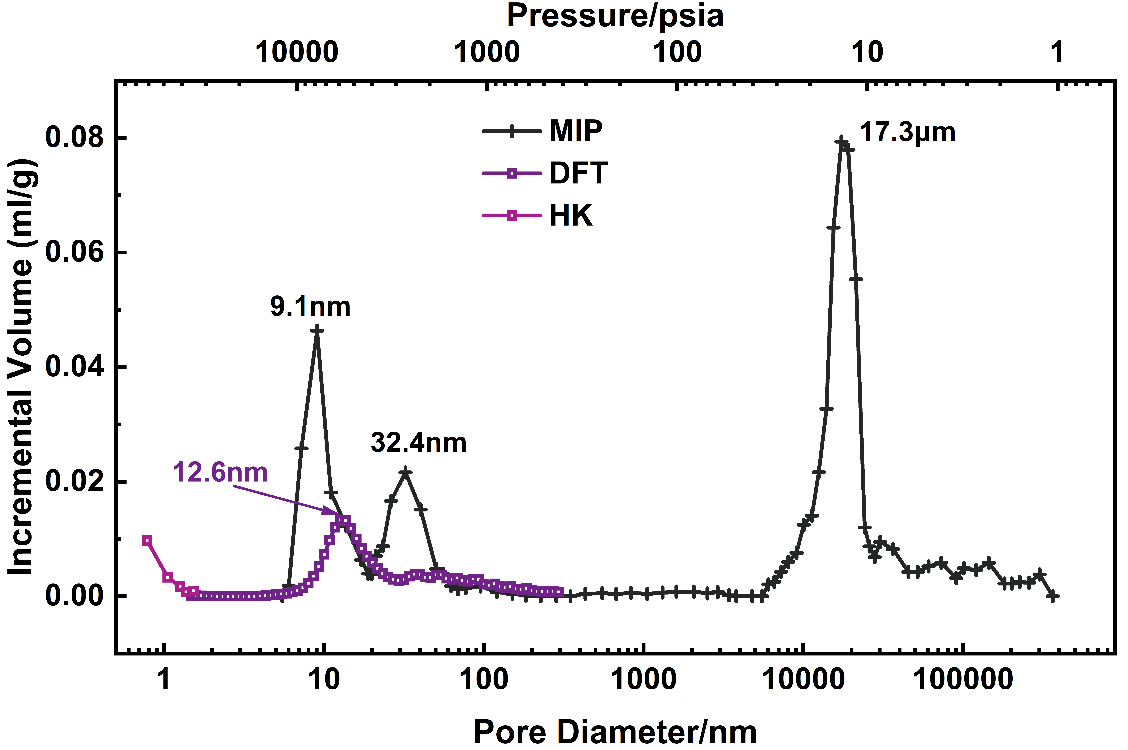
Figure 3. Pore diameter/pressure distribution curves of the catalyst from MIP and N2 adsorption (DFT and HK) methods, indicating the peak pore diameter of MIP and DFT methods, respectively. MIP: Mercury intrusion porosimetry; DFT: Density Functional Theory; HK: Horvath-Kawazoe.
Figure 3 illustrates the combination of MIP and N2 adsorption to enable comprehensive pore analysis across the full dimensional range of the Ni-Fe catalyst. However, the results of further analysis are not perfect. Due to the inherent theoretical constraints of MIP, pore size estimations for structures with an “ink-bottle” morphology may be underestimated. This is reflected in the MIP curve as a shift in the peak at 17.3 μm, which corresponds to interparticle pore dimensions. Considering the particle size and quasi-spherical shape of the sample, the peak position is likely to underestimate the true pore dimensions. According to MIP principles, pore diameter correlates directly with pressure, and mercury intrusion into pores under high pressure is recorded at the corresponding small pore dimension. For structures characterized by a smaller pore entrance relative to the cavity volume, the cavity volume may be erroneously recorded to the entrance diameter, thereby affecting the accuracy of pore analysis. This phenomenon also results in pronounced peaks at 32.4 nm and 9.1 nm, which may overstate the actual pore volume at these dimensions.
In the mesoporous range, the pore size distribution from the DFT model shows significant differences from that of MIP, indicating the complexity of pore structures at this scale. Meanwhile, in the microporous range, the DFT model failed to detect pores smaller than 1 nm, which were present in the HK model. To gain a deeper understanding of the pore size distribution of Ni-Fe-based catalysts in both microporous and mesoporous ranges, the NLDFT model was introduced in this study.
Figure 4A presents the pore size distribution curves of the DFT, NLDFT, and HK models on the same coordinate axis. The results indicate that the distribution trend of the NLDFT model is basically consistent with that of the DFT model, both showing more pore structures in the range of 10-30 nm. Furthermore, while the DFT model has certain limitations in analyzing complex pore structures, the NLDFT model reveals more details within the range of 2-100 nm.
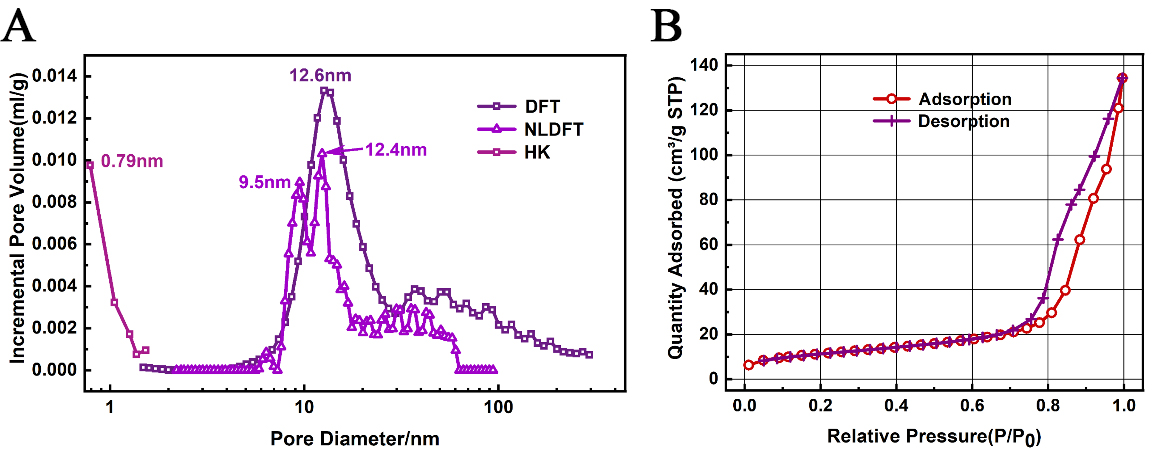
Figure 4. (A) Pore size distribution curves of Ni-Fe catalysts obtained using DFT, NLDFT and HK models; (B)N2 adsorption/desorption isotherms showing a hysteresis loop that closes at P/P0 = 0.67, slightly higher than the typical H2 type. Ni-Fe: Nickel-iron; DFT: Density Functional Theory; NLDFT: Non-Local Density Functional Theory; HK: Horvath-Kawazoe.
It is worth noting that the NLDFT model also did not detect ultra-microporous structures below 1 nm, which is in contrast to the peak at 0.79 nm in the HK model. In combination with the isotherm adsorption curve, Figure 4B shows the isotherm adsorption/desorption curve of the catalyst sample, and it is evident that the curve has a hysteresis loop, which closes at P/P0 = 0.67, slightly higher than the conventional H2-type hysteresis loop, indicating the presence of ink-bottle pores. The HK model is calculated based on the “slit pore” assumption, while the “cylindrical pore” assumption used by the DFT and NLDFT models is more credible in this case. In addition, it has been reported in the literature that typical Ni-Fe-based catalysts do not have ultra-micropores smaller than 1 nm[39,47-49]. Based on the current analysis, we tend to believe that the micropore distribution fitted by the DFT curve is more in line with reality, and the peak at 0.79 nm in the HK model is a false positive signal.
After the above analysis, we have gained a preliminary understanding of the pore characteristics and pore size distribution of the catalyst samples. However, both methods provide average information, and the cause of the peak formation in the MIP mesoporous range remains uncertain. Further analysis using multiscale CT is required to obtain specific pore structure and pore size information.
3D image-based multiscale CT
Figure 5, reconstructed with micro-CT technology at a pixel resolution of 650 nm, illustrates a multiparticle sample of the catalyst. Figure 5A displays a cross-sectional view of the sample in the x-y plane, highlighting the hollow architecture of certain particles. The 3D representation in Figure 5B vividly demonstrates the irregular sizes and quasi-spherical form of the catalyst particles. Figure 5C offers detailed insights into the large central pores of these hollow particles, with a color scale indicating the spatial distribution of particles and pores based on equivalent diameter. Figure 5D presents a statistical analysis of the frequency distribution for both the outer and inner diameters of the catalyst particles, revealing an average particle diameter of 74 microns. Approximately 77.5% of the particles are within the diameter range of 45 to 95 μm, conforming to a Gaussian distribution. The void fraction of the catalyst particles is approximately 43%, with 93% of hollow particles having an internal diameter of less than 25 μm. Furthermore, the interconnected pore structure among the multiparticle gaps was extracted [Supplementary Figure 3A]. The total porosity, as determined by micro-CT at a pixel size of 650 nm, is 39.42%, with inter-particle porosity accounting for 34.84%. The porosity within an individual particle is 7.82%. It is crucial to acknowledge that, due to the limitations of resolution, the measured porosity may encompass a significant margin of error.
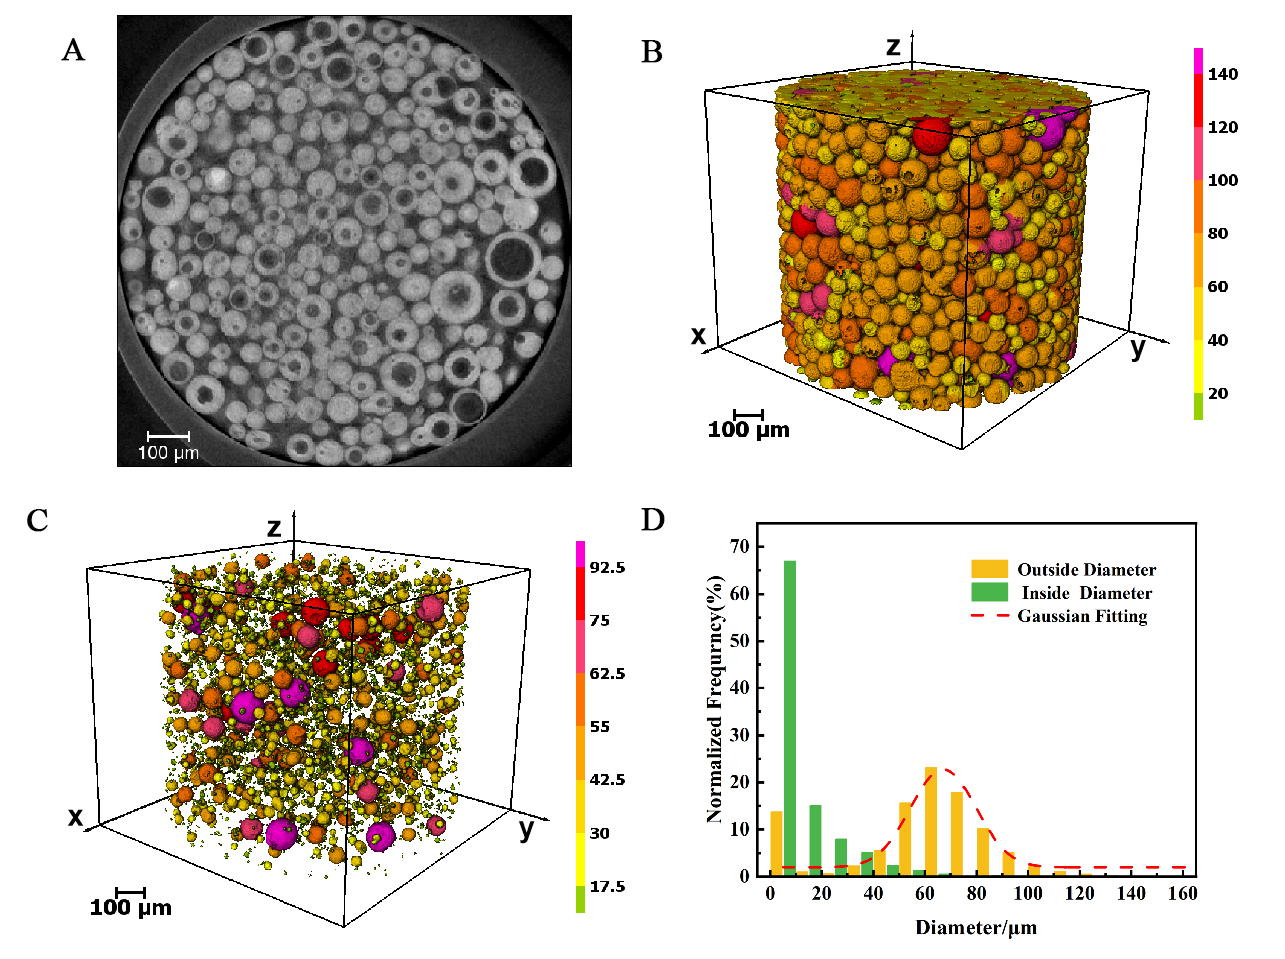
Figure 5. Micro-CT (650 nm/pixel) analysis of multiparticle catalyst structure. (A) Slice from the transverse x-y plane of the original data; (B) 3D reconstruction image of the multiparticle catalyst, showing the spheroid shape of the particles; (C) A detailed view of the central large pore within a representative hollow catalyst particle, highlighting the complex pore structure. The color of the particles and pore structure corresponds to the equivalent diameter on the scale to distinguish the particles of different sizes; (D) Normalized frequency distribution diagram of catalyst particle outer diameter and hollow particle inner diameter, showing the particle size and hollow degree of catalyst. CT: Computed tomography.
To deepen our understanding of the pore characteristics within catalyst particles of diverse structures, high-resolution CT scans were conducted on individual particles exhibiting both hollow and solid morphologies. Figure 6 compiles multiscale CT outcomes for four distinct particles: Figure 6A and B were acquired using micro-CT with a pixel resolution of 325 nm, whereas Figure 6C and D were derived from nano-CT with a pixel resolution of 45 nm. Figure. 6A1-D1 presents central cross-sectional views of the four catalyst particles in the x-y plane, while Figure 6A2-D2 depicts their corresponding 3D images. These visualizations vividly highlight the structural attributes of both solid and hollow particles. The images reveal the external morphology and internal architecture of the particles, featuring pores that penetrate from the surface to the core, a profusion of irregularly arranged internal pore structures, and hollow particles with inner surfaces connected to external minor pores through channels.
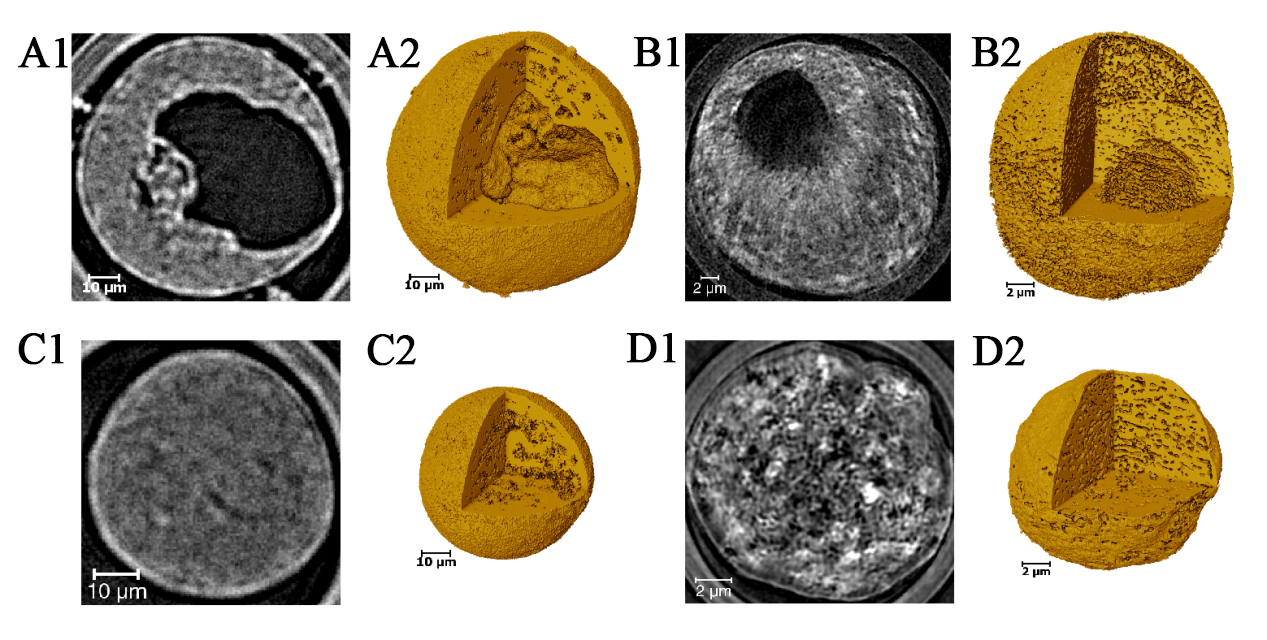
Figure 6. Multiscale CT images of four single catalyst particles: (A) and (B) acquired by micro-CT with a pixel size of 325 nm, and (C) and (D) acquired by nano-CT with a pixel size of 45 nm. (A1-D1) Central x-y plane slices of the four catalyst particles, revealing a significant amount of internal porosity; (A2-D2) 3D images of the four catalyst particles, demonstrating the morphology and internal structure, clearly distinguishing between solid and hollow particles. CT: Computed tomography.
The interconnected pore structures within the catalyst were successfully extracted through threshold segmentation using Avizo software, as evidenced in Figure 7A1-D1. This analysis confirms the pervasive distribution of pores throughout the particles. Table 1 offers a detailed summary of the size characteristics, total porosity, connected porosity, and the large pore volume rate for hollow particles, which are defined as hollow porosity and calculated based on CT, across four distinct particles. The data underscore an exceptional level of internal pore connectivity, with values as high as 97%. A comparison of porosities derived from CT at varying resolutions reveals a consistent correlation between the catalyst’s structural attributes and its porosity across different scales. While hollow structures significantly contribute to increased porosity, the presence of other minute pore structures is equally vital for establishing a robust connected pore network.
Dimensions and porosity of four single-particle catalysts obtained from multiscale CT
| Particle ID | Diameter/μm | Inside Diameter/μm | Total Porosity | Connected Porosity | Hollow Porosity |
| a | 94.8 | 50.8 | 34.6% | 33.9% | 15.8% |
| b | 21.14 | 12.4 | 39.5% | 39.1% | 6.7% |
| c | 59.6 | - | 27.9% | 27.1% | |
| d | 15.7 | - | 24.3% | 23.4% |
Figure 7A2-D2 showcases the PNM constructed from the interconnected pore structures, utilizing a color scale to denote the sizes of the equivalent pore and throat diameters. The PNM model encapsulates the complex architecture of porous materials, portraying it as a network of pores and throats. Within this framework, pores are visualized as spheres, while throats are represented as cylinders that link these spheres. As depicted in Figure 7A2 and B2, the hollow structures within the PNM are analogous to the largest red spheres in terms of diameter, which are connected to a multitude of pores through throats. Pore structures akin to those found in solid particles exhibit a sophisticated and interconnected arrangement.
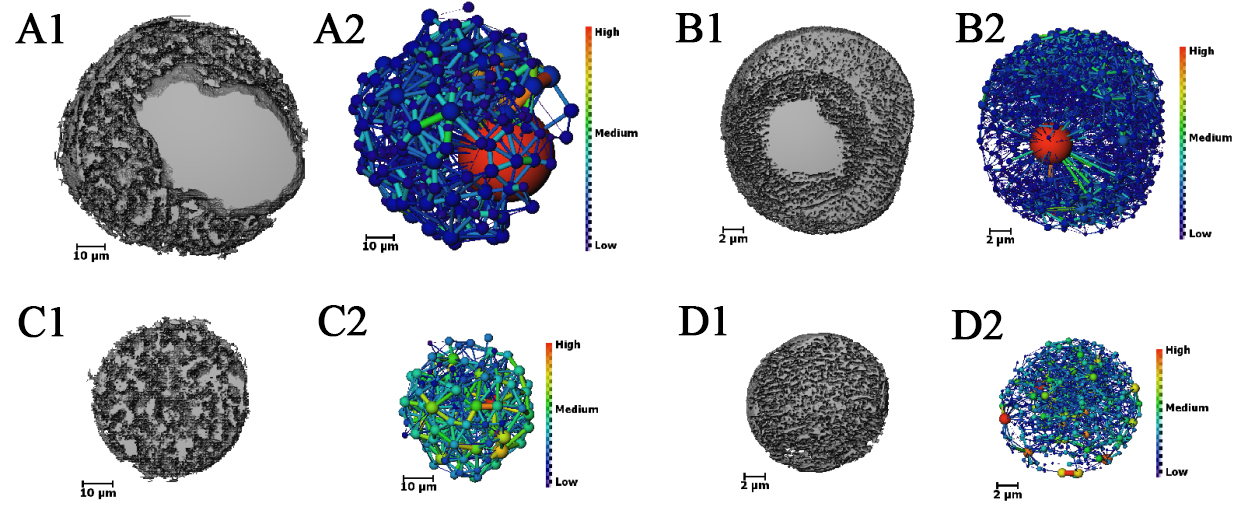
Figure 7. Extraction of the connected pore structures from four single-particle catalysts and the construction of corresponding PNM: (A1-D1) These images reveal the connected pore structures within the catalyst particles, with the distribution and characteristics of the pores clearly observable. (A2-D2) The corresponding PNM simplifies the pore structures into a network representation, making the pore features of both solid and hollow particles more pronounced. PNM: Pore Network Model.
Figure 8 presents a comprehensive quantitative analysis of the PNM derived from four catalyst particles. Figure 8A and B illustrate the frequency distribution of pore sizes and the corresponding distribution curve of pore capacity as a function of pore size for these particles. The distinctive structural attributes of hollow particles (a, b) are manifested in Figure 8A and B as discrete points at larger pore sizes and a pronounced escalation in pore capacity values, respectively. Moreover, the catalyst particles are found to possess a considerable number of small pores, a fact substantiated by the presence of distinct small peaks in the frequency distribution curves and the observed shift of these peaks toward smaller sizes in comparison to the general pore size distribution curves.
Figure 8. Quantitative analysis of the PNM for four catalyst particles: (A) Normalized frequency distribution of pore diameters; (B) Pore volume distribution as a function of pore diameter; (C) Distribution of coordination numbers as a function of pore diameter; (D) Normalized frequency distribution of throat diameters. PNM: Pore Network Model.
Figure 8C delineates the distribution curve of the coordination number of pores as a function of pore diameter. The coordination number, which quantifies the number of connections between a pore and its associated throat channels, provides a measure of the pore structure's connectivity. The curve exhibits an increasing trend in coordination numbers with larger pore sizes, particularly for hollow large pores, which display markedly elevated coordination numbers, indicative of a highly connected network. It is noteworthy that the coordination numbers derived from nano-CT substantially exceed those from micro-CT, implying that higher-resolution imaging captures finer details of the pore structure. Figure 8D presents the frequency distribution of throat diameters, with the minimum resolvable throat diameters being 50 nm and 200 nm at the respective resolutions. These values are considerably smaller than the corresponding pore sizes, suggesting a significant prevalence of 'ink-bottle' characteristic pores within the catalyst particles.
Furthermore, to bolster the reliability of our findings and to counteract the potential effects of randomness, an analysis was conducted on an additional six catalysts with varying morphologies [Supplementary Table 1 and Supplementary Figure 2]. The average porosity for the initial cohort of four particles was determined at the corresponding CT resolutions, concurrent with their pore size distributions. The data indicate that the mean porosity of individual particles, as measured by CT at a pixel size of 325 nm, is 24.59%. The mean porosity rises to 26.27% when the pixel size is reduced to 45 nm.
Discussion
Table 2 summarizes the porosity and pore size ranges measured by MIP, N2 adsorption (DFT), and multiscale CT in this study.
Summary of the results from the characterization of the pore structure of industrial Ni-Fe-based catalysts using MIP, N2 adsorption (DFT) and Multiscale CT
| Test Method | DFT | Multiscale CT | MIP | |||
| 45.5 nm | 325 nm | 650 nm | ||||
| Volume Porosity | Total porosity | - | - | - | 39.42% | 62.40% |
| Interstitial porosity | - | - | - | 34.84% | 47.63% | |
| Particle porosity | - | 26.27% | 24.59% | 7.82% | 28.72% | |
| Test Range(nm) | 1.48-317.98 | 350-2200 | > 500 | > 3225 | 5.68-36347.80 | |
Differences exist in the total, interparticle, and intraparticle porosity measured by MIP and multiscale CT. The difference in total porosity is mainly due to the resolution limitations of multiparticle micro-CT, which can only identify interparticle pores and hollow structures but not the smaller intraparticle pores. Additionally, the interparticle porosity measured by MIP is higher than that by CT, possibly due to different sample loading conditions and MIP capturing some intraparticle pores. In particle porosity testing, the porosity measured by low-resolution CT is significantly lower than that by MIP. However, as the resolution increases, the CT-measured porosity approaches the MIP results. This trend shows that high-resolution CT has great potential in measuring the porosity of porous materials and can provide porosity data comparable to MIP. This consistency highlights the value of high-resolution CT in quantitative porosity analysis, especially when detailed pore structure analysis is needed.
Three techniques, each covering a specific pore size range, are used to characterize the pore structure of the Ni-Fe-based industrial catalyst. N2 adsorption (DFT) effectively analyzes micropores to mesopores (1.48-317.98 nm). MIP covers mesopores to macropores (5.68-36,347.80 nm). Multiscale CT has a conventional detection limit of 350 nm but can reach 50 nm when considering pore throat diameters, and it excels in 3D macropore characterization. Although the HK method is theoretically suitable for micropore analysis, it was less effective here. The micropore to mesopore analysis mainly relies on the DFT model (see Section Porosity from MIP and N2 adsorption). By integrating the comparative analysis of different models (HK, DFT, NLDFT) in N2 adsorption experiments with complementary data from MIP and multiscale CT, a comprehensive pore size distribution across all scales is constructed. This strategy, combining the strengths of various techniques, ensures an accurate and thorough characterization of the catalyst’s pore structure and strengthens the understanding of its physicochemical properties.
To comprehensively analyze the pore structure of the Ni-Fe-based catalyst, we normalized the pore size distribution curves from three techniques and presented them on the same axis [Figure 9]. Overlapping measurement ranges of different techniques should theoretically yield consistent results.
Figure 9. Presents the full-scale pore size distribution of industrial Ni-Fe-based catalysts, obtained by combining MIP, N2 adsorption (HK & DFT algorithm), and multiscale CT. The curves labeled Multiparticle, Particle (a and b), and Particle (c and d) correspond to CT data with pixel sizes of 650 nm, 325 nm, and 45 nm, respectively. Ni-Fe: Nickel-iron; MIP: mercury intrusion porosimetry; HK: Horvath-Kawazoe; DFT: density functional theory; CT: computed tomography.
MIP and multiscale CT both cover the macroporous range, yet Figure 9 shows no overlapping peaks between their curves. As speculated in Section Porosity from MIP and N2 adsorption, the peak at 17.3 μm in the MIP curve does not match the actual particle interstitial pore size. Instead, it is due to the “ink-bottle” pore structure, which causes an underestimation of the interstitial pore size. In micro-CT, performing PNM [Supplementary Figure 3A] analysis on interparticle connected pores [Supplementary Figure 3B] shows that the Multiparticle curve peak corresponds to the equivalent spherical diameter distribution, while the MIP curve peak at 17.3 μm reflects the equivalent throat diameter distribution. Thus, MIP alone cannot accurately characterize interparticle pore sizes, necessitating micro-CT as a supplement.
Within the mesoporous range, the MIP curve shows two significant peaks (32.4 nm and 9.1 nm), with high intensities (reaching 58.2% and 27.8% of the interparticle pore peak, respectively). The “overestimated” phenomenon was explained in Section Porosity from MIP and N2 adsorption: the pore body volume of ink-bottle pores is recorded under the entrance size. 3D structural analysis in Section 3D image-based multiscale CT using multiscale CT clarifies the mercury intrusion process in MIP experiments. After mercury fills interparticle voids, further pressure increases drive mercury through surface-connected channels into internal pores, filling internal pore bodies and causing a peak at 32.4 nm. As pressure rises, mercury enters smaller pores or hollow particle structures via internal surface channels, creating a peak at 9.1 nm. Thus, the pore characteristics shown in the single-particle curves (Particle a-d) are “compressed” into these two mesoporous peaks in MIP, so there are no obvious corresponding peaks for Particles (a-d) in the MIP curve. To summarize, the formation of the 9.1 nm peak results from the combined effects of tiny pores and hollow structures.
In conclusion, the combined use of MIP, N2 adsorption, and multiscale CT has enabled a comprehensive, 3D analysis of the pore network in Ni-Fe industrial catalysts, revealing complex structural characteristics that are difficult to capture with traditional single-characterization methods. The catalysts exhibit a highly interconnected pore network with 97% porosity connectivity, theoretically facilitating reactant diffusion and product desorption. However, the presence of numerous “ink-bottle” pores and cavity structures can pose several drawbacks: “ink-bottle” pores may create local diffusion barriers that limit reaction rates, cavities may collapse under high pressure or thermal cycling, potentially compromising mechanical stability, and reactants may become trapped within cavities, promoting side reactions.
To address these challenges, it is recommended to consider hierarchical pore structure designs in industrial catalysts. Specifically, optimizing the preparation process can enhance cavity stability and convert some “ink-bottle” pores into through-mesopores, thereby improving mass transfer pathways. This strategy not only boosts mass transfer efficiency but also enhances mechanical and chemical stability, leading to overall improved catalyst performance. This in-depth analysis, based on multimodal technology, provides quantitative guidance for catalyst optimization and preparation, helping to develop more efficient and stable industrial catalysts.
CONCLUSIONS
This study employed a multimodal approach combining MIP, N2 adsorption, and multiscale CT to conduct a comprehensive, full-scale analysis of the pore network structure in Ni-Fe-based industrial catalysts. N2 adsorption demonstrated excellent resolution for micropores and mesopores, while MIP covered the range from mesopores to macropores. Multiscale CT provided unique advantages in characterizing the 3D structure of macropores. By integrating the results from these techniques, we constructed a pore size distribution that spans the entire range of pore sizes. The limitations of traditional methods were addressed through the complementary use of multiscale CT. The presence of numerous “ink-bottle” pores and cavity structures was identified as the primary cause of the systematic shift toward smaller pore sizes in MIP measurements. Spatial resolution differences between CT and MIP emerged as a key factor in porosity discrepancies. Notably, in single-particle porosity testing, CT results converged with MIP data as the resolution increased, highlighting the potential of high-resolution CT for accurate porosity measurements in porous materials.
Multiscale CT revealed that Ni-Fe catalyst particles are spherically distributed with an average diameter of 74 micrometers, following a Gaussian distribution, and approximately 43% of the particles contain cavities. By constructing a PNM, we uncovered a complex pore network with 97% connectivity, theoretically beneficial for reactant diffusion and product desorption. However, the abundance of "ink-bottle" pores and cavity structures may impede reaction rates and affect mechanical stability. To address these challenges, we propose a hierarchical pore structure design. By optimizing the preparation process to enhance cavity stability and converting some “ink-bottle” pores into through-mesopores, mass transfer pathways can be optimized. This strategy not only improves mass transfer efficiency but also enhances mechanical and chemical stability, thereby boosting overall catalyst performance.
This study, via integrated multimodal technology, offers a robust scientific foundation for optimizing and preparing Ni-Fe-based industrial catalysts. It promotes the research paradigm of “technical synergy - mechanism analysis - preparation feedback”, spurring the shift from empirical trial-and-error to digital design in industrial catalysts and laying a methodological foundation for the rational development of non-precious metal catalytic materials.
Future research will focus on changes in catalyst structure before and after reactions, including pore structure, elemental distribution, and valence states. By integrating X-ray absorption near-edge structure with CT imaging, we aim to develop a multimodal characterization technique capable of elucidating the intrinsic mechanisms of catalyst activity and deactivation across multiple scales and dimensions. This approach will provide critical insights for designing more efficient and durable catalytic systems. Overall, this study lays a robust scientific foundation for optimizing and preparing Ni-Fe-based industrial catalysts, advancing the development of high-performance catalysts for industrial applications.
DECLARATIONS
Authors’ contributions
Made substantial contributions to the conception and design of the study and performed data analysis and interpretation: Huang, Y.; Deng, B.
Performed data acquisition, provided administrative, technical, and material support: Tao, F.; Zhang, L.; Wang, J.; Du, G.; Xiao, T.
Availability of data and materials
Some results of supporting the study are presented in the Supplementary Materials. Other raw data that support the findings of this study are available from the corresponding author upon reasonable request.
Financial support and sponsorship
This work was supported by the National Key Research and Development Program of China (Grant Nos.2021YFA1600700, 2021YFF0701202, 2021YFA1601001) and the National Natural Science Foundation of China (Grant No.12275343).
Conflicts of interest
All authors declared that there are no conflicts of interest.
Ethical approval and consent to participate
Not applicable.
Consent for publication
Not applicable.
Copyright
© The Author(s) 2025.
Supplementary Materials
REFERENCES
1. Zhang, W.; Li, J.; Wei, Z. Carbon-based catalysts of the oxygen reduction reaction: Mechanistic understanding and porous structures. Chin. J. Catal. 2023, 48, 15-31.
2. Wang, C.; Zhang, H.; Wang, Y.; et al. A general strategy for the synthesis of hierarchically ordered metal-organic frameworks with tunable macro-, meso-, and micro-pores. Small 2023, 19, e2206116.
3. Naseem, F.; Lu, P.; Zeng, J.; et al. Solid nanoporosity governs catalytic CO2 and N2 reduction. ACS. Nano. 2020, 14, 7734-59.
4. Wang, A.; Ma, Y.; Zhao, D. Pore engineering of porous materials: effects and applications. ACS. Nano. 2024, 18, 22829-54.
5. Tsakalis, K. Deactivation phenomena by site poisoning and pore blockage: The effect of catalyst size, pore size, and pore size distribution. J. Catal. 1984, 88, 188-202.
6. F. The research progress of catalyst inactivation by poisoning in tar reforming. Min. Eng. 2024, 12, 314-20.
7. Wei, G.; Li, C.; Ge, W.; Li, J. Simulation of pores-scale reaction? Chin. J. Process. Eng. 2021, 21, 265-76.
8. Wild, S.; Mahr, C.; Rosenauer, A.; Risse, T.; Vasenkov, S.; Bäumer, M. New perspectives for evaluating the mass transport in porous catalysts and unfolding macro- and microkinetics. Catal. Lett. 2023, 153, 3405-22.
9. Guan, S.; Zhou, F.; Tan, J.; Pan, M. Influence of pore size optimization in catalyst layer on the mechanism of oxygen transport resistance in PEMFCs. Prog. Nat. Sci:. Mater. Int. 2020, 30, 839-45.
10. Weng, J.; Liu, X.; Yu, J.; et al. Influence of hollow structure of honeycomb catalysts on the pressure drop in packed bed reactors. Chin. J. Chem. Eng. 2022, 73, 266-74.
11. Li, C.; Ren, Y.; Gou, J.; Liu, B.; Xi, H. Facile synthesis of mesostructured ZSM-5 zeolite with enhanced mass transport and catalytic performances. Appl. Surf. Sci. 2017, 392, 785-94.
12. Feng, C.; Liu, J.; Zhao, K.; et al. Influence of pore structure on catalytic performance of Cs-Zr/SiO2 catalyst for methyl methacrylate synthesis from methyl propionate and formaldehyde. Chem. Eng. Sci. 2025, 301, 120760.
13. Tsai, S. B.; Ma, H. A research on preparation and application of the monolithic catalyst with interconnecting pore structure. Sci. Rep. 2018, 8, 16605.
14. Windslow, D.; Diamond, S. A Mercury Porosimetry Study of the Evolution of Porosity in Portland Cement : Technical Publication. Publication FHWA/IN/JHRP-69/31. Joint Highway Research Project, Indiana Department of Transportation and Purdue University, West Lafayette, Indiana, 1969.
15. Juenger MC, Jennings HM. The use of N2 adsorption to assess the microstructure of cement paste. Cem. Concr. Res. 2001, 31, 883-92.
16. Wang, J.; Guo, X. Adsorption isotherm models: classification, physical meaning, application and solving method. Chemosphere 2020, 258, 127279.
17. Cychosz, K. A.; Guillet-Nicolas, R.; García-Martínez, J.; Thommes, M. Recent advances in the textural characterization of hierarchically structured nanoporous materials. Chem. Soc. Rev. 2017, 46, 389-414.
18. Fu, S.; Fang, Q.; Li, A.; et al. Accurate characterization of full pore size distribution of tight sandstones by low-temperature nitrogen gas adsorption and high-pressure mercury intrusion combination method. Energy. Sci. Eng. 2021, 9, 80-100.
19. Liu, J.; Ma, J.; Jiang, X.; Jiang, X. The multi-scale pore structure of superfine pulverized coal. Part 1. macropore morphology. Fuel 2021, 304, 120728.
20. Zeng, Q.; Li, K.; Fen-chong, T.; Dangla, P. Pore structure characterization of cement pastes blended with high-volume fly-ash. Cem. Concr. Res. 2012, 42, 194-204.
21. Zhang, Y.; Wu, K.; Yang, Z.; Ye, G. A reappraisal of the ink-bottle effect and pore structure of cementitious materials using intrusion-extrusion cyclic mercury porosimetry. Cem. Concr. Res. 2022, 161, 106942.
22. Morishige, K.; Tateishi, N. Adsorption hysteresis in ink-bottle pore. J. Chem. Phys. 2003, 119, 2301-6.
23. Mousa, S.; Novak, V.; Fletcher, R. S.; et al. Integration of multi-scale porosimetry and multi-modal imaging in the study of structure-transport relationships in porous catalyst pellets. Chem. Eng. J. 2023, 452, 139122.
24. Withers, P. J.; Bouman, C.; Carmignato, S.; et al. X-ray computed tomography. Nat. Rev. Methods. Primers. 2021, 1, 15.
25. Chu, Y. S.; Lee, W.; Tappero, R.; et al. Multimodal, multidimensional, and multiscale X-ray imaging at the national synchrotron light source II. Synchrotron. Radiat. News. 2020, 33, 29-36.
26. Zhou, Z.; Bouwman, W. G.; Schut, H.; et al. From nanopores to macropores: fractal morphology of graphite. Carbon 2016, 96, 541-7.
27. Ziesche, R. F.; Heenan, T. M. M.; Kumari, P.; et al. Multi-dimensional characterization of battery materials. Adv. Energy. Mater. 2023, 13, 2300103.
28. Weber, S.; Zimmermann, R. T.; Bremer, J.; et al. Digitization in catalysis research: towards a holistic description of a Ni/Al2O3 reference catalyst for CO2 methanation. ChemCatChem 2022, 14, e202101878.
29. Qie, Z.; Rabbani, A.; Liang, Y.; et al. Multiscale investigation of pore network heterogeneity and permeability of fluid catalytic cracking (FCC) particles. Chem. Eng. J. 2022, 440, 135843.
30. Das, S.; Pashminehazar, R.; Sharma, S.; Weber, S.; Sheppard, T. L. New dimensions in catalysis research with hard X-ray tomography. Chemie. Ingenieur. Technik. 2022, 94, 1591-610.
31. Zaccarine, S. F.; Shviro, M.; Weker, J. N.; et al. Multi-Scale Multi-technique characterization approach for analysis of PEM electrolyzer catalyst layer degradation. J. Electrochem. Soc. 2022, 169, 064502.
32. Prass, S.; Hasanpour, S.; Sow, P. K.; Phillion, A. B.; Mérida, W. Microscale X-ray tomographic investigation of the interfacial morphology between the catalyst and micro porous layers in proton exchange membrane fuel cells. J. Power. Sources. 2016, 319, 82-9.
33. da, Silva. J. C.; Mader, K.; Holler, M.; et al. Assessment of the 3D pore structure and individual components of preshaped catalyst bodies by X-ray imaging. ChemCatChem 2015, 7, 413-6.
34. Hwang, J.; Jo, C.; Hur, K.; Lim, J.; Kim, S.; Lee, J. Direct access to hierarchically porous inorganic oxide materials with three-dimensionally interconnected networks. J. Am. Chem. Soc. 2014, 136, 16066-72.
35. Theofanidis, S. A.; Galvita, V. V.; Poelman, H.; Marin, G. B. Enhanced carbon-resistant dry reforming Fe-Ni catalyst: role of Fe. ACS. Catal. 2015, 5, 3028-39.
36. Wu, L.; Yu, L.; Zhang, F.; et al. Heterogeneous bimetallic phosphide Ni2P-Fe2P as an efficient bifunctional catalyst for water/seawater splitting. Adv. Funct. Mater. 2021, 31, 2006484.
37. Zhao, L.; Wei, Y.; Huang, Y.; Liu, Y. La1-xKxFe0.7Ni0.3O3 catalyst for ethanol steam reforming - the effect of K-doping. Catal. Today. 2016, 259, 430-7.
38. Xie, Q.; Ren, D.; Bai, L.; et al. Investigation of nickel iron layered double hydroxide for water oxidation in different pH electrolytes. Chin. J. Catal. 2023, 44, 127-38.
39. Wang, W.; Liu, Y.; Chen, S. Use of NiFe layered double hydroxide as electrocatalyst in oxygen evolution reaction: catalytic mechanisms, electrode design, and durability. Acta. Physico-Chimica. Sinica. 2024, 40, 2303059.
40. Zhao, J.; Zhang, J. J.; Li, Z. Y.; Bu, X. H. Recent progress on NiFe-based electrocatalysts for the oxygen evolution reaction. Small 2020, 16, e2003916.
41. Landers, J.; Gor, G. Y.; Neimark, A. V. Density functional theory methods for characterization of porous materials. Colloids. Surf. A:. Physicochem. Eng. Asp. 2013, 437, 3-32.
42. Kupgan, G.; Liyana-Arachchi, T. P.; Colina, C. M. NLDFT pore size distribution in amorphous microporous materials. Langmuir 2017, 33, 11138-45.
43. Zhang, J.; Zhang, W. Comparison of common classical analytical models for microporous adsorption. Univ. Chem. 2023, 38, 326-32.
44. Ji, J.; Guo, H.; Xue, Y.; et al. The new X-ray imaging and biomedical application beamline BL13HB at SSRF. Nucl. Sci. Tech. 2023, 34, 1349.
45. Zhang, L.; Tao, F.; Wang, J.; et al. The 3D nanoimaging beamline at SSRF. Nucl. Sci. Tech. 2023, 34, 1347.
46. Rabbani, A.; Jamshidi, S.; Salehi, S. An automated simple algorithm for realistic pore network extraction from micro-tomography images. J. Petrol. Sci. Eng. 2014, 123, 164-71.
47. Liu, G.; Wang, K.; Gao, X.; He, D.; Li, J. Fabrication of mesoporous NiFe2O4 nanorods as efficient oxygen evolution catalyst for water splitting. Electrochimica. Acta. 2016, 211, 871-8.
48. Jin, R.; Jiang, H.; Sun, Y.; Ma, Y.; Li, H.; Chen, G. Fabrication of NiFe2O4/C hollow spheres constructed by mesoporous nanospheres for high-performance lithium-ion batteries. Chem. Eng. J. 2016, 303, 501-10.
Cite This Article
How to Cite
Download Citation
Export Citation File:
Type of Import
Tips on Downloading Citation
Citation Manager File Format
Type of Import
Direct Import: When the Direct Import option is selected (the default state), a dialogue box will give you the option to Save or Open the downloaded citation data. Choosing Open will either launch your citation manager or give you a choice of applications with which to use the metadata. The Save option saves the file locally for later use.
Indirect Import: When the Indirect Import option is selected, the metadata is displayed and may be copied and pasted as needed.
About This Article
Copyright

Data & Comments
Data
0


Comments
Comments must be written in English. Spam, offensive content, impersonation, and private information will not be permitted. If any comment is reported and identified as inappropriate content by OAE staff, the comment will be removed without notice. If you have any queries or need any help, please contact us at support@oaepublish.com.