



fig4
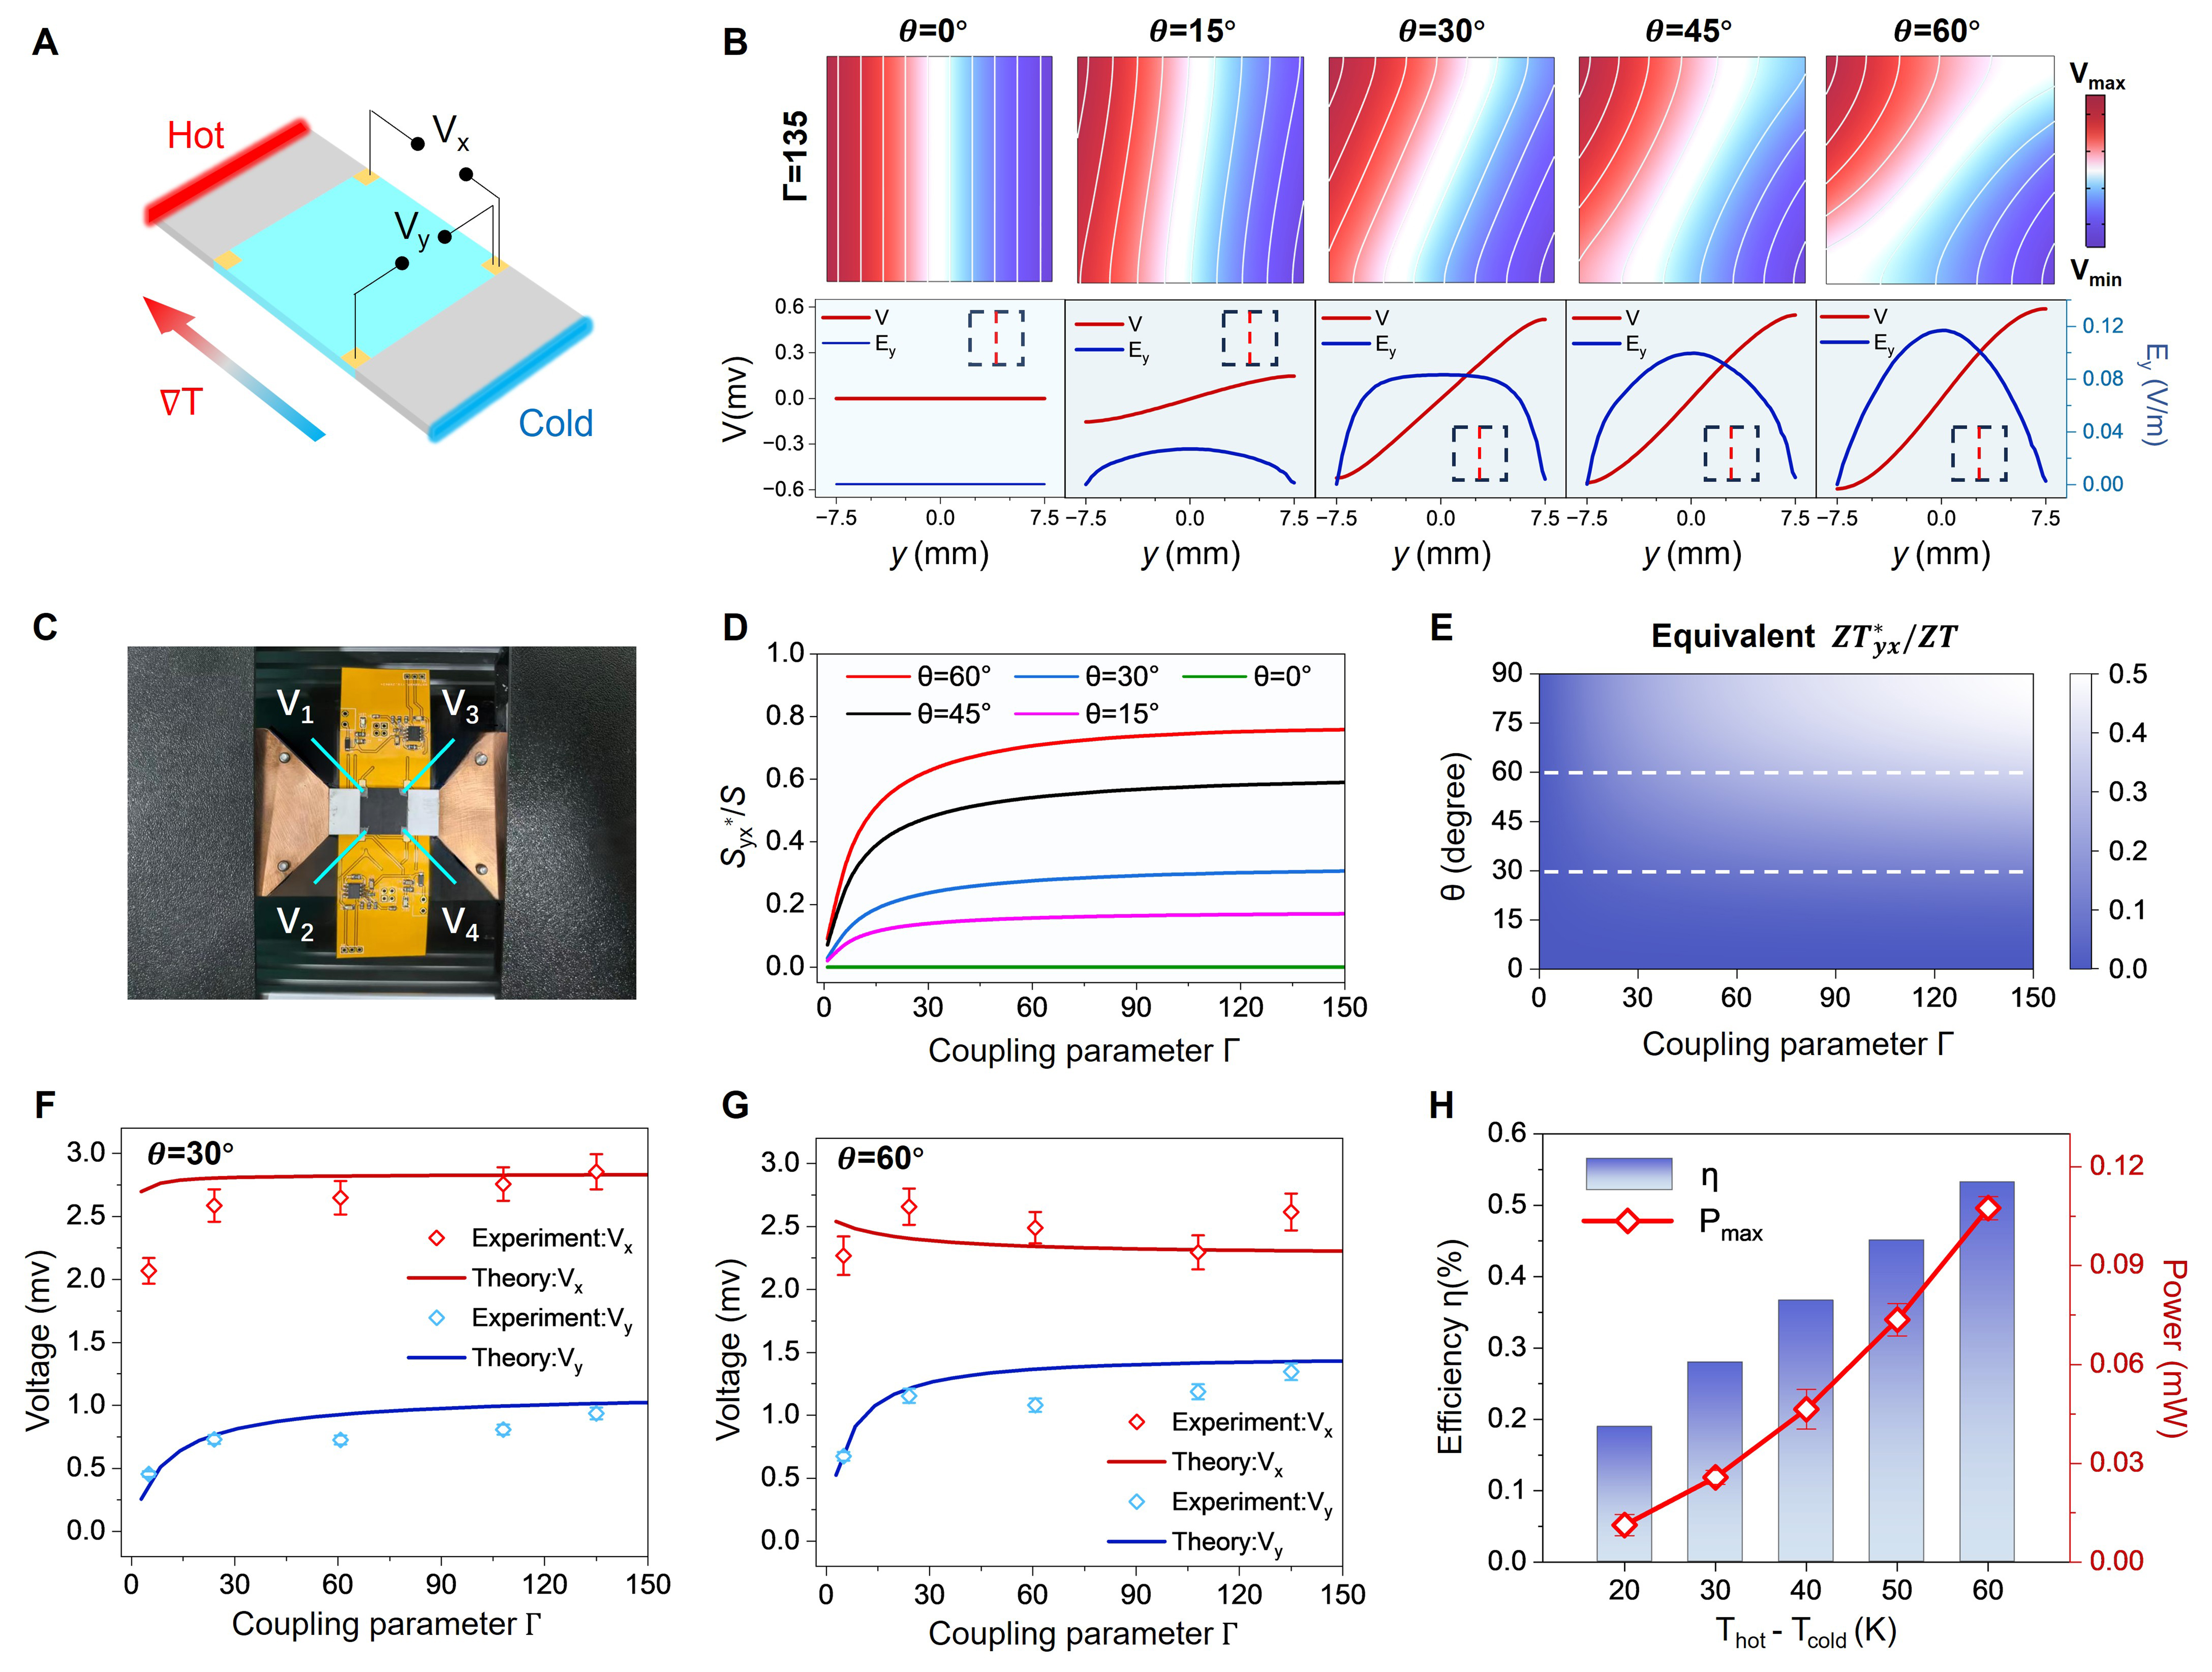
Figure 4. Transverse thermoelectric conversion driven by interlayer thermal coupling. (A) Schematic of the thermoelectric chip with four-probe electrode layout for oblique thermal coupling characterization; (B) Simulated electric potential contours (upper panels) and corresponding vertical-center-axis electric field profiles (lower panels). The red and blue lines denote the electric potential V and the transverse electric field Ey, respectively; (C) Optical photograph of the fabricated four-probe device mounted on the measurement stage; (D) Effective off-diagonal Seebeck coefficient induced by interlayer thermal coupling plotted against the coupling parameter Γ. The colored curves represent different lower-layer deflection angles: red: θ = 60°, black: θ = 45°, blue: θ = 30°, pink: θ = 15° and green: θ = 0°; (E) Calculated distribution of the transverse effective figure of merit ZTyx*/ZT. White dashed lines mark the representative deflection angles θ = 30° and θ = 60° adopted for experimental characterization; (F) Experimental open-circuit voltages and numerical predictions for longitudinal (Vx, red) and transverse (Vy, blue) configurations at θ = 30° under an applied temperature difference of 40 K. Error bars denote the SD of experimental replicates; (G) Corresponding experimental and theoretical voltages for θ = 60°; (H) Experimentally measured transverse thermoelectric conversion efficiency η (bar charts) and maximum output power Pmax (red line) as functions of the applied temperature difference. SD: Standard deviation.