




fig3
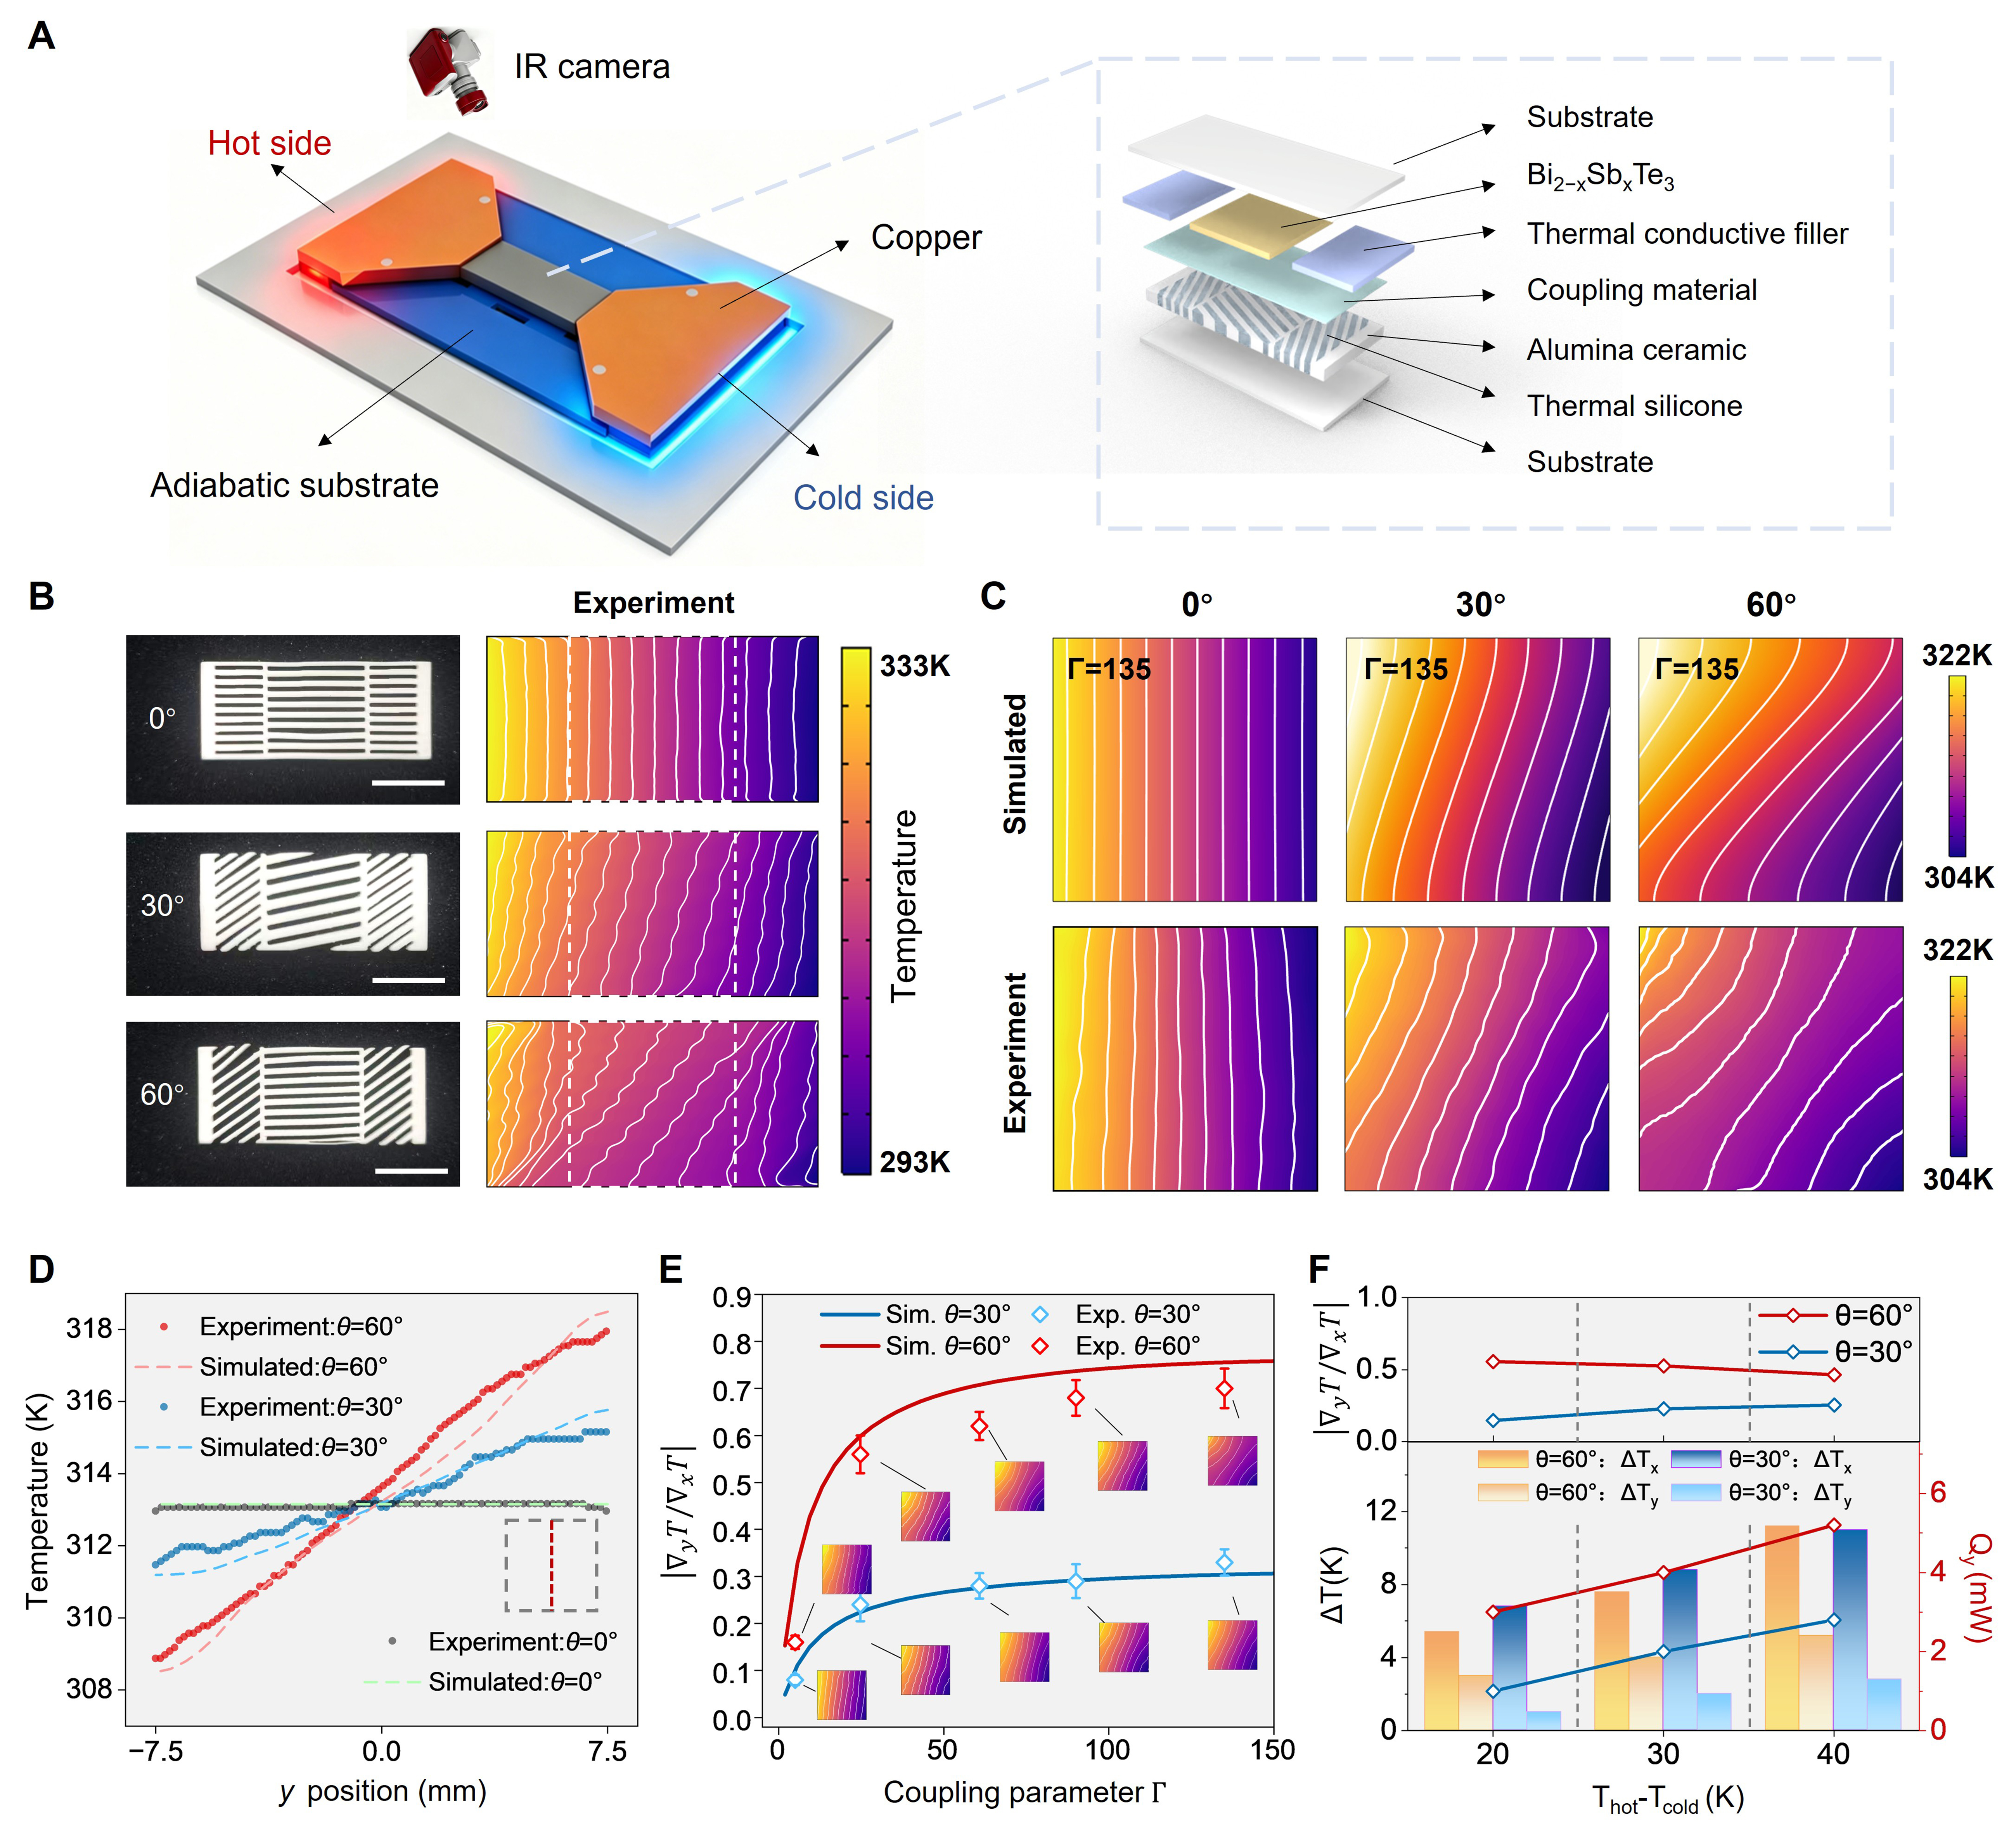
Figure 3. Experimental characterization of interlayer thermal coupling. (A) Schematic of the experimental setup. The inset presents an exploded-view illustration of the thermally coupled transverse TE chip; (B) Optical images of the thermal conductive layers with engineered deflection angles of 0°, 30°, and 60° (without thermal grease filling; scale bar, 10 mm) and the corresponding infrared thermal images showing the temperature fields; (C) Simulated (top) and experimental (bottom) temperature distributions of the thermoelectric layer at Γ = 135 for the three deflection angles (θ = 0°, 30°, and 60°); (D) Transverse temperature profiles along the y-axis of the upper layer for three different lower-layer deflection angles θ, comparing experimental data with simulation results. Red, blue, and black circles denote experimental data for θ = 60°, 30°, and 0°, respectively; dashed lines represent the corresponding simulated results; (E) The thermal deflection ratio |