


fig5
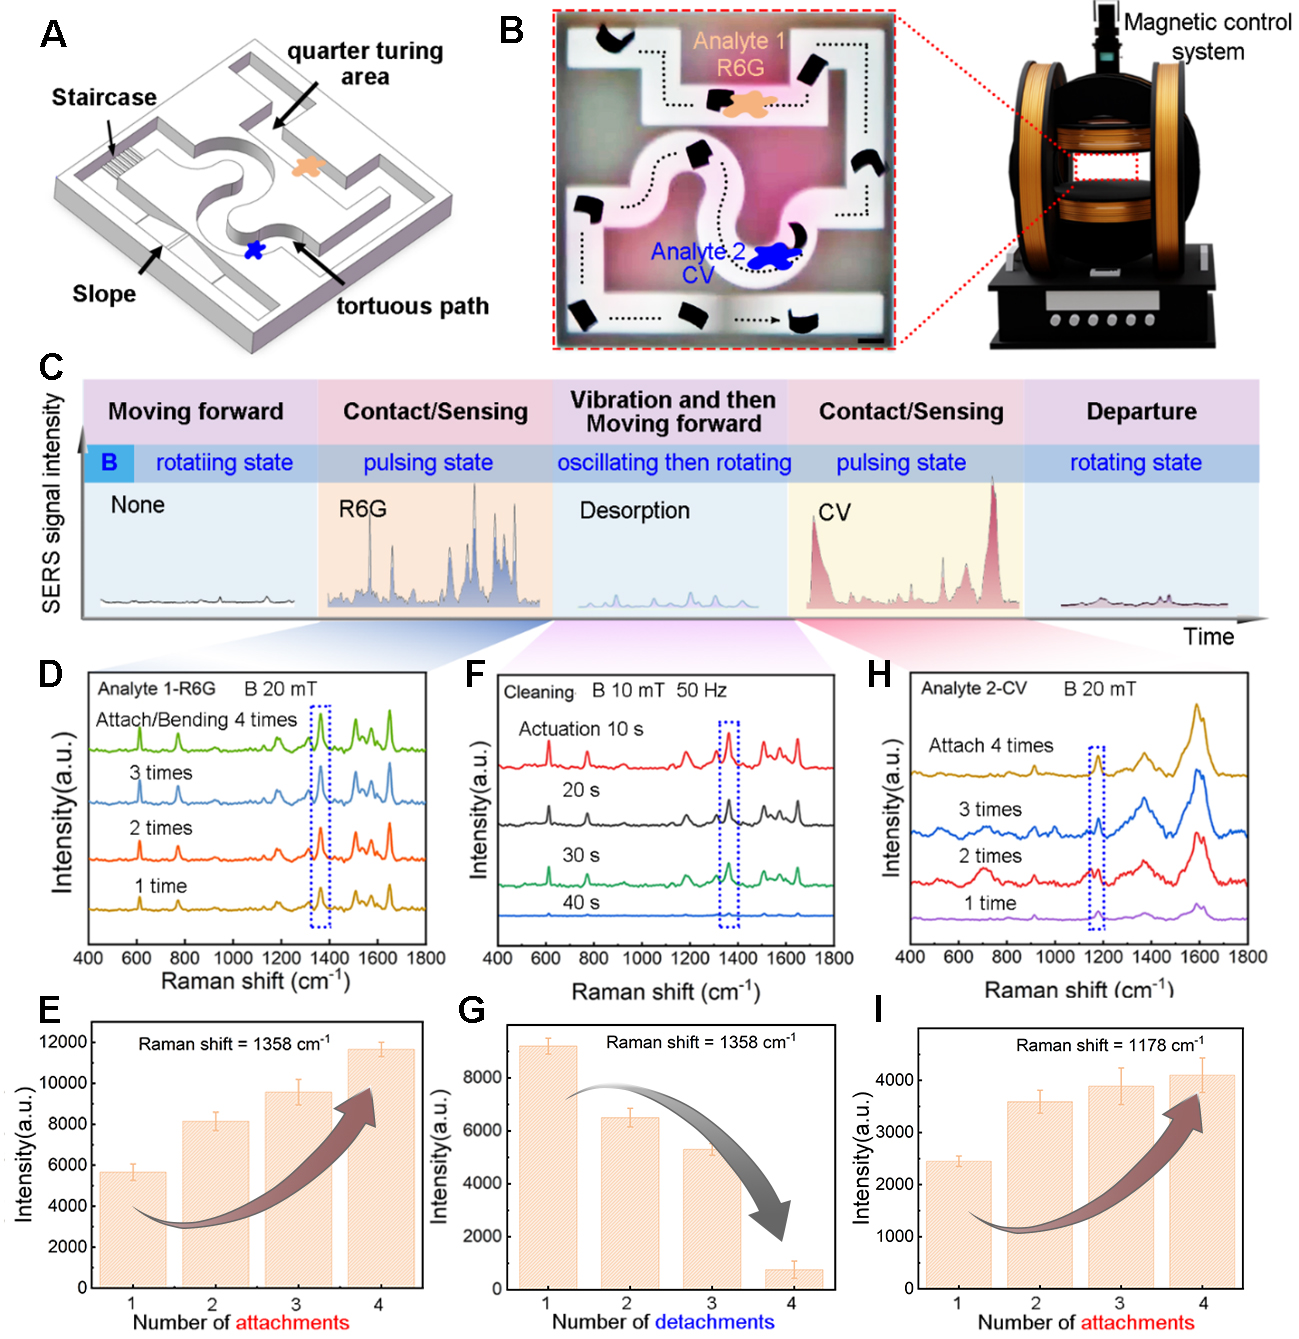
Figure 5. Magnetically enabled “hot-spots-on-the-fly” SERS sensing in a confined and heterogeneous environment. (A) Schematic illustration of a confined microenvironment with spatially separated analyte regions; (B) Demonstration of mobile and localized SERS sensing, scale bar 3mm; (C) Schematic of the actuation-sensing workflow of the MagSense-Bot; (D) SERS signal evolution of R6G and its intensity variation of the prominent peaks 1,358 cm-1 as a function of repeated deformation-assisted contact cycles (E); (F and G) Time-dependent desorption of R6G molecules under oscillating magnetic fields (50 Hz, 10 mT); (H and I) In situ SERS spectra acquired at the second sampling site, revealing characteristic CV peaks without residual R6G signatures. Error bars represent the standard deviation (SD) of three repeated spectral intensity measurements collected from the same sample. CV: Crystal violet; SERS: surface-enhanced Raman scattering.


