


fig3
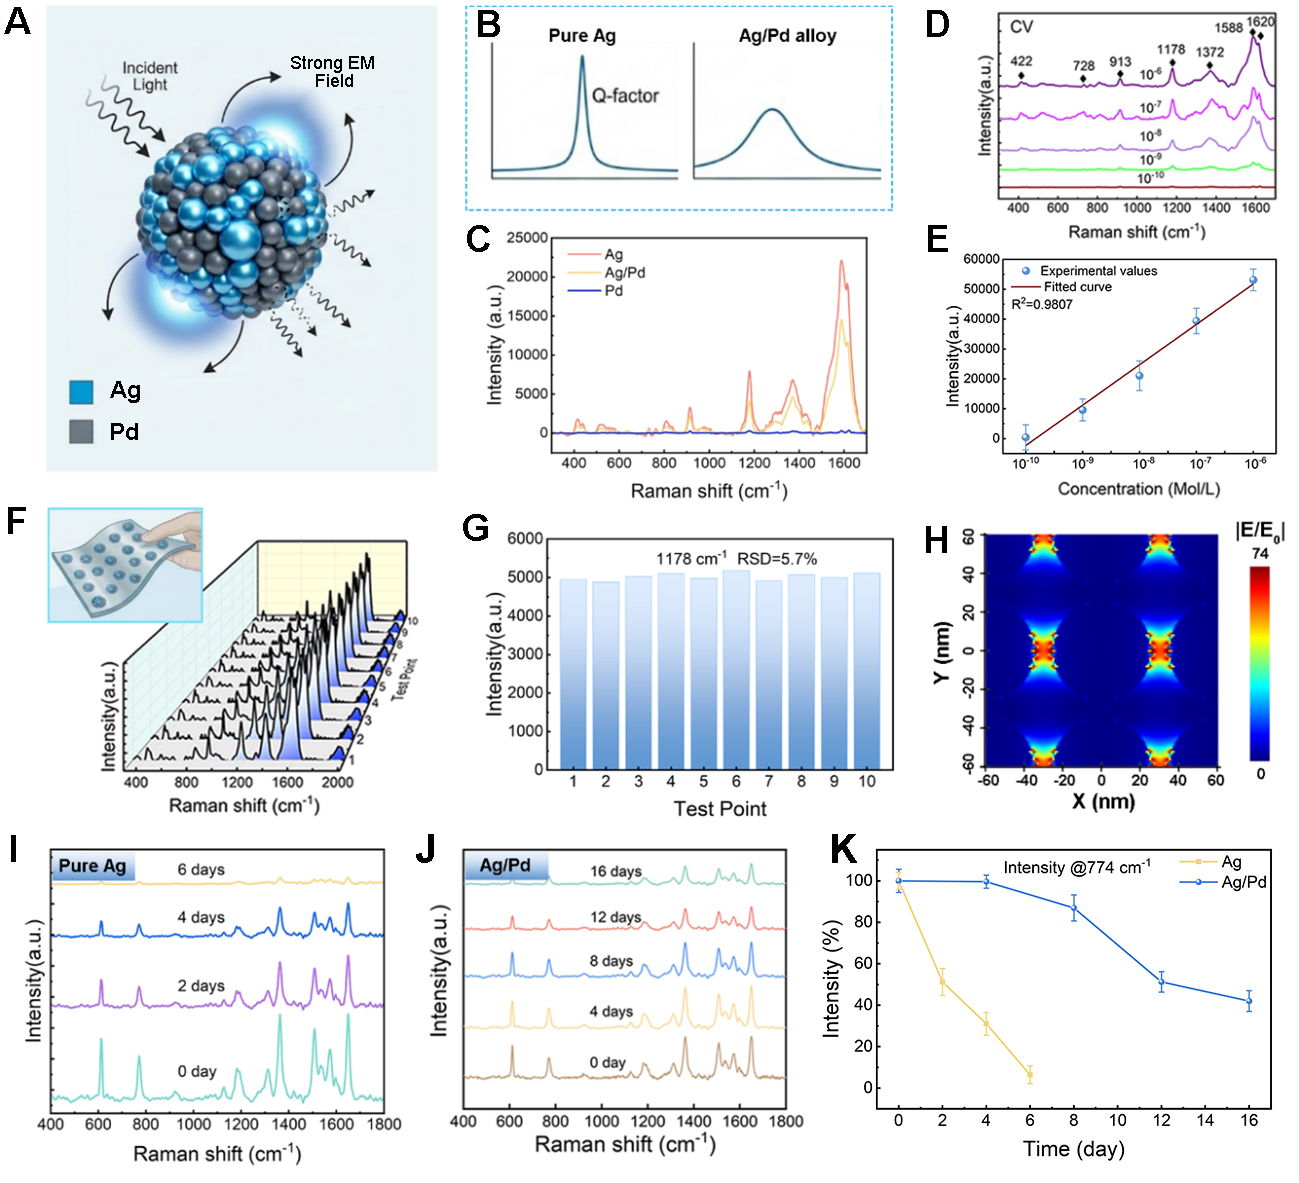
Figure 3. Plasmonic performance and chemical robustness of mobile Ag/Pd hot spots. (A) Schematic illustration of the SERS enhancement mechanism in Ag/Pd alloy nanostructures; (B) Conceptual illustration of plasmonic behavior in Ag/Pd alloys; (C) Comparison of SERS spectra acquired from pure Ag, Ag/Pd alloy, and pure Pd; (D) Representative SERS spectra of CV at different concentrations; (E) Corresponding calibration curve of Raman intensity at 1,178 cm-1 as a function of CV concentration; (F and G) Statistical analysis of SERS signal intensity from multiple locations on a single robot; (H) Local electric field distribution around Ag/Pd nanoparticles; (I) Time-dependent SERS signal evolution of pure Ag substrates; (J) Time-dependent SERS signal evolution of Ag/Pd alloy substrates; (K) Comparison of normalized SERS intensity decay at 774 cm-1 for pure Ag and Ag/Pd alloy substrates.Error bars represent the standard deviation (SD) of three repeated spectral intensity measurements collected from the same sample. EM: Electromagnetic; CV: crystal violet; RSD: relative standard deviation; SERS: surface-enhanced Raman scattering.


