


fig7
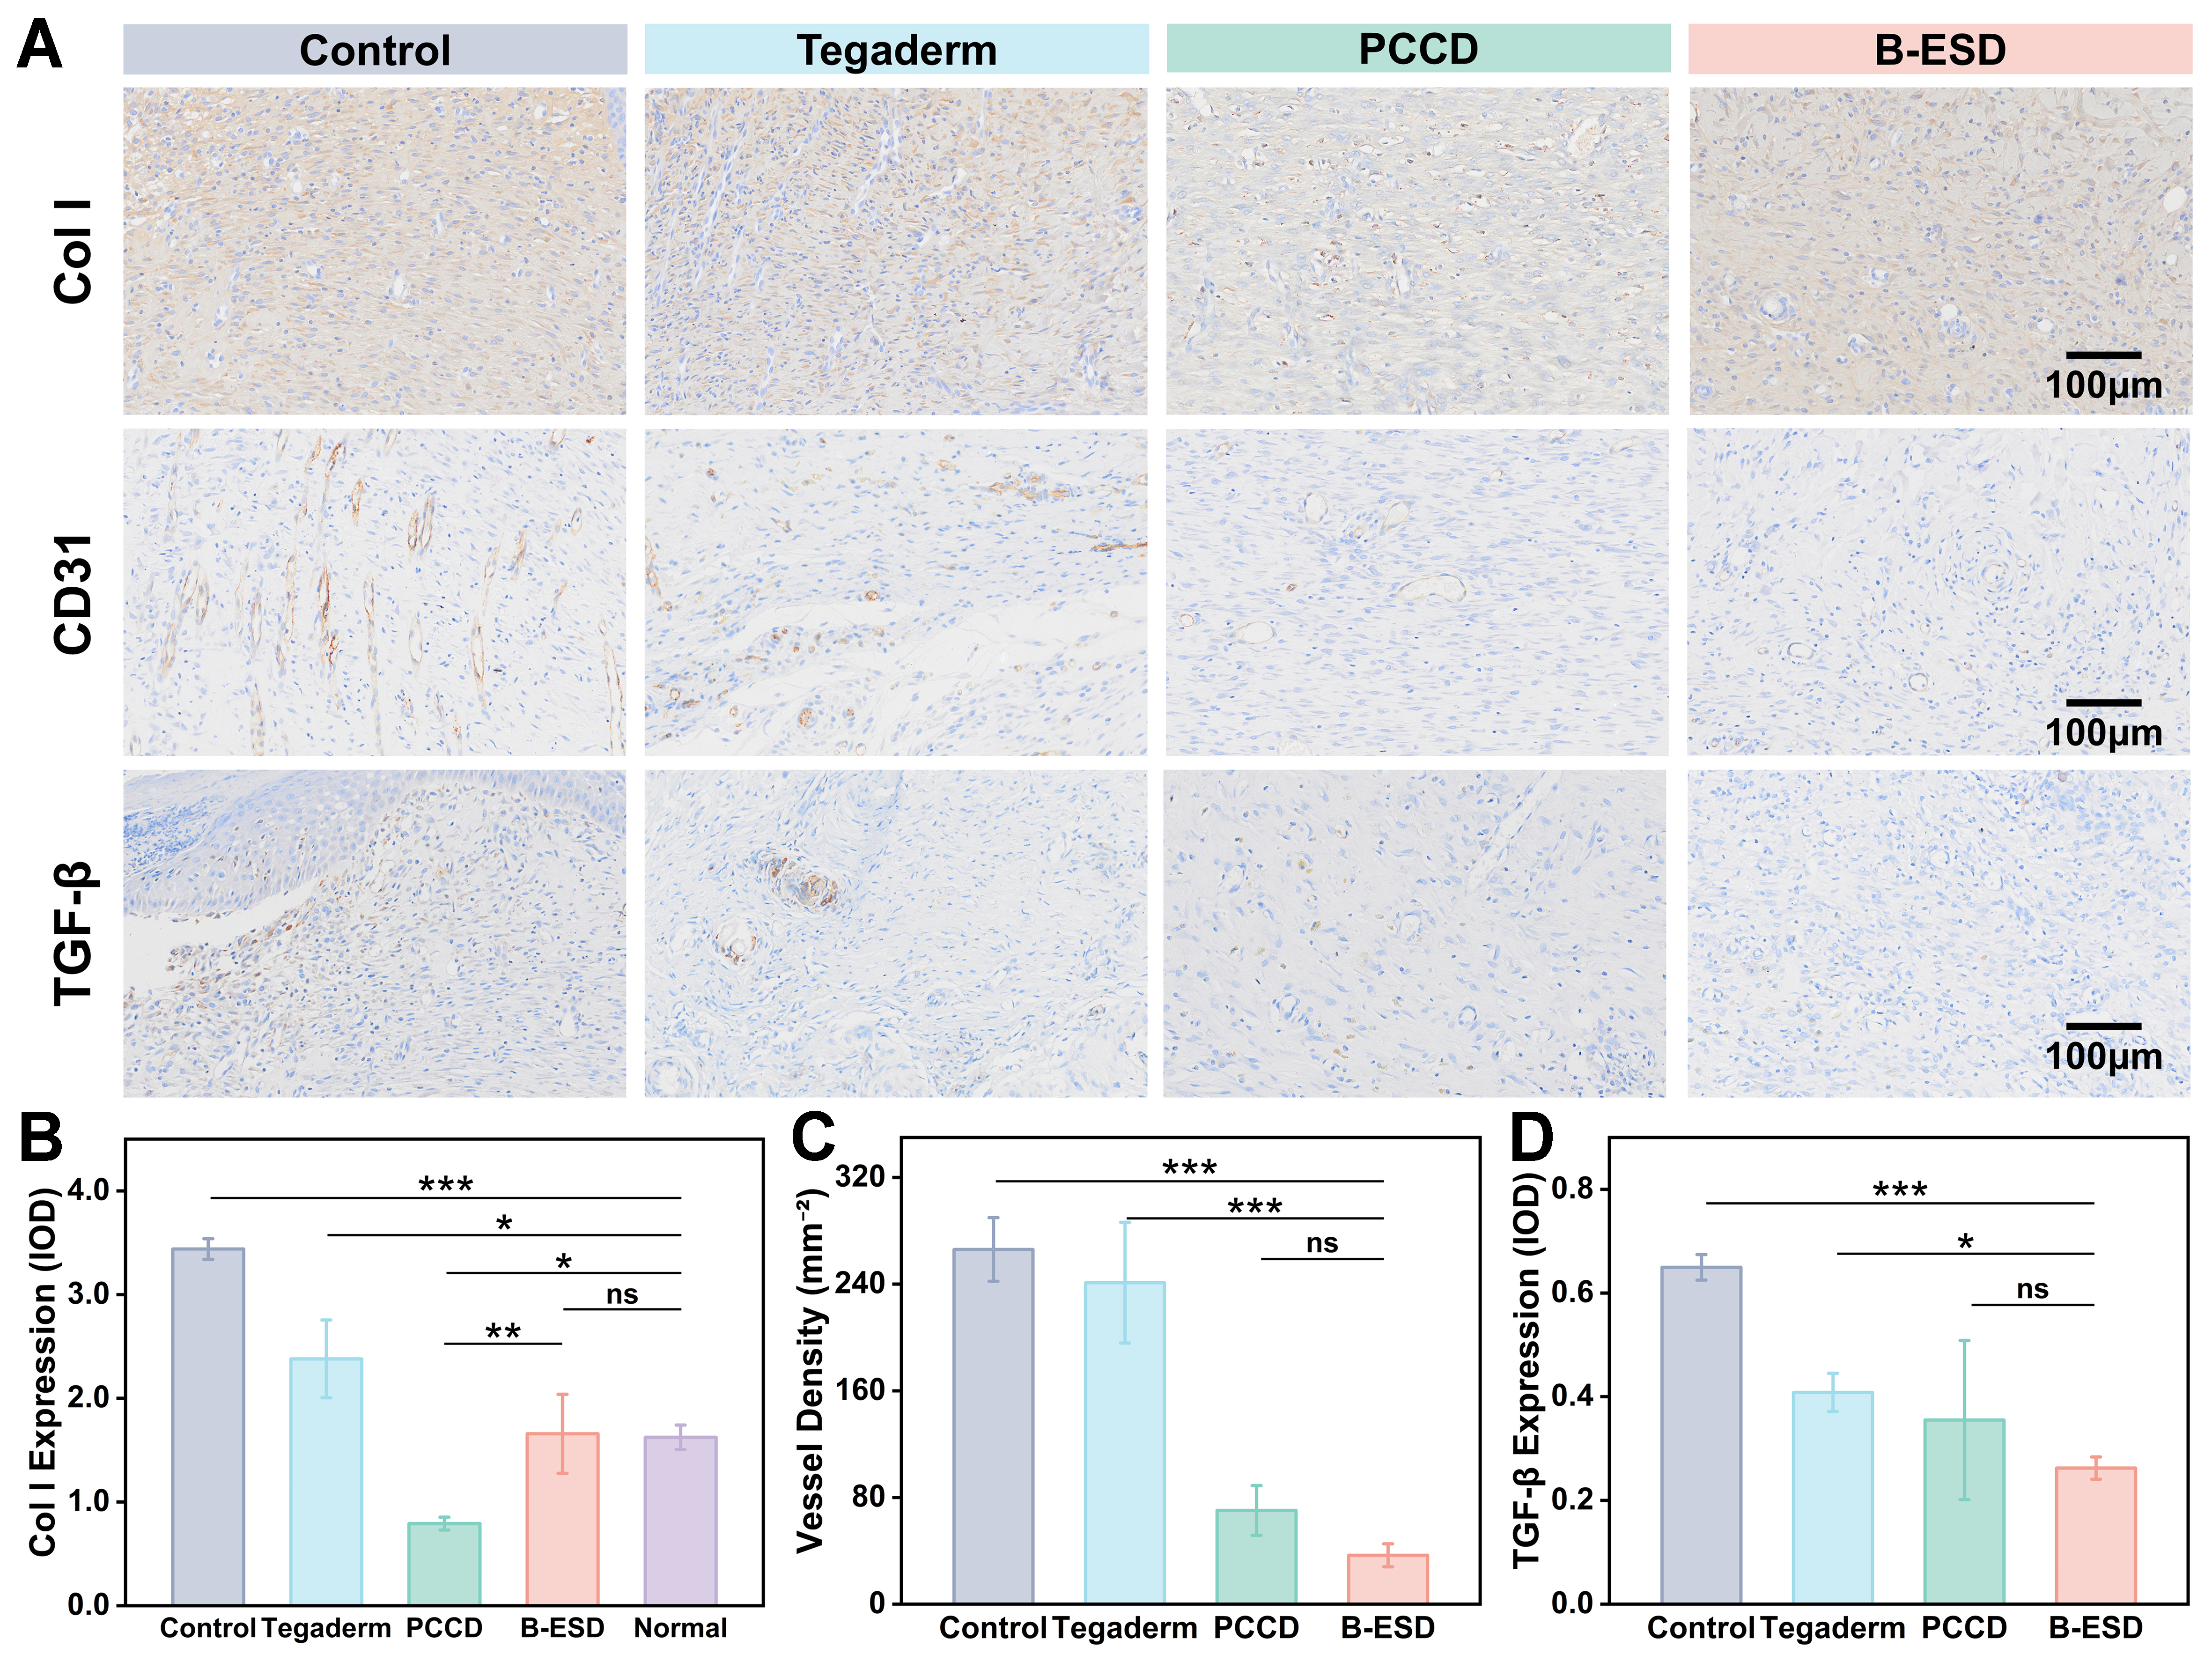
Figure 7. IHC analysis of ECM remodeling and angiogenesis. (A) Representative IHC images of Col I, CD31, and TGF-β1 expression in wound sections on day 14; (B and D) Semi-quantitative analysis (IOD) of Col I expression and TGF-β1 expression levels across different groups; (C) Quantitative analysis of angiogenesis expressed as vessel density (number of CD31-positive vessels per mm2). Data are expressed as mean ± standard deviation (n = 5, *P < 0.05, **P < 0.01, ***P < 0.001, ns: not significant). IHC: Immunohistochemistry; ECM: extracellular matrix; Col I: Type I collagen; TGF-β1: transforming growth factor-beta 1; IOD: integrated optical density; PCCD: polyacrylamide/sodium carboxymethyl cellulose/calcium chloride/dopamine; B-ESD: bilayer electrogenerative smart dressing.





