




fig6
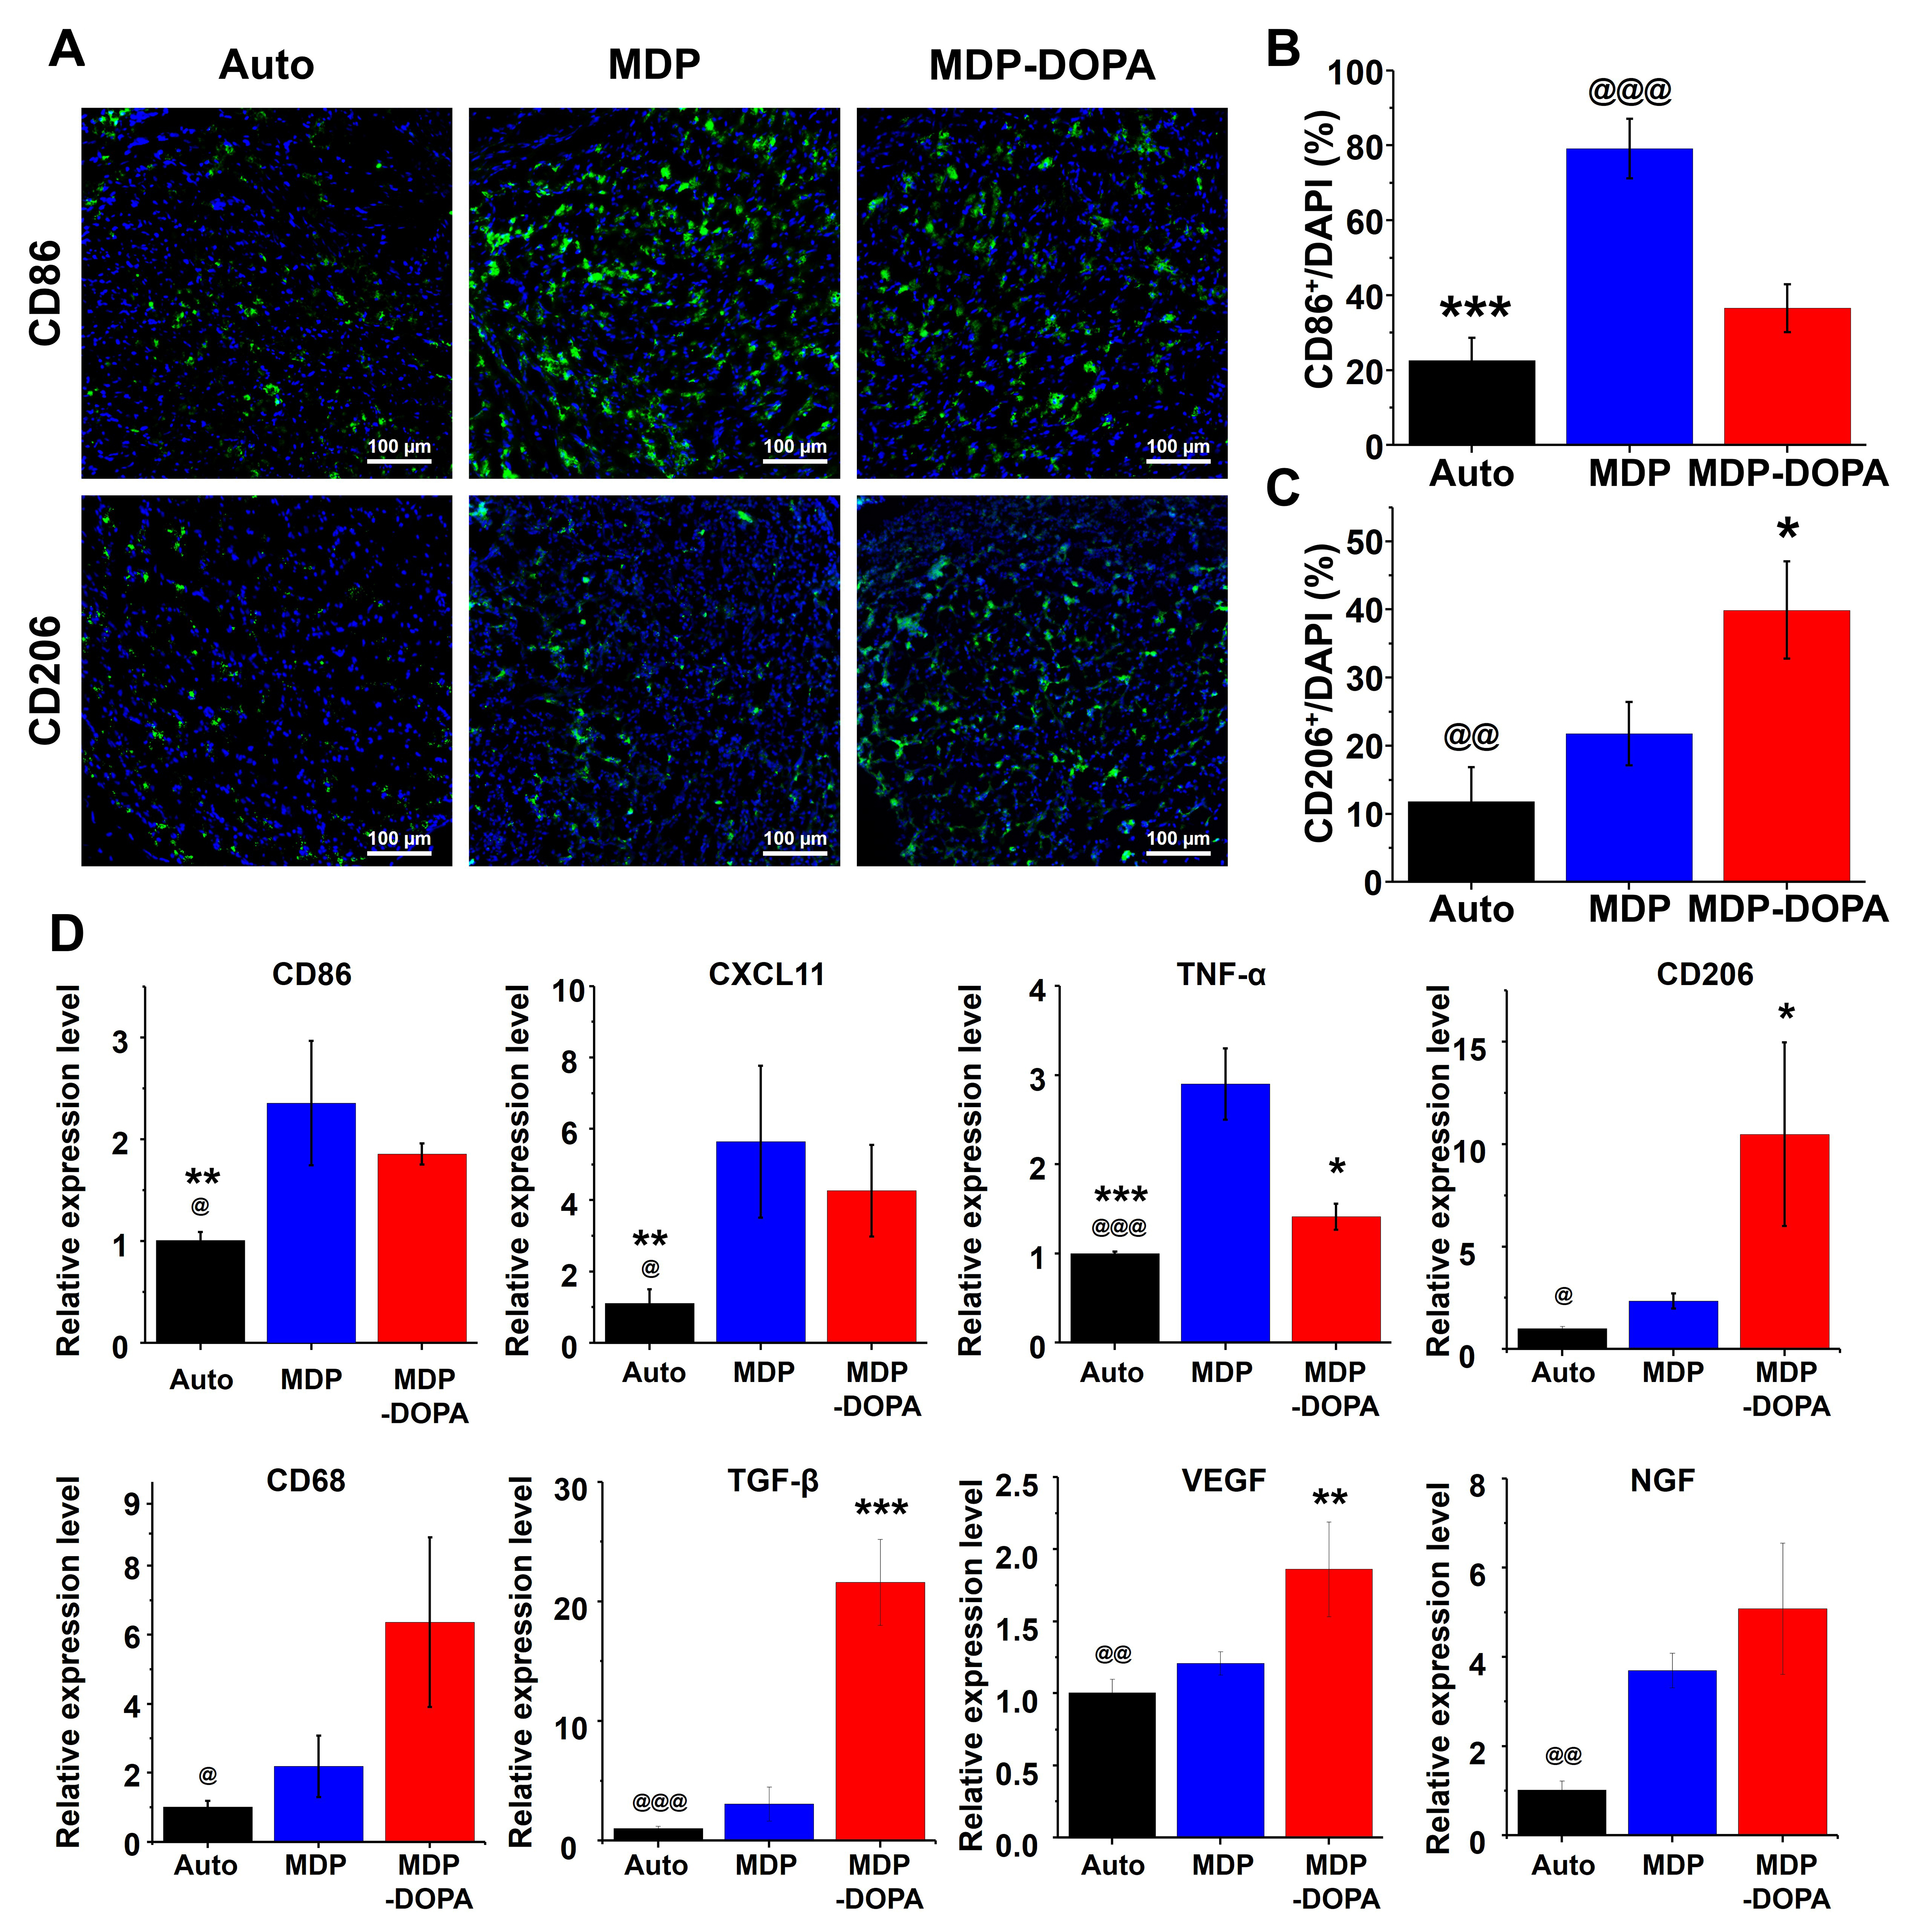
Figure 6. (A) Immunohistochemical staining of CD86 and CD206 at an early time point (scale bar = 100 μm); Quantification of positive expression of (B) CD86 and (C) CD206 (*P < 0.05 and ***P < 0.001 vs. MDP, @@P < 0.01 and @@@P < 0.001 vs. MDP-DOPA); (D) qRT-PCR evaluation of transcript levels for genes involved in inflammatory responses, macrophage polarization, and tissue repair calibrated against the autograft group (*P < 0.05, **P < 0.01, and ***P < 0.001 vs. MDP, @P < 0.05, @@P < 0.01, and @@@P < 0.001 vs. MDP-DOPA). Values represent mean ± SD from quadruplicate biological experiments. MDP: Milk-derived protein; DOPA: dihydroxyphenylalanine; qRT-PCR: quantitative reverse transcription polymerase chain reaction; SD: standard deviation; DAPI: 4′,6-diamidino-2-phenylindole.





