


fig6
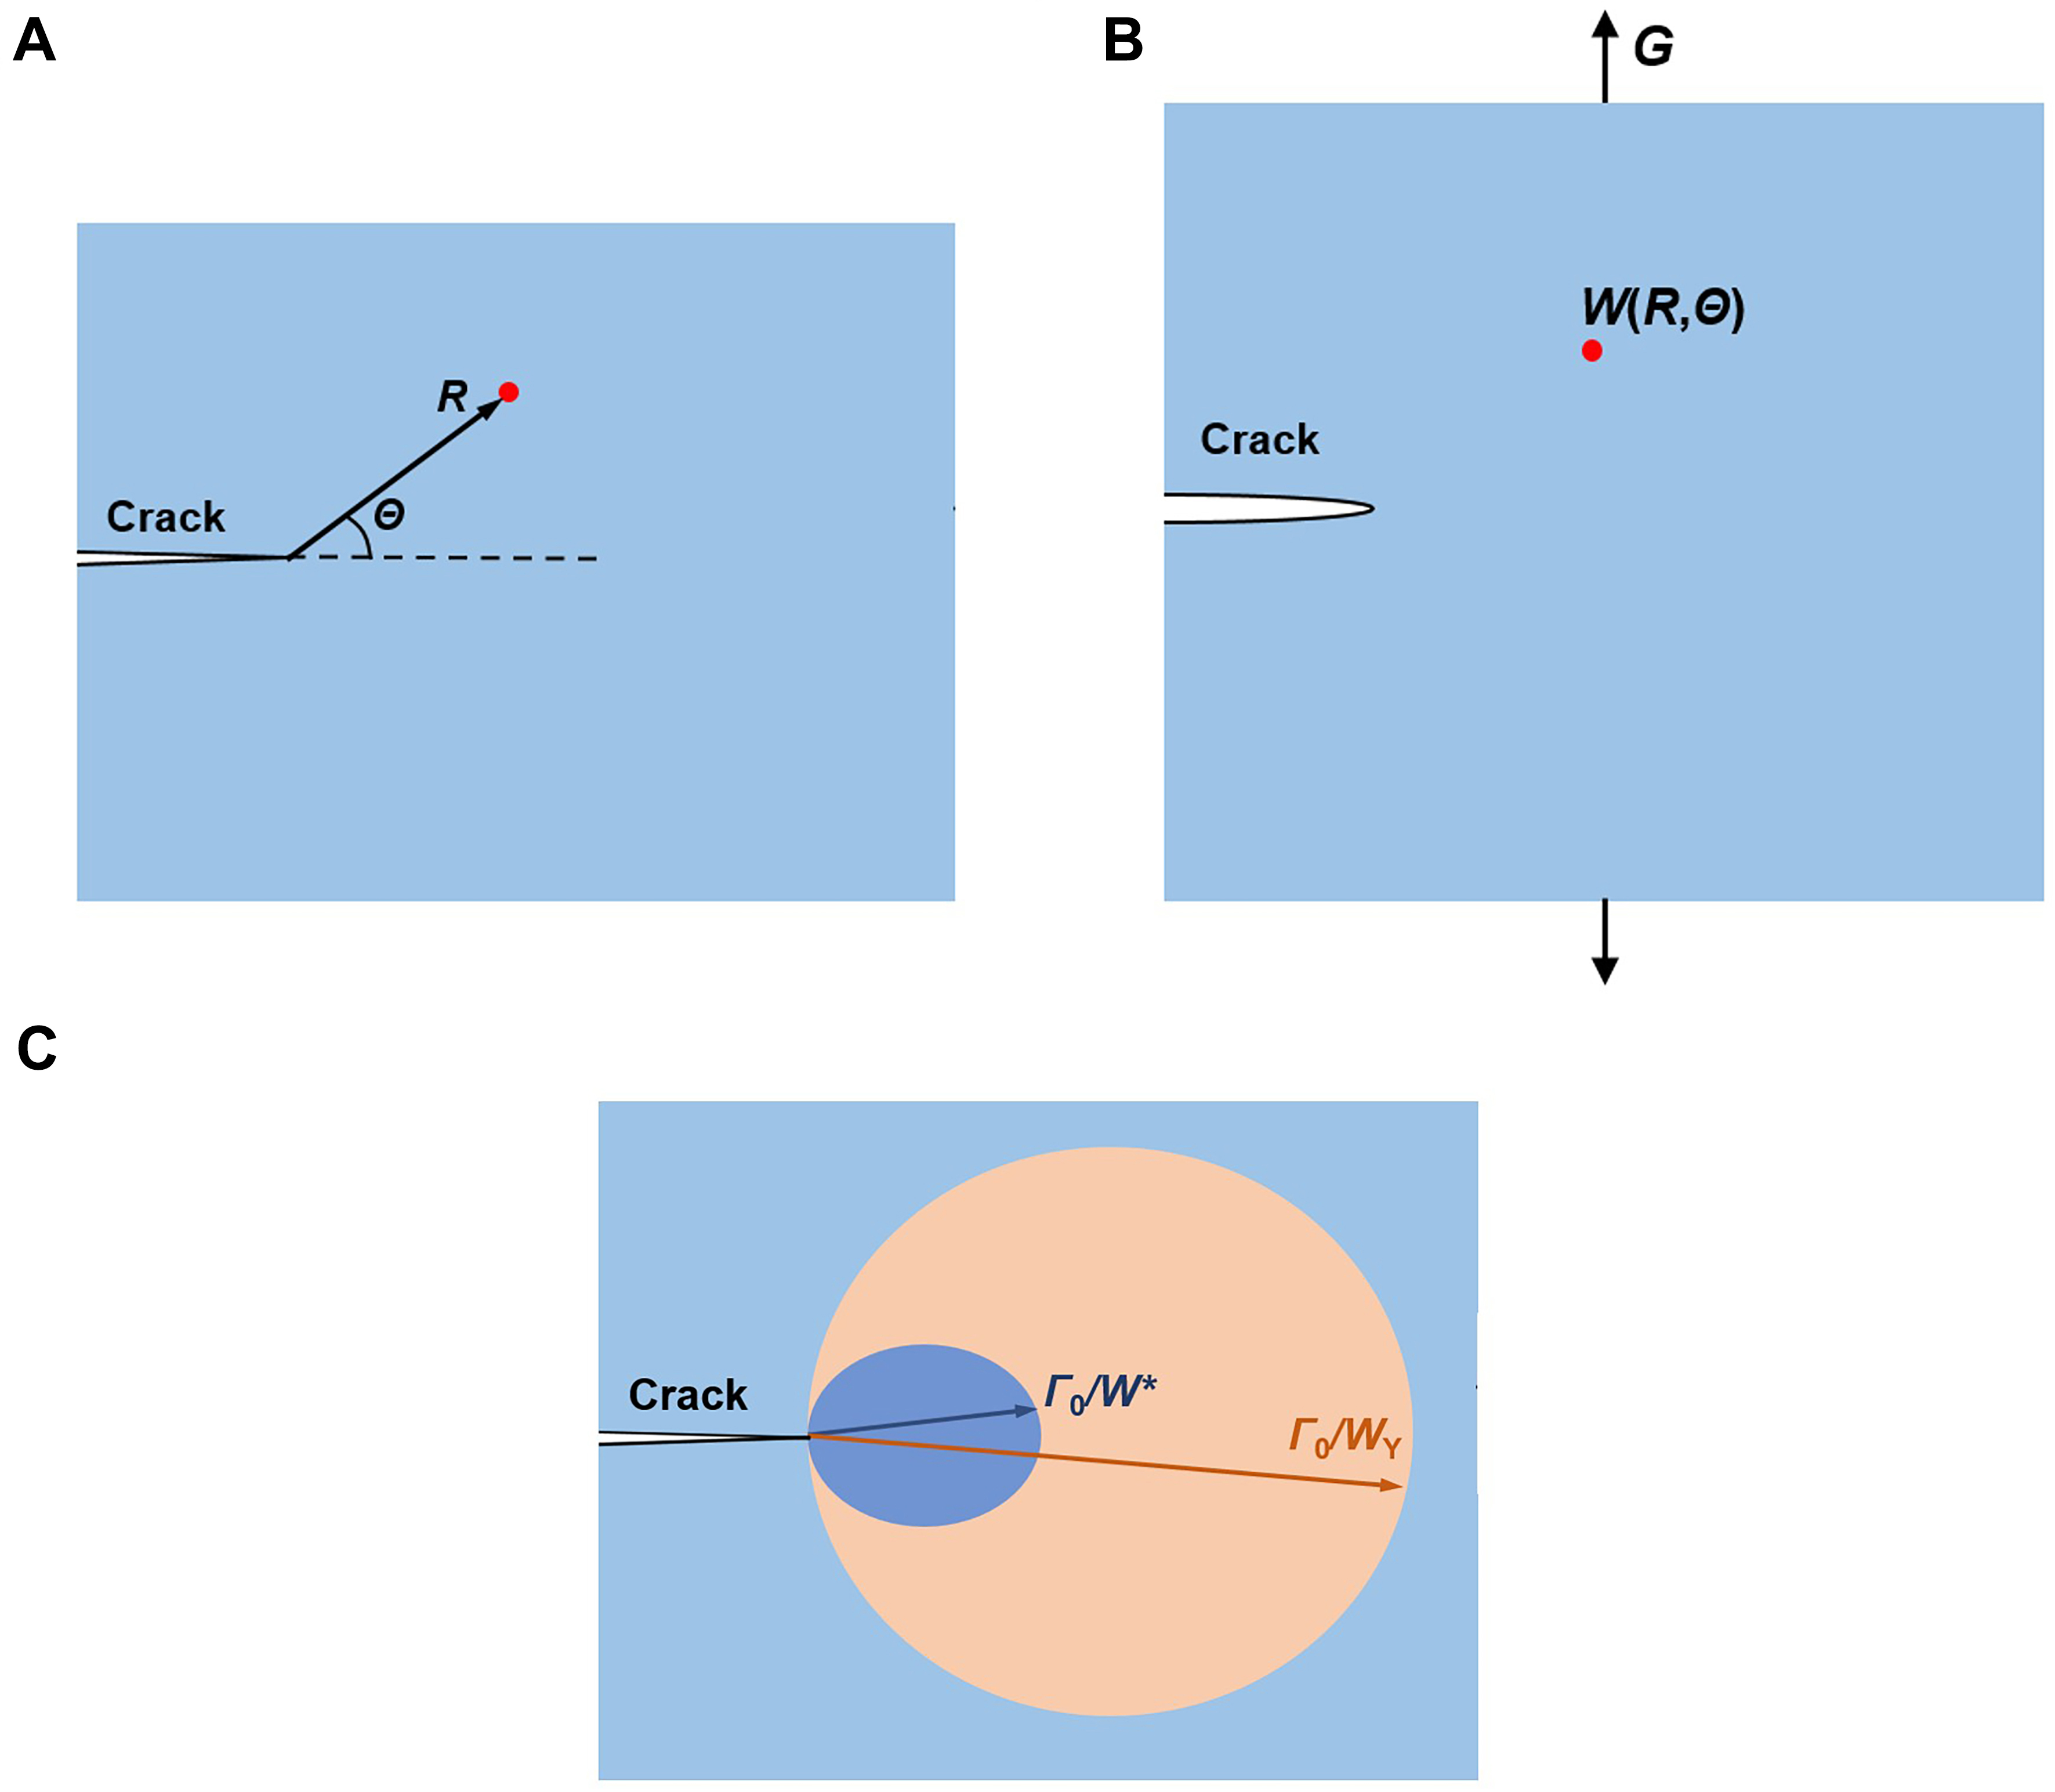
Figure 6. Comparison between the scale of fractocohesive length and the scale of inelastic zone. (A) In the undeformed state, a material particle is labeled by polar coordinates (R, Θ) centered at the tip of the crack; (B) In the deformed state, the applied load is represented by the energy release rate G. The field of energy density is a function W (R, Θ). For a given material point, its distance R from the crack tip is the only length scale. The field of energy density W scales with the energy release rate G as W ~ G/R (light blue region); (C) The comparison between the fractocohesive length (dark blue region) and the scale of inelastic zone (orange region).


