




Machine-learning optimization of microstructure and mechanical properties in 3D-printed W-alloyed refractory high-entropy alloys
 0
Abstract
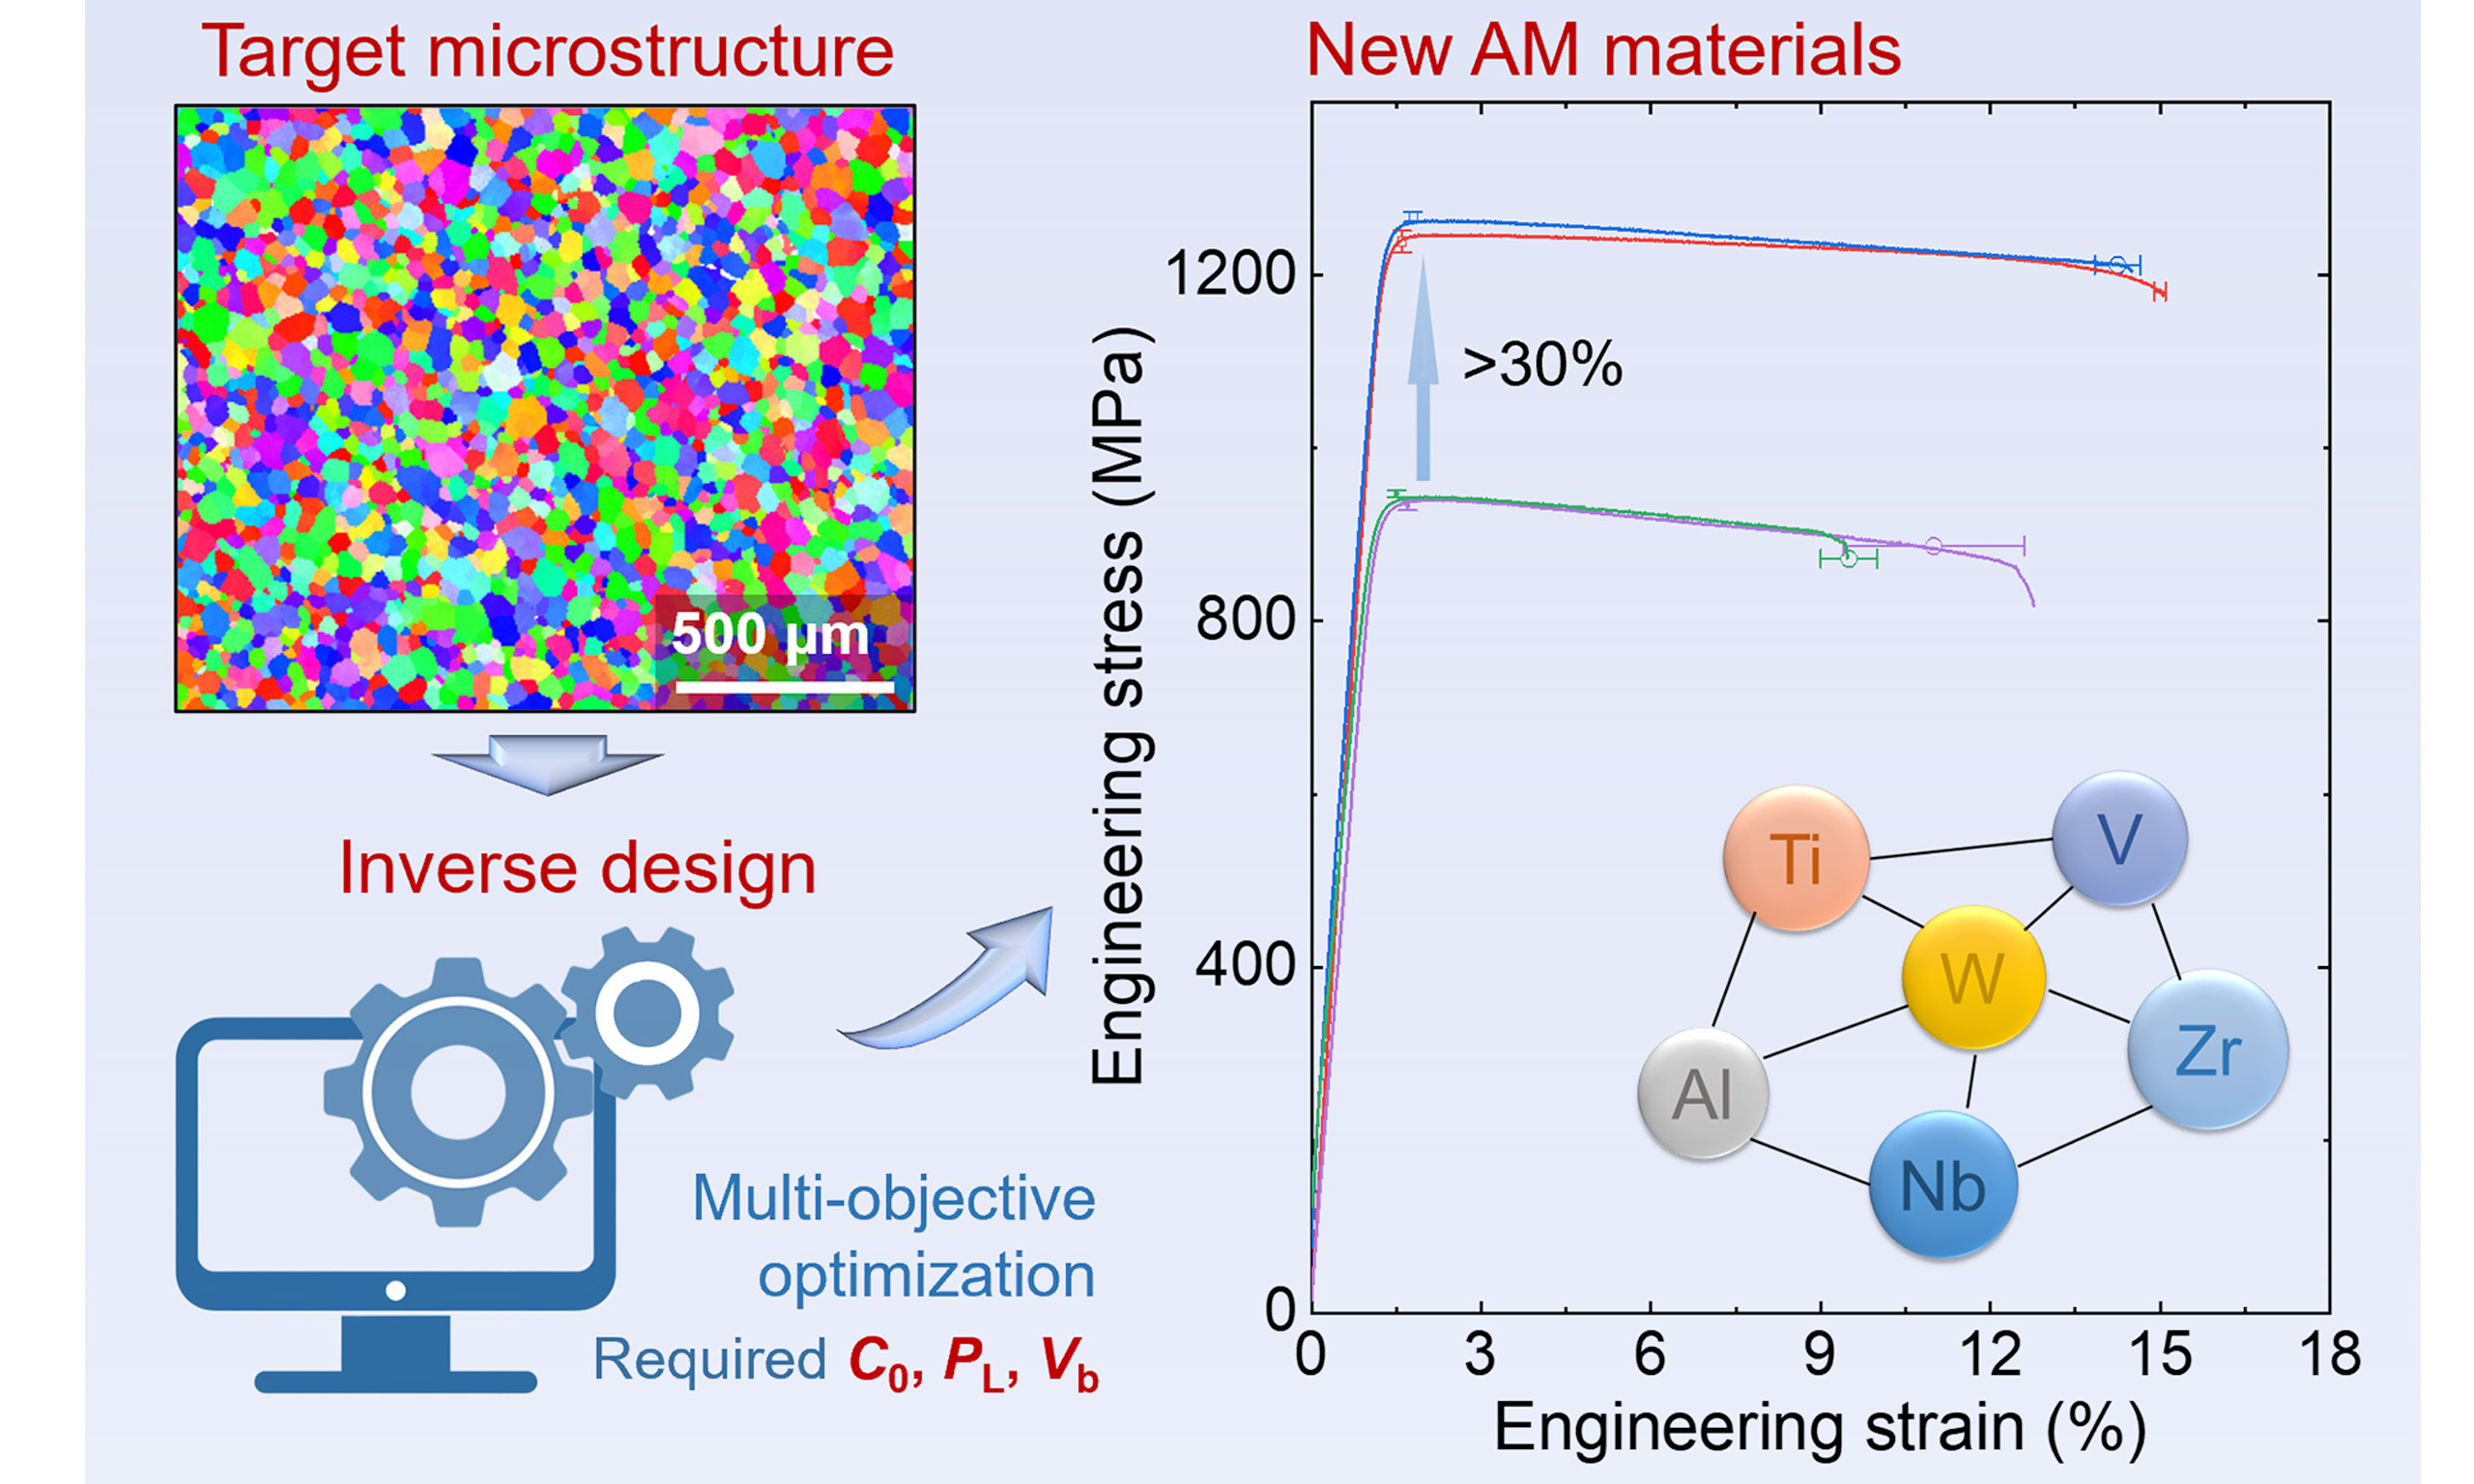
Preparation of fine-grain, low-microsegregation Ti-rich refractory high-entropy alloys (RHEAs) remains challenging for conventional techniques. Additive manufacturing (AM)/3D printing can weaken the microsegregation but its strong directional heat flux is unfavorable to formation of fine equiaxed grains. Refining grains by alloying requires a lot of experiments to match appropriate AM parameters to these newly designed alloys, resulting in high cost and being time-consuming. Here, W was selected as a grain-refining element for a Ti-rich RHEA, and a solidification theory-guided machine-learning framework was developed to concurrently optimize W content and AM parameters. By integrating velocity-dependent solidification and heat-transfer calculations, the framework identified an optimized alloy, (Ti3.6Zr1.2V0.8NbAl0.3)93.7W6.3, with AM parameters of 1,556 W and
Keywords
INTRODUCTION
Refractory high-entropy alloys (RHEAs) consisting of high-melting-point elements from Groups IV, V, and VI, such as Ti, Zr, V, Nb, Mo, and W, have attracted considerable attention[1-4]. Among them, non-equiatomic Ti-rich RHEAs with a single-phase body-centered cubic (BCC)structure, such as Ti3.6Zr1.2V0.8NbAl0.3, exhibit attractive mechanical properties[5-8]. However, these alloys generally contain coarse grains with characteristic sizes of hundreds of micrometers, resulting in localized deformation within a limited number of grains with high Schmid factors[8]. Such coarse-grained structures are difficult to refine through conventional processing because of the poor cold- and hot-workability of RHEAs and their rapid grain coarsening at elevated temperatures[9,10].
Alloying is an effective approach for grain refinement. Elements that increase the solidification interval ΔT0, constitutional supercooling parameter P, and growth restriction factor Q are favorable for the formation of fine equiaxed grains by promoting the columnar-to-equiaxed transition (CET) during solidification[11,12]. However, such elements can also significantly increase microsegregation in Ti-rich alloys because their partition coefficients k deviate substantially from unity. As listed in Table 1, the k values of Al, V, and Zr in Ti are close to unity, resulting in P and Q values close to zero. In contrast, Nb, Mo, and especially W exhibit much higher k values and consequently higher P and Q values. Such microsegregation becomes more severe in Ti-rich RHEAs because of their high degree of alloying[13,14]. Owing to its strong segregation tendency and high melting point, W is generally added only in limited amounts and is rarely considered as a major alloying element in conventional Ti-based alloys[12].
| Element | m (K/wt%) | k | P (K) a | Q (K) a | GS (GPa) |
| Ti | / | / | / | / | 45 |
| Al | -2.1 | → 1 | → 0 C0 | → 0 C0 | 24.5 |
| V | -4.7 | → 1 | → 0 C0 | → 0 C0 | 46.7 |
| Zr | -2.3 | → 1 | → 0 C0 | → 0 C0 | 35 |
| Nb | 10 | 1.25 | 2 C0 | 2.5 C0 | 37.5 |
| Mo | 8.9 | 1.5 | 2.96 C0 | 4.5 C0 | 126 |
| W | 15.1 | 2.5 | 9.06 C0 | 22.65 C0 | 161 |
Laser metal deposition (LMD), a metal additive manufacturing (AM) technique based on coaxial powder feeding, provides an effective route for fabricating difficult-to-form refractory alloys with reduced microsegregation[15-19]. It has therefore attracted increasing attention for the fabrication of high-performance Ti-rich RHEAs[20-22]. For example, LMD-fabricated Ti3Zr1.5VNbAl0.25 exhibits reduced microsegregation and consequently a favorable strength-ductility combination compared with its as-cast counterpart[23]. This advantage enables the use of alloying elements with strong solute partitioning when a fine-grained microstructure is desired. Among these elements, W is particularly favorable for promoting the formation of fine equiaxed grains. Furthermore, W is an effective solid-solution strengthener in Ti-based alloys and Ti-rich RHEAs because of its high shear modulus GS[14,24-26]. As shown in Table 1[29], W exhibits the highest P and Q values among the considered elements, further supporting its strong grain-refinement potential. Therefore, W alloying is particularly attractive for simultaneously promoting grain refinement and strengthening in Ti-rich RHEAs fabricated by LMD and other metal AM techniques[12].
However, owing to the strong directional heat flow during LMD, Ti-rich RHEAs commonly exhibit textured microstructures along the building direction, such as columnar grains or heterogeneous structures consisting of alternating columnar and equiaxed regions[21,23,30]. When a fine-grained microstructure is desired, processing parameters and alloy composition need to be considered concurrently[31]. For a given composition, processing-microstructure maps provide an effective means of selecting suitable processing parameters[32-34]. However, when the alloy composition is also variable, a large number of such maps would be required for coordinated composition-process optimization. Moreover, constructing these processing-microstructure maps is time-consuming, and the associated computational and experimental costs increase substantially when finite-element simulations and/or experiments are required to determine the solidification conditions and microstructures[32,33]. Consequently, the conventional development of new alloys is often costly, time-consuming, and labor-intensive, and may even require several decades.
Machine learning (ML) is a powerful tool for coordinated multi-objective optimization[35-37]. In recent years, data-driven ML has attracted increasing attention in AM because of its great potential in quality control, process optimization, structural design, property prediction, and accelerated development of AM-specific materials[38-40]. However, existing studies have mainly focused on either composition design or processing/quality control[41-43]. In fact, the microstructure and mechanical properties of AM alloys are jointly determined by composition and processing. A composition showing undesirable properties under one processing condition should not necessarily be excluded, because its properties may be significantly improved by adjusting the processing parameters. Therefore, coordinated optimization of composition and processing can reduce the risk of overlooking promising alloy compositions.
This work introduces W into a Ti-rich RHEA, Ti3.6Zr1.2V0.8NbAl0.3[8] (hereafter referred to as T50), to promote grain refinement, while LMD is employed to alleviate the accompanying segregation. For the development of a new AM alloy with targeted microstructural characteristics, processing parameters are as important as alloy composition and should therefore be considered simultaneously. Accordingly, a solidification theory-guided ML framework is proposed to rapidly optimize the W content and LMD parameters using multi-objective evolutionary algorithms coupled with new decision-making strategies. The inverse-designed alloy is subsequently fabricated by LMD, and its microstructure and mechanical properties are characterized to validate the ML design. For comparison, the W-free T50 alloy is fabricated using the same LMD parameters as the inverse-designed alloy. The strengthening mechanisms and deformation behaviors of the two alloys are further compared and discussed.
MATERIALS AND METHODS
Materials preparation
To validate the solidification-guided ML framework, both the ML-based inverse-designed alloy and T50 were fabricated using the same LMD parameters given by the ML model, and using a 4 kW LMD system RC-LDM4030 (RAYCHAM Laser Technology Group Co., Ltd., China) equipped with a coaxial powder delivery system in an Ar-purged processing chamber with an oxygen content less than 50 ppm. The LMD wall-like samples with a size of about 6 × 43 × 40 mm3 were prepared using a laser beam diameter of 2.5 mm, a layer thickness of 0.3 mm, and a powder feeding rate of 0.7 rpm. The original spherical powder (particle size 53-150 μm) used for LMD was produced by the plasma rotating electrode process provided by Shenzhen Fengwang New Materials Technology Co., Ltd.
Mechanical testing
Flat dog-bone-shaped tensile specimens with gauge dimensions of 8 mm × 2 mm × 1 mm were machined by electrical discharge machining along the longitudinal direction (L direction, parallel to the building direction) and the transverse direction (T direction, parallel to the laser scanning direction). Before tensile testing, the specimen surfaces were polished using 2000-grit SiC paper. Room-temperature tensile tests were performed using a 10 kN AGS-X universal testing machine (Shimadzu Corporation, Japan) equipped with a laser extensometer at a nominal strain rate of 10-3 s-1. At least three specimens were tested for each condition to ensure repeatability. The reported tensile properties are expressed as the mean values, and the error bars represent standard deviations.
For digital image correlation (DIC) analysis, a random speckle pattern was applied to the surface of the tensile specimens before testing. The deformation process was recorded using a VIC-Snap 9 DIC image acquisition system (Correlated Solutions, Inc., USA) at an acquisition rate of 1 Hz. The strain maps were calculated based on the recorded DIC images.
Microstructural characterization
The microstructures and fracture morphologies of the tensile specimens were characterized using an Axio Observer A1m inverted optical microscope (OM, Carl Zeiss Microscopy GmbH, Germany) and an Apreo C field-emission scanning electron microscope (SEM, Thermo Fisher Scientific, USA). The SEM was equipped with an electron backscatter diffraction (EBSD) detector (Oxford Instruments, UK). Back-scattered electron (BSE) imaging was used for microstructural observation, while secondary electron (SE) imaging was used for fracture-surface characterization. The metallographic specimens were first ground using 2000-grit SiC paper, mechanically polished using diamond suspensions with average particle sizes of 2.5 and 0.5 μm, and finally polished using an oxide polishing suspension. The OM specimens were etched using a mixed solution of hydrofluoric acid (HF), HNO3 and H2O with a volume ratio of 1:3:60. For EBSD and kernel average misorientation (KAM) analyses, an acceleration voltage of 20 kV and a step size of 5 μm were used. The EBSD data were analyzed using AZtecCrystal software (Oxford Instruments, UK). Elemental distribution was measured using a JXA-8230 electron probe microanalyzer (EPMA, JEOL Ltd., Japan). The composition data were processed using a statistical-significance characterization method based on a weighted interval rank sort (WIRS) scheme. A total of 64 points arranged in an 8 × 8 grid with a spacing of 8 μm were sampled for ranking. The microsegregation degree of W was calculated from the WIRS-sorted concentration range as
Dislocation slip traces were characterized by electron channeling contrast imaging (ECCI) using a Sigma 360 field-emission scanning electron microscope (Carl Zeiss Microscopy GmbH, Germany) operated at 10 kV. Detailed microstructural features and dislocation configurations were examined using a Talos F200X transmission electron microscope (TEM, FEI/Thermo Fisher Scientific, USA) equipped with an energy-dispersive X-ray spectroscopy (EDS) detector and operated at 200 kV. TEM discs with dimensions of Φ
RESULTS AND DISCUSSION
Solidification theory-guided machine learning framework and data collection
Figure 1 shows the framework for inverse design of fine-grained AM RHEAs based on solidification theory-guided ML. The framework involves (1) database generation based on integrated calculations and experiments, (2) feature engineering to simplify the model and improve computational efficiency, (3) surrogate model training, and (4) inverse design combining composition and process optimization using multi-objective optimization and new decision-making strategies.
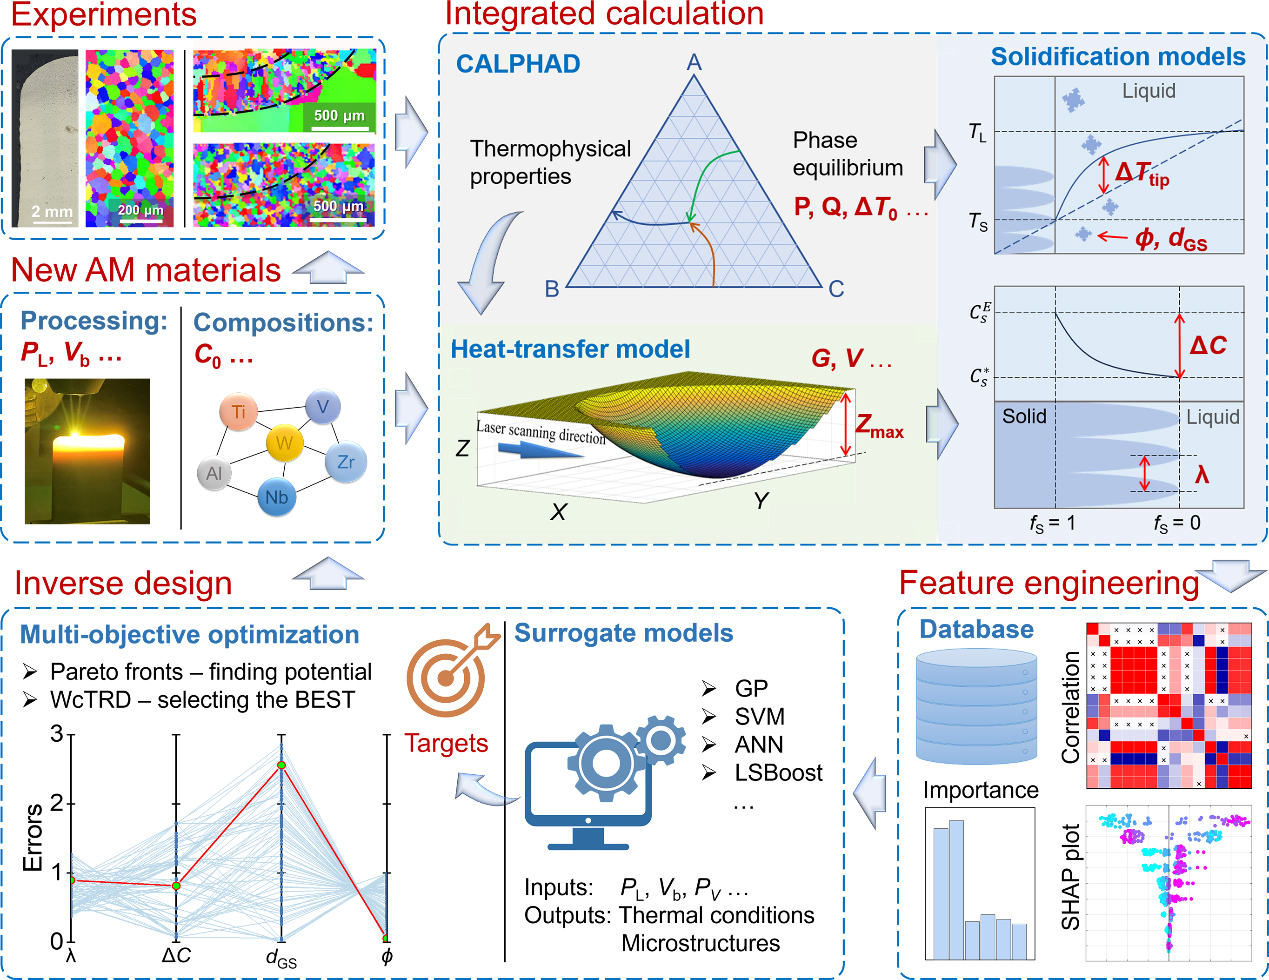
Figure 1. Schematic of the solidification-guided ML framework for the processing selection and compositional design of AM high-strength RHEAs. ML: Machine learning; AM: additive manufacturing; RHEAs: refractory high-entropy alloys; ANN: artificial neural network; WcTRD: W-containing Ti-rich RHEAs designer; CALPHAD: CALculation of PHAse diagrams; GP: gaussian process; SVM: support vector machine.
For the design of new alloys, the composition C0 and three phase equilibrium parameters related to composition (i.e., ΔT0, P and Q) are of primary concern, as mentioned above. However, during rapid solidification processing like LMD, the solidification parameters deviate from equilibrium conditions and should be replaced by velocity-dependent parameters. The velocity-dependent liquidus slope mv and partition coefficient kv are respectively given by[45,46]:
where V is the solidification velocity, D is the mean diffusion coefficient in the liquid, and a0 is the length of atomic dimensions. Accordingly, a a0 of 0.289 × 10⁻⁹ m was used and P and Q should also be replaced by velocity-dependent PV and QV, respectively[11]. Therefore, PV and QV are not simple nominal-composition descriptors, but physically informed composition-solidification descriptors that couple alloy chemistry with the velocity-dependent solute redistribution during rapid solidification. The D and phase equilibrium data were extracted using calculation of phase diagrams (CALPHAD) method and listed in Supplementary Table 1.
In addition to the composition and composition-related features (i.e., C0, ΔT0, PV, and QV), laser power PL and laser scanning velocity Vb are mostly important parameters for final microstructure and properties of LMD alloys. However, these direct processing features are not the essential factors that determine the solidification microstructure. As a result, it is difficult to establish an accurate relationship between processing and microstructure based on a small number of experiments. In fact, the processing primarily affects the solidification conditions in laser melt pools (temperature gradient G and solidification velocity V), while G and V determine the solidification microstructure. Consequently, the initial step of the ML framework is an integrated calculation, which combines an analytical heat-transfer model that provides G and V, solidification models that evaluate solidification and microstructure features according to G and V, and the CALPHAD method that gives thermophysical parameters required for the first two calculations [Supplementary Table 1].
Four microstructure features dependent on solidification conditions are prioritized for the simultaneous optimization of composition and processing, i.e., the primary dendritic arm spacing (PDAS) λ, the microsegregation degree ΔC, and the size and fraction of the equiaxed grains dGS and ϕ. In addition to the final microstructure features and solidification conditions, two intermediate features important for microstructure formation are collected, i.e., the melt pool depth Zmax and the actual constitutional supercooling at dendritic tip ΔTtip. All 14 features including processing, composition(-related), solidification and microstructure are stored in a database.
Phase equilibrium and integrated calculation
For a multi-principal-element system, phase equilibria are highly complex, making it difficult to collect the thermophysical and thermodynamic parameters required for evaluating the solidification process. Therefore, a reasonable pseudo-binary simplification is necessary before the integrated calculation. In the present Ti-rich multi-principal-element system, Nb and W exert much stronger effects on solute partitioning and constitutional supercooling than the other elements, as shown in Table 1. The partition coefficients of Al, V, and Zr are close to unity, and their corresponding P and Q values approach zero, indicating relatively weak contributions to solute redistribution and constitutional supercooling compared with Nb and W. Therefore, Al, V, and Zr were not treated as independent segregation-controlling solutes but were incorporated into the Ti-rich matrix side of the pseudo-binary system. The thermodynamic and diffusion parameters of Nb and W used in the integrated calculation are provided in Supplementary Table 1. Accordingly, two pseudo-binary simplifications can be considered for the present system, namely AlTiVZrNb-W and AlTiVZr-NbW. As shown in Supplementary Figure 1, the AlTiVZr-NbW pseudo-binary system satisfies m(k-1) > 0, which is required for application of the solidification model adopted in this work[45]. Therefore, this pseudo-binary system was selected for subsequent solidification calculations and database generation. In contrast, the AlTiVZrNb-W pseudo-binary system does not satisfy this condition and was therefore not adopted.
To generate a diverse dataset for surrogate model training, a wide processing window and five compositions were selected for the integrated calculation, with PL ranging from 1,000 to 1,600 W, Vb from 5 to 20 mm/s [Supplementary Table 2], and alloy compositions of (Ti3.6Zr1.2V0.8NbAl0.3)100-xWx, where x = 0.3, 2, 4, 6, and
Based on the simplified pseudo-binary AlTiVZr-NbW system, the calculated microstructural evolution trends are shown in Supplementary Figure 2. To validate the reliability of the integrated calculation, a set of laser-remelting experiments was performed to guide the selection of processing parameters and evaluate the accuracy of the analytical heat-transfer model. As shown in Supplementary Figure 3, the calculated melt-pool geometries agree well with the experimentally observed ones, especially in terms of melt-pool width. This agreement indicates that the analytical heat-transfer model can reasonably capture the melt-pool geometry and provide reliable solidification conditions for subsequent calculations. The calculated microstructural evolution trends are also consistent with the experimental observations, as further shown in Supplementary Figure 4. Therefore, the dataset mainly generated from the integrated calculation can provide a physically meaningful processing-microstructure relationship for subsequent ML modeling. More details of the integrated calculation are provided in the Supplementary Materials.
Feature engineering and machine learning
Based on the dataset generated by the experimentally validated integrated calculation, the database contains 14 features and 888 data sets, including 2 processing features, 4 composition-related features, 1 melt-pool size feature, 3 intermediate solidification features, and 4 microstructural features. However, excessive input features increase the complexity of the ML surrogate model and reduce the efficiency of rapid optimization and inverse design. Therefore, feature selection is necessary before surrogate model training.
For potential input features, an effective method of reducing the number of features is to exclude some dependent features and retain independent features. To evaluate the correlation between features, a Spearman’s rank correlation triangle was calculated [Figure 2], which can readily define the complex, nonlinear dependencies between features[40]. It is noteworthy that all the composition-related features are strongly correlated, while the processing features are independent, implying that only one composition-related feature impacting significantly on outputs should be retained for surrogate model training. Another notable correlation is that λ is primarily processing-dependent, but composition-insensitive. Other correlations are expected, including visible correlations between processing and solidification conditions, and strong correlations between composition features and solidification features (i.e., ΔTtip, ΔC, dGS and ϕ). These correlations provide insights into how variations primarily influence the solidification behavior. For example, an increase in W significantly augments ΔTtip, ΔC, as well as improves the trends of equiaxed growth.
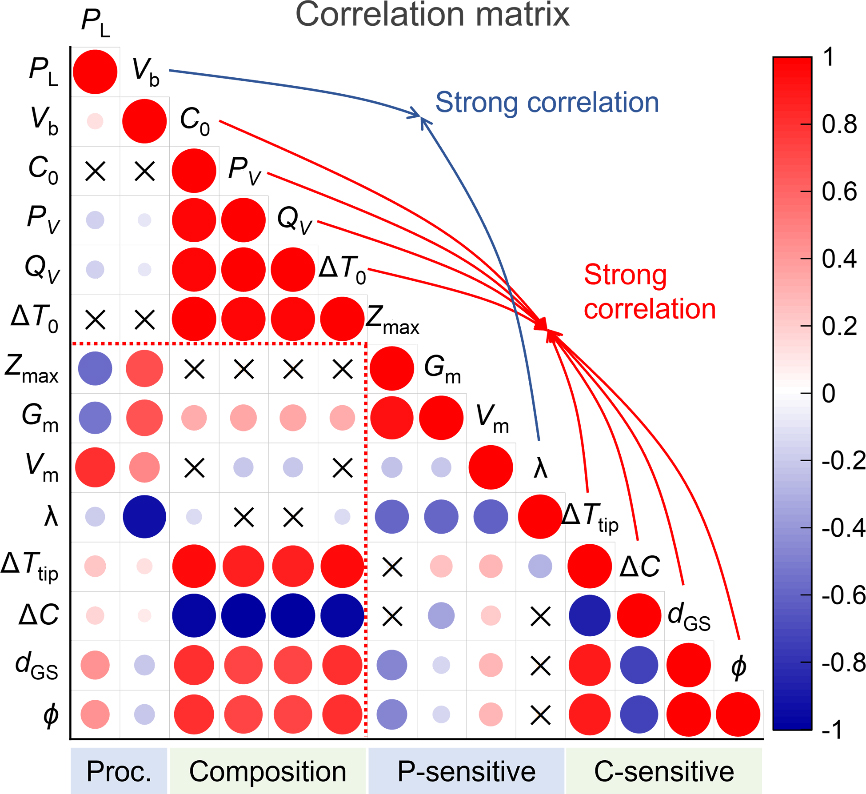
Figure 2. Spearman’s correlation triangle illustrating the relationships between processing, alloy composition-dependent features, melt pool depth, solidification conditions and solidification microstructure features. The “Proc.” refers to processing. The “P-sensitive” and “C-sensitive” mean that those features are processing- and composition-sensitive, respectively.
Although Spearman’s rank correlation analysis can evaluate the correlations between input features, which feature has the most significant impact on the outputs remains unknown. Therefore, the feature importance and SHapley Additive exPlanations (SHAP) analyses were performed based on a random forest model. As shown in Figure 3A, processing features PL and Vb play the most important role in the outputs. It is noteworthy that compared to PV and QV which contain both composition and phase equilibrium information, C0 (only composition) and ΔT0 (only phase equilibrium) have relatively weak impacts on the outputs. Detailed comparison shows that PV is somewhat more important than QV.
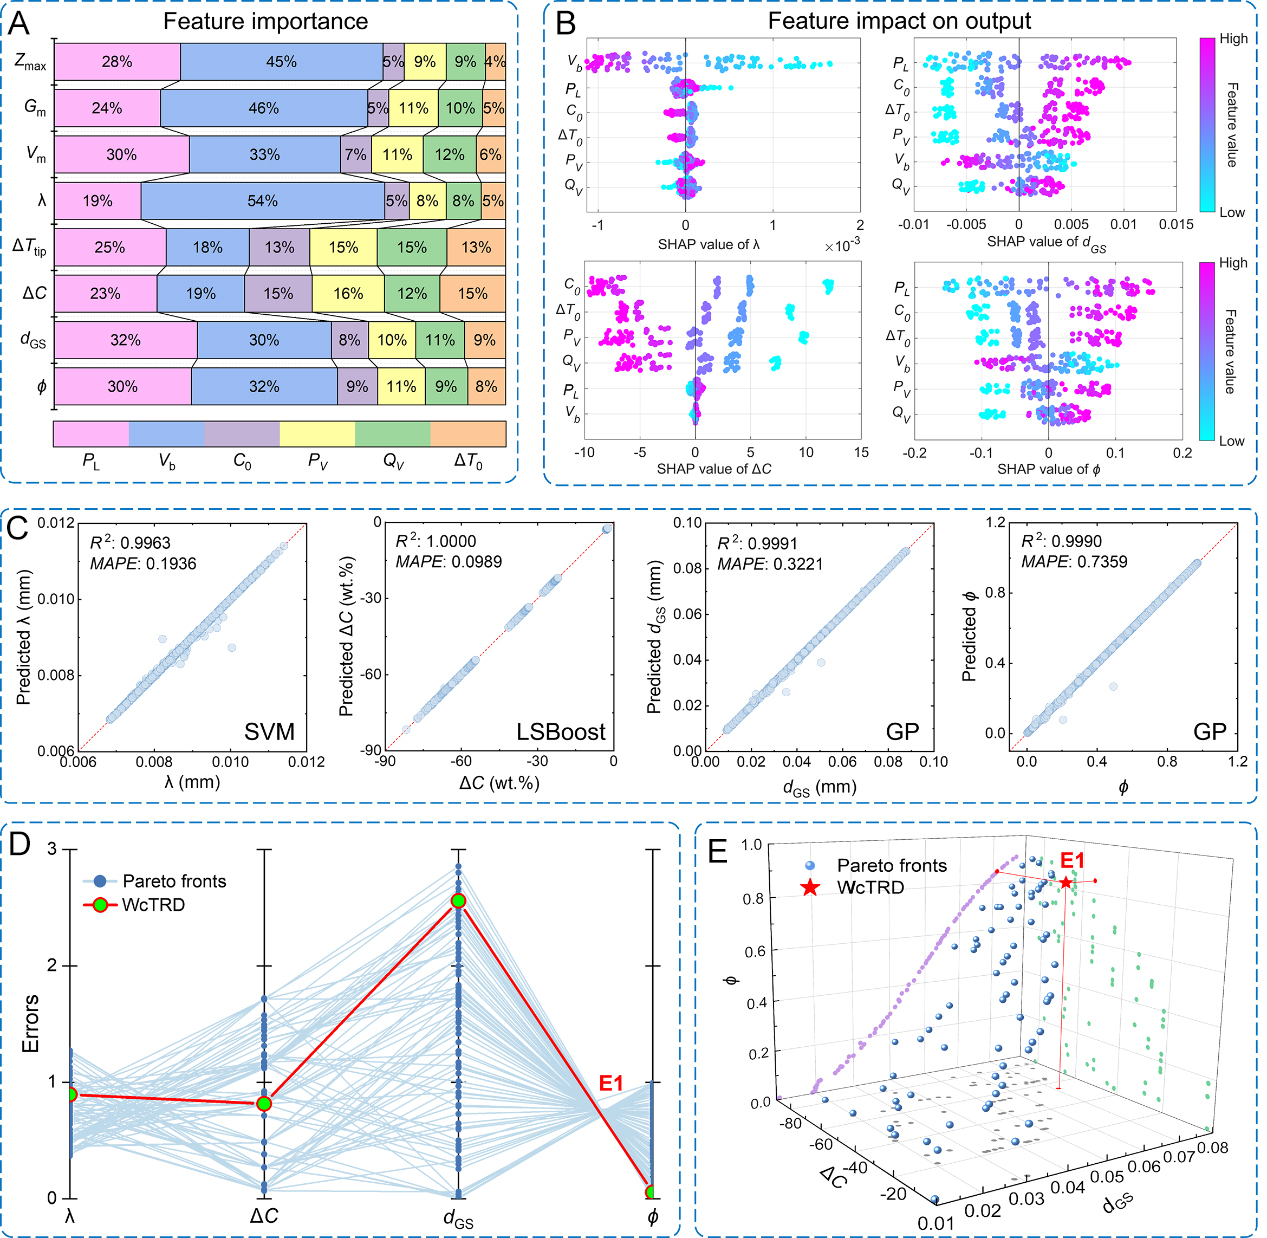
Figure 3. Feature engineering, ML surrogate model training and inverse design based on multi-objective optimization. (A) Feature-importance analysis of the processing and composition-related features for each output; (B) SHAP beeswarm plots showing the effects of the selected features on each microstructural output; (C) Prediction performance of the trained surrogate models for the microstructural features; (D) Parallel-coordinates plot of the Pareto-front solutions based on the optimization targets. The red line represents the solution selected by WcTRD; (E) Three-dimensional scatter plot of the Pareto-front solutions. The red star represents the E1 alloy selected by WcTRD. SHAP: SHapley Additive exPlanations; ML: machine learning; WcTRD: W-containing Ti-rich RHEAs designer; LSBoost: least squares boosting; GP: gaussian process; SVM: support vector machine; MAPE: mean absolute percentage error.
In all 8 potential output features, Zmax, Gm, Vm, and ΔTtip are intermediate features, and they, though important for microstructure formation, cannot directly affect alloy properties. In other words, these features can be ignored in subsequent inverse engineering, although they are also trained and essential for the integrated calculation. As a result, only the microstructural features, λ, ΔC, dGS and ϕ, were considered. For a beeswarm plot based on SHAP values, a large deviation from 0 means a strong impact on the model output. After sorting the SHAP values, the feature located at a high position represents a large contribution to the model output. As shown in Figure 3B, λ is a strong processing-dependent feature, while ΔC is composition-sensitive. This observation is in agreement with the Spearman’s correlation analysis. In contrast, dGS and ϕ are multi-factor related. In agreement with the importance analysis in Figure 3A, PV has a stronger impact on the outputs than QV. The nominal W content was not directly used as the compositional input because it only describes alloy chemistry and cannot explicitly reflect the thermodynamic and kinetic effects of W during rapid solidification. In contrast, PV incorporates the effects of W content, liquid slope, partition coefficient and solidification velocity, and therefore provides a more physically informed descriptor for evaluating the ability of W addition to promote constitutional supercooling and equiaxed-grain formation. Thus, PL, Vb and PV were selected as the input features for training the ML surrogate models.
To improve the performance of the surrogate models, four regression algorithms, including support vector regression (SVR), Gaussian process regression (GPR), artificial neural network (ANN), and least squares boosting (LSBoost), were selected. The dataset was split into training and testing subsets for each target variable using an 8:2 ratio. To robustly evaluate the performance and generalizability of the surrogate models, a 10-fold cross-validation was performed. Meanwhile, different surrogate models present different predictive performance for different outputs. Therefore, each output was trained separately, and the models with higher R2 scores and lower mean absolute percentage error (MAPE) values performed better. These models were tuned for optimal hyperparameters and selected based on R2 scores and MAPE values. As shown in Supplementary Figure 5, the SVR model can establish the best relationship between the input features and λ, while LSBoost algorithm can accurately predict ΔC based on the inputs. In contrast, the GPR method shows superior performance for the prediction of dGS and ϕ. Accordingly, the four models were selected in subsequent inverse engineering [Figure 3C].
Inverse design based on multi-objective coordination optimization
After the surrogate models were trained, the solidification microstructure can be rapidly predicted without acquiring G, V, and ΔTtip, provided that PL, Vb and PV are input. However, finding targeted microstructure and properties by forward prediction is very time-consuming and sometimes even impractical. Therefore, the inverse engineering for simultaneous composition optimization and processing selection is performed based on a variant of nondominated sorting genetic algorithm II (NSGA-II), which can handle multi-objective problems involving continuous, discrete or mixed variables by finding Pareto fronts with excellent diversity[49]. In other words, potential composition and processing parameters can be acquired by inverse engineering, as long as the targeted microstructure features (i.e., λ, ΔC, dGS and ϕ) were determined.
For AM single-phase alloys, the most concerning microstructure feature is grain morphology, which is directly related to ϕ, and fully equiaxed growth occurs when ϕ > 49%[50]. Accordingly, Pareto fronts were found based on a target ϕ value of 90%. Figure 3D plots the absolute values of Pareto front errors on parallel coordinates (light blue lines). According to the line chart, competitive relationships between objectives can be found. For example, a decrease in ϕ causes an increase in dGS, and a reduction in ΔC often increases λ. These contradictions underscore the difficulty in the current multi-objective optimization.
To overcome the contradictory nature between features, an inverse design system - W-containing Ti-rich RHEAs Designer (WcTRD) - was developed. This system uses an error-based strategy to select the optimal solution set. This strategy first selects the top 20% Pareto fronts with the smallest errors of ϕ, and then calculates the total weighted errors of the selected Pareto fronts using Errortotal = ∑iweighti·errori (i = λ, ΔC, dGS, and ϕ), and the weights listed in Table 2. The Pareto fronts with the minimum Errortotal are finally selected into the optimal solution set. For a fine equiaxed microstructure, dGS is the most important and λ can be given little attention. Considering the microstructural characteristics, the weights and targets are individually set [Table 2]. As shown in Figure 3D and E, the red line highlights the WcTRD decision, i.e., E1 in Table 3.
The values and weights of different target microstructure features for decision-making
| Target microstructure features | Weights for WcTRD | ||||||
| λ (μm) | ΔC (wt.%) | d GS (μm) | ϕ (%) | λ | ΔC | d GS | ϕ |
| 5 | -30 | 20 | 90 | 0.05 | 0.35 | 0.4 | 0.2 |
The processing parameters, composition and resulting microstructure features suggested by the ML surrogate models
| Processing | Composition | Microstructural features | ||||||
| P L (W) | V b (mm/s) | PV (K) | C 0 (wt%)/(at%) | λ (μm) | ΔC (wt.%) | d GS (μm) | ϕ (%) | |
| E1 | 1556 | 7.75 | 231.5 | 16.7/6.3 | 9.5 | -54.5 | 71.2 | 85.7 |
Microstructure
To validate the feasibility of ML-assisted inverse design, the E1 alloy was fabricated using the composition and LMD parameters suggested by the model. As listed in Table 3, the nominal composition of E1 is (Ti3.6Zr1.2V0.8NbAl0.3)93.7W6.3, or T5093.7W6.3. The as-deposited E1 alloy exhibits a fully fine-equiaxed microstructure with an average grain size of 49.6 μm, as shown in Figure 4A-E. According to the CET criterion adopted in this work, a fully equiaxed microstructure is expected when ϕ > 49%[50]. Therefore, the ML-predicted ϕ of 85.7% is consistent with the experimentally observed fully equiaxed grain morphology. The measured grain size is smaller than the predicted value of 71.2 μm, which may be related to spatial variations in grain size and the simplified description of heterogeneous nucleation in the model. Therefore, the model provides a slightly conservative prediction of the absolute grain size while correctly capturing the targeted fully equiaxed microstructure. In the last several layers near the sample top, equiaxed solidification dendrites can be clearly observed, as shown in Figure 4B-D. Their characteristic size is about several micrometers [Figure 4C], consistent with the fine solidification feature predicted by the model. Below these top layers, the dendritic contrast becomes less distinct due to repeated thermal exposure during subsequent deposition, while the macroscopic grain morphology remains fine and equiaxed [Figure 4A and E]. For comparison, T50 exhibits a much coarser equiaxed microstructure with an average grain size of 265 μm [Figure 4F].
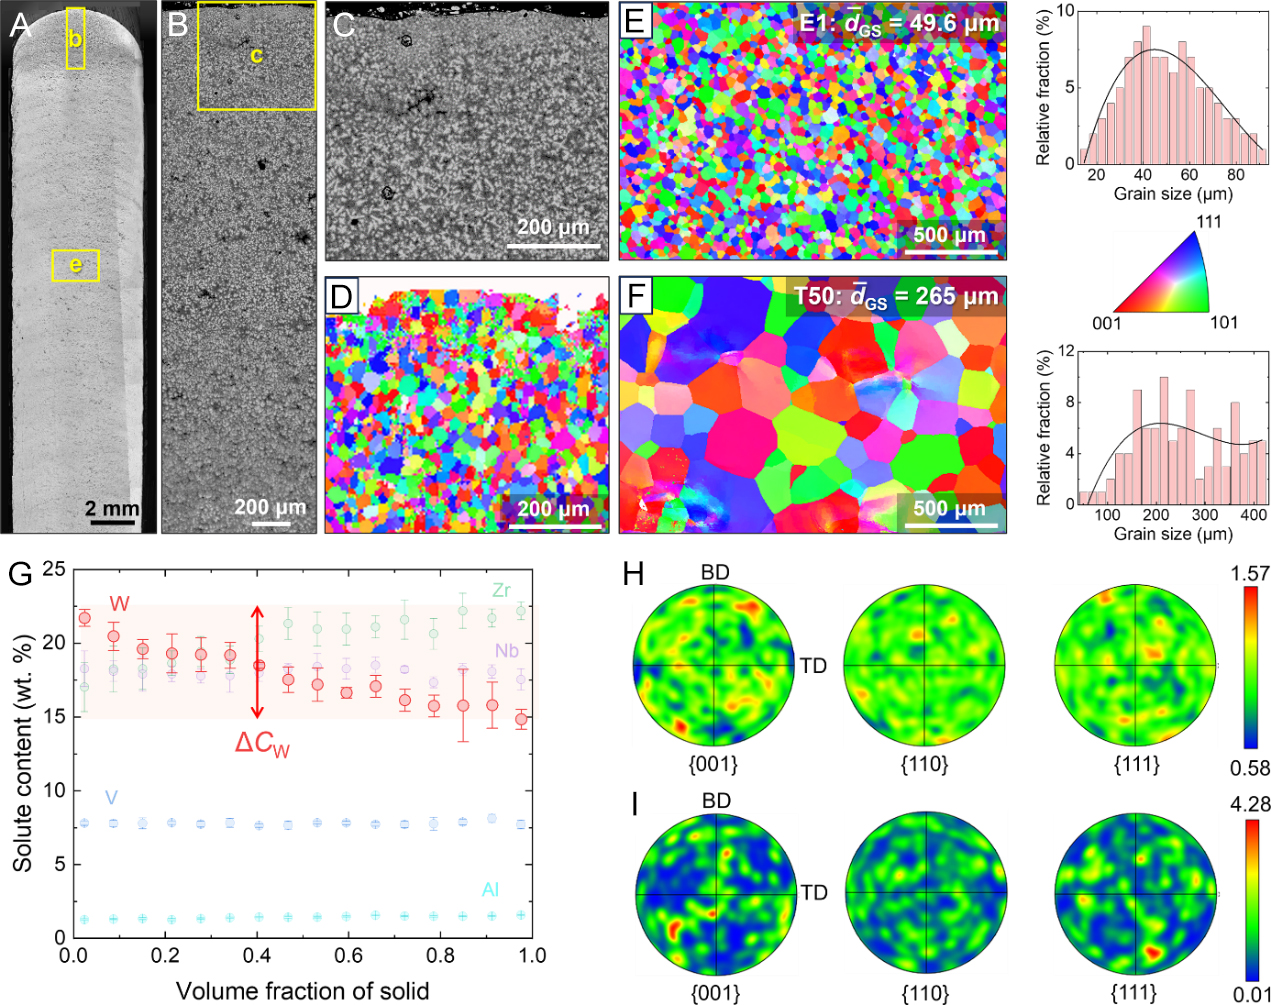
Figure 4. Microstructure and elemental distribution of the LMD E1 and T50. (A) OM image showing the grain morphology of E1; (B) SEM-BSE image showing the microstructural evolution within the last several layers; (C and D) SEM-BSE image and EBSD inverse pole figure showing the dendrite and grain morphology, respectively, at the sample top, marked by a yellow box in (B); (E and F) EBSD inverse pole figures showing the grain morphology and grain size distribution in the main body of the LMD E1 and T50, respectively; (G) Distribution of elements with increasing solid fraction in E1 during solidification; (H and I) EBSD pole figures showing the texture in the main body of the LMD E1 and T50 alloys, respectively. LMD: Laser metal deposition; OM: optical microscope; SEM: scanning electron microscope; BSE: back-scattered electron; EBSD: electron backscatter diffraction; BD: building direction; TD: transverse direction.
The formation of this fine equiaxed microstructure results from the synergistic effects of W-enhanced constitutional supercooling and heterogeneous nucleation. The increase in P and Q enhances solute accumulation and constitutional supercooling ahead of the solid-liquid interface, thereby increasing the tendency for CET[51]. However, constitutional supercooling alone does not directly determine the final grain morphology. The local growth velocity controls the competitive advance of the columnar solidification front, while heterogeneous nucleation provides the nuclei required for equiaxed-grain formation. When sufficient constitutional supercooling develops ahead of the interface and the growth of the columnar front is effectively restricted, heterogeneous nuclei can survive and grow, eventually promoting CET and grain refinement.
Figure 4G shows the concentration profiles of the constituent elements in the solid measured by EPMA and analyzed using the weighted interval rank sort scheme[33,44]. W exhibits a pronounced microsegregation tendency and is enriched in dendritic cores because its partition coefficient is larger than unity. The measured W microsegregation degree (ΔCW), calculated from the full WIRS-sorted concentration range, is approximately -15 wt.%, which is lower in magnitude than the ML-predicted value of -54.5 wt.%. The concentrations plotted in Figure 4G are interval-averaged values and therefore exhibit a smaller apparent concentration range than the full dataset used to calculate ΔCW. The model mainly describes the intrinsic segregation tendency formed during rapid solidification, whereas the experimental value represents the final segregation state after multilayer LMD deposition. Repeated thermal cycling during subsequent deposition promotes elemental diffusion and partial homogenization, thereby reducing the final W segregation. Therefore, the model provides a relatively conservative estimate of the W segregation tendency for microstructure-oriented inverse design.
Figure 4H and I presents the EBSD pole figures corresponding to Figure 4E and F, respectively. The E1 alloy exhibits a very weak texture with a maximum texture intensity of 1.57 [Figure 4H]. In contrast, although T50 also exhibits a fully equiaxed microstructure, its maximum texture intensity reaches 4.28 [Figure 4I]. This result indicates that the strong directional heat flux during LMD still affects grain growth and orientation selection, leading to a relatively stronger texture in T50. The addition of W increases ΔT0, P, and Q, thereby promoting CET and weakening the influence of directional heat flux on grain growth[11,12]. Such microstructural changes are expected to reduce the anisotropy of mechanical properties.
Mechanical behavior
Figure 5A shows the engineering stress-strain curves of E1 and T50 tested along different directions. The yield strength (YS) and ultimate tensile strength (UTS) of the inverse-designed E1 tested along the L direction are 1,215 ± 15 MPa and 1,241 ± 9 MPa, respectively, approximately 33% higher than those of T50. In addition, E1 exhibits an elongation of about 16%, higher than that of T50, indicating a favorable strength-ductility combination. Considering the density increase associated with W addition, E1 still exhibits a high specific yield strength of approximately 191.33 MPa·cm3·g-1, demonstrating a favorable strength-to-density balance. Notably, the tensile properties of E1 along the L and T directions are almost identical, indicating good mechanical isotropy, which is consistent with its fully equiaxed grains and weak texture. In contrast, T50 exhibits a slight difference in ductility between the L and T directions, which may be associated with its coarse grains and relatively stronger texture [Figure 4I]. These results demonstrate the feasibility of the ML-assisted inverse-design strategy for developing fine-grained AM RHEAs.
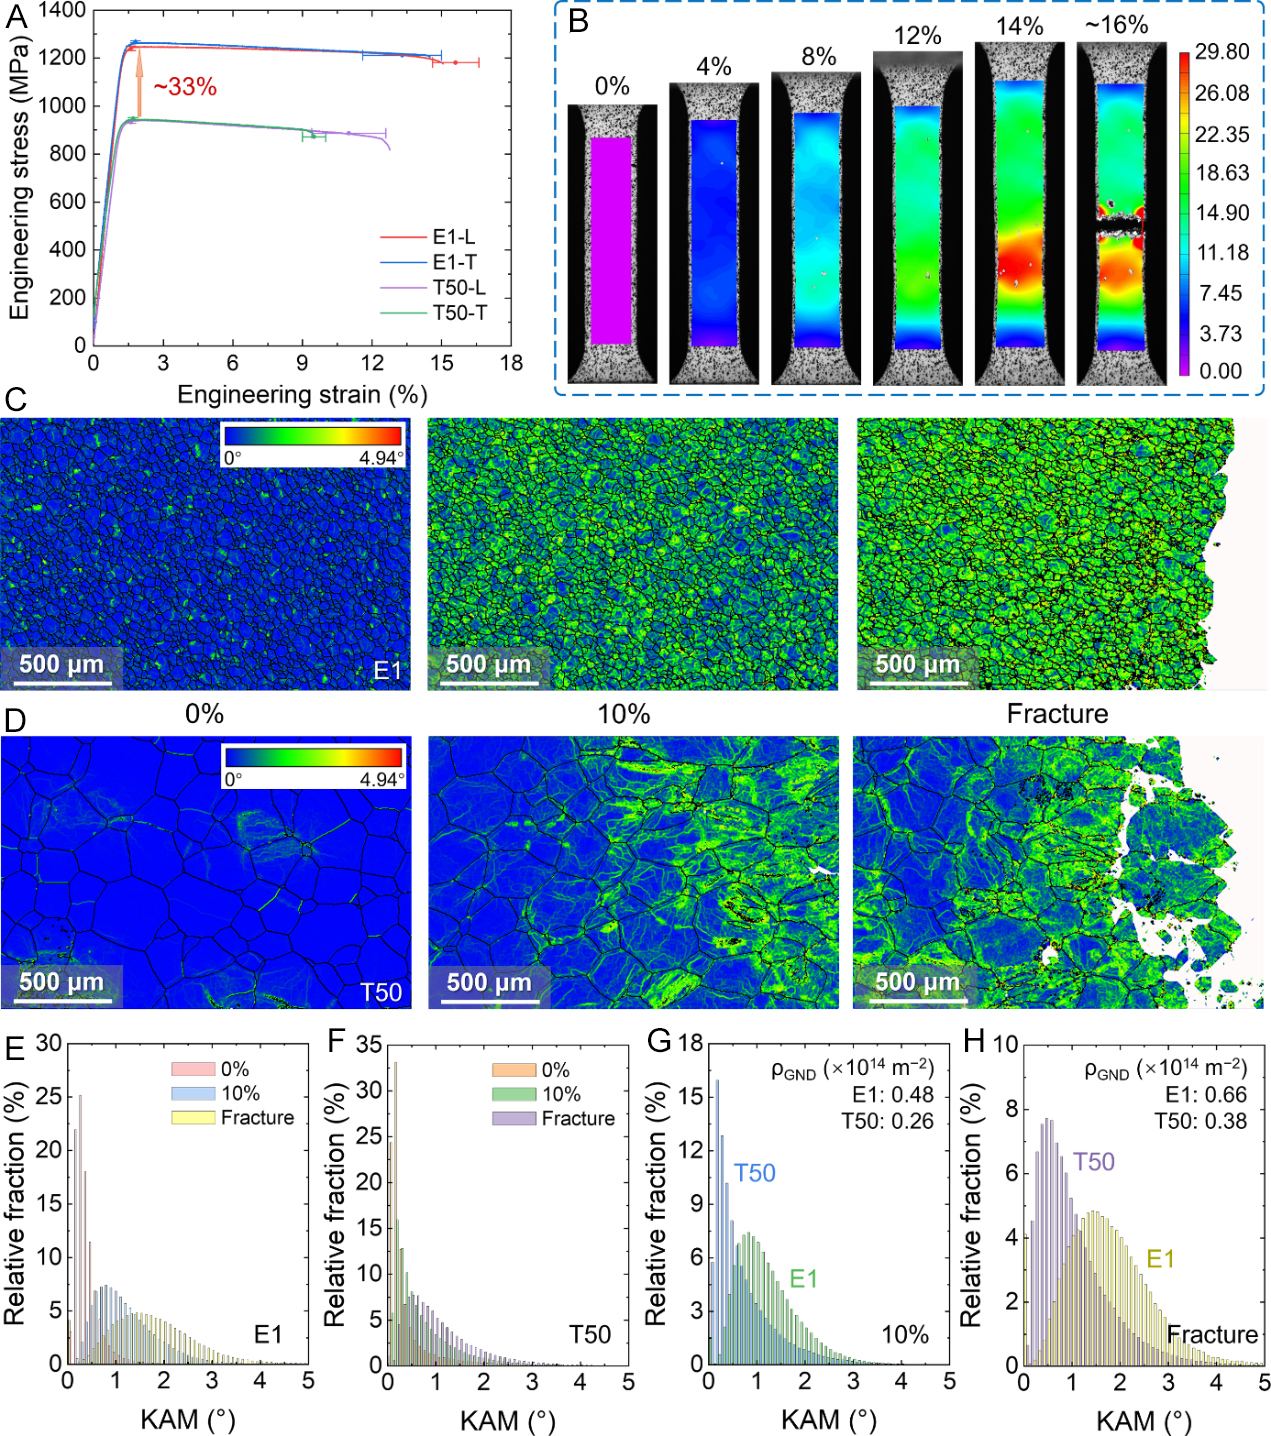
Figure 5. Mechanical behavior of the LMD E1 and T50. (A) Tensile engineering stress-strain curves of the E1 and T50 alloys loaded along different directions. The error bars along the strain and stress axes indicate the standard deviations of fracture strain and yield strength, respectively, from at least three independent tensile tests for each condition; (B) DIC analysis for E1 loaded along L directions; (C and D) KAM distribution of E1 and T50, respectively, at different strain levels (0%, 10% and the strain at fracture); (E and F) Statistics of the relative KAM fraction of grains in E1 and T50, respectively, at different strain levels (0%, 10%, and the strain at fracture); (G and H) Comparison of the relative KAM fraction and GND densities between E1 and T50 at 10% strain and the strain at fracture, respectively. LMD: Laser metal deposition; DIC: digital image correlation; KAM: kernel average misorientation; GND: geometrically necessary dislocation.
Considering the limited directional dependence of the tensile behavior, the deformation behavior was investigated using specimens tested along the L direction. Figure 5B shows the axial strain-field maps of E1 obtained by DIC. At the initial stage of deformation (strain < 8%), the axial strain is uniformly distributed throughout the gauge region without obvious strain localization. As the strain increases to 8%, localized deformation begins to emerge, but this tendency weakens at 12% strain. At 14% strain, more pronounced strain localization accompanied by slight necking is observed. Finally, fracture occurs at approximately 16% strain. These observations indicate that the inverse-designed E1 alloy exhibits good resistance to strain localization.
Figure 5C and D present the KAM distributions of E1 and T50, respectively, at different strain levels. KAM qualitatively reflects the local plastic strain, and a higher KAM value is generally associated with a higher geometrically necessary dislocation (GND) density (ρGND) and more pronounced plastic deformation[52]. Before loading, both specimens exhibit low KAM values. As the strain increases, the KAM values gradually increase. At strains above 10%, plastic deformation becomes more pronounced and is relatively uniformly distributed throughout the E1 specimen, whereas in T50, deformation is mainly localized in a limited number of grains near the fracture region.
The difference in strain localization between E1 and T50 is further reflected by the relative KAM fraction statistics shown in Figure 5E-H. In E1, the KAM peak shifts to higher values and the distribution becomes broader with increasing strain, indicating that more grains progressively participate in plastic deformation [Figure 5E]. By contrast, deformation in T50 is concentrated in a smaller fraction of grains, while most grains retain relatively low KAM values [Figure 5F]. At the same tensile strain, E1 exhibits a higher KAM level, a broader KAM distribution, and a ρGND nearly twice that of T50 [Figure 5G], indicating enhanced deformation-induced dislocation storage and strain accommodation. Figure 5H compares the two alloys at their respective fracture states rather than at the same strain and is therefore used to evaluate the final deformation-induced dislocation accumulation associated with fracture. The higher ρGND in E1 contributes to enhanced strain hardening and delays strain localization and necking[24]. These results are consistent with the tensile behavior shown in Figure 5A and B, indicating that W addition promotes more homogeneous deformation through grain refinement and reduced microstructural anisotropy.
To understand the difference in deformation uniformity, ECCI and bright-field TEM (BF-TEM) analyses were performed on the two alloys at a tensile strain of 10% [Figure 6]. In E1, slip lines are densely and uniformly distributed within the grains, and multiple-slip activity is clearly observed [Figure 6A and B]. TEM observations also reveal pronounced multiple-slip characteristics [Figure 6C and D]. The dislocations are extensively intertwined, exhibiting a transition from planar to wavy slip, which promotes dislocation accumulation and contributes to more uniform deformation[53]. In contrast, the slip lines in T50 are sparse, and only one primary slip system is activated in many grains, leading to pronounced stress concentration near the grain boundaries (GBs). As shown in Figure 6E and F, a void is observed at a triple junction, which may promote premature failure and reduce ductility. In the TEM images [Figure 6G and H], little cross-slip or multiple-slip activity is observed, and planar slip is dominant. A large number of dislocations are confined to a limited number of active slip planes, resulting in localized deformation within a few grains with high Schmid factors [Figures 5D and 6E].
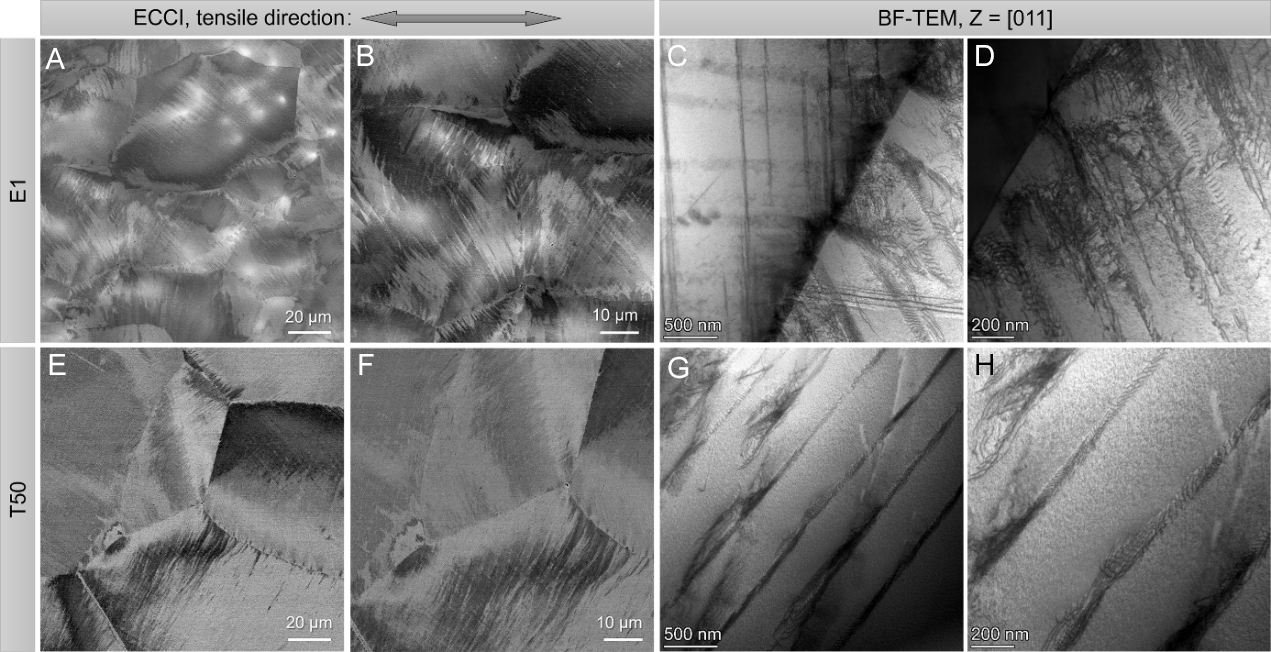
Figure 6. Slip trace and dislocation configuration analyses of the E1 and T50 alloys at 10% strain. (A and B) ECCI analysis showing intersected slip lines with a high density in E1; (C and D) BF-TEM image showing a multiple-slip characteristic in E1; (E and F) ECCI analysis showing a low density of slip lines in T50; (G and H) BF-TEM images showing deformation dominated by planar slip in T50. ECCI: Electron channeling contrast imaging; BF-TEM: bright-field TEM; TEM: transmission electron microscope.
DISCUSSION
As shown in the tensile engineering stress-strain curves [Figure 5A], the YS of E1 is ~300 MPa higher than that of T50, exhibiting a 33% increase in the YS after addition of W. For a single-phase RHEA, the YS can be evaluated by[54]:
where (σ0.2)mix is the intrinsic YS; ΔσS, ΔσG, and Δσd represent the increase in the YS resulting from solid solution atoms, grain refining, and an increase in dislocation density, respectively. For the two RHEAs, (σ0.2)mix is given by[29]:
where ci is the molar concentration of the component element and σyi is the YS of the pure element at room temperature. Based on the final E1 composition and the elemental YS values listed in Table 4, (σ0.2)mix was calculated to be 209.2 MPa for T50 and 230.6 MPa for E1, corresponding to a difference of 21.5 MPa. The initial ρGND estimated from EBSD measurements for the undeformed E1 and T50 alloys are 1.4 × 10¹³ m-2 and 1.5 × 10¹³ m-2, respectively. The dislocation densities in the two specimens are approximate and hence the discrepancy in Δσd can be neglected[21,55].
| Ti | Zr | V | Nb | Al | W | |
| ri (pm) | 146.5 | 161 | 130.9 | 142.9 | 135.9 | 136 |
| σyi (MPa) | 195 | 280 | 103 | 240 | 276 | 550 |
As expected, addition of W significantly refines the grains [Figure 4]; the contribution of GBs to the strength difference should be considered. The strength increase resulting from grain refinement, i.e., ΔσG, can be evaluated using the Hall-Petch relation[10]:
where
As aforementioned, W is an efficient solid solution strengthener for Ti-rich alloys as well as Ti-rich RHEAs because of the large difference in atomic radius and shear modulus[12,54,57,58]. A common model to evaluate the solid solution strengthening in RHEAs at 298 K is Senkov-Yao model, which is given by[24,59]:
in which α is a deviation in the interaction of foreign atoms, and it is 16 for the BCC solid solution[29]. The δrij = 2(ri - rj)/(ri + rj) and δGij = 2(Gsi - Gsj)/(Gsi + Gsj) are the differences in atomic radius r and shear modulus Gs between elements i and j, respectively. Accordingly, the difference in ΔσS between T50 and E1 was calculated to be 268 MPa based on the data listed in Tables 1 and 4[28,29]. Together with the intrinsic YS difference of 21.5 MPa and the grain-refinement strengthening contribution of 19.3 MPa, the total calculated increase in YS is approximately 308.8 MPa, which agrees well with the experimentally observed increase of approximately 300 MPa. This comparison indicates that the YS increase is dominated by W-induced solid-solution strengthening, highlighting W as an effective strengthening element for Ti-rich RHEAs when an appropriate composition-processing combination is achieved through ML-assisted optimization.
Figure 7A and B illustrates the fractography of the E1 and T50 tensile specimens, respectively. Both specimens exhibit intergranular fracture characteristics, indicating that grain-boundary cracking plays an important role in the final fracture process. For T50 with a coarse-grained microstructure, plastic deformation tends to localize within limited grains, resulting in severe strain incompatibility and stress concentration at grain boundaries, which promotes premature intergranular cracking. In contrast, the fine fully equiaxed grains in E1 enable more homogeneous strain distribution and activate plastic deformation in more grains, as demonstrated by the KAM and GND analyses [Figures 5 and 6]. Grain refinement also facilitates compatible slip transfer and distributed plastic deformation between neighboring grains[60-63]. Therefore, the higher elongation of E1 does not indicate the elimination of grain-boundary embrittlement; rather, it results from the improved deformation compatibility provided by the refined microstructure, which partially mitigates the detrimental effect of weakened grain boundaries. The Ti-Zr-rich grain-boundary phases, as further revealed by TEM analysis below, remain detrimental to grain-boundary cohesion and provide preferential sites for intergranular crack initiation[21,47]. Although the fine equiaxed grains of E1 improve deformation compatibility, these grain-boundary phases still limit further ductility improvement.
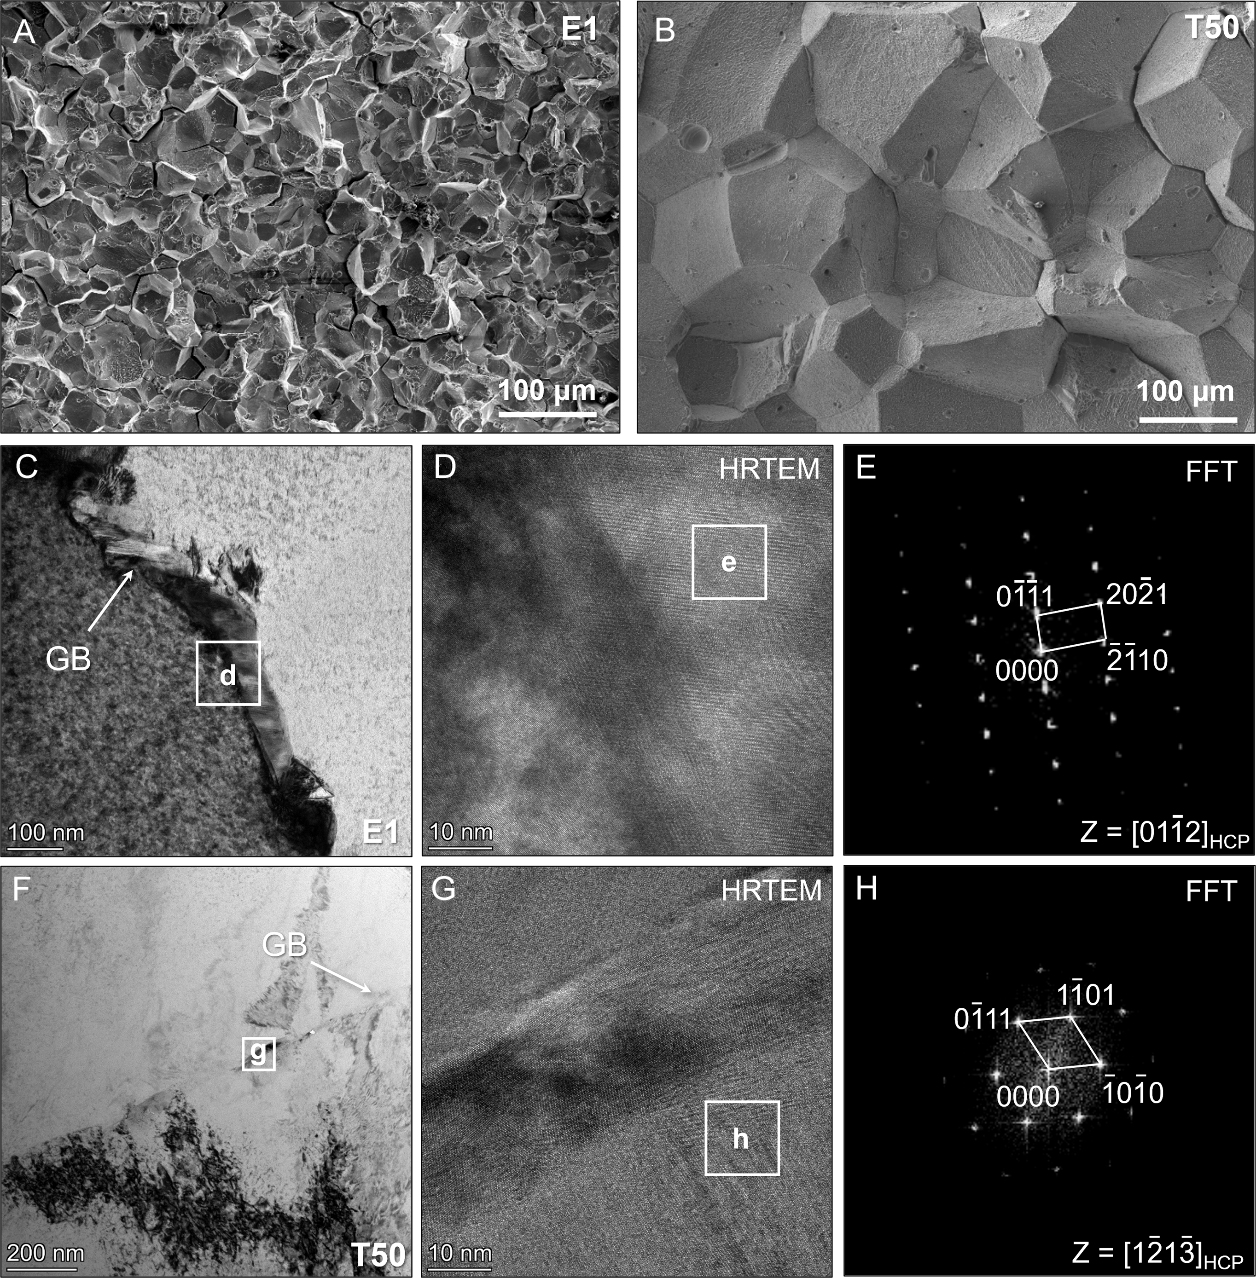
Figure 7. The fractography and GB phases of the LMD E1 and T50 alloys. (A and B) SEM-SE images showing the fractography of E1 and T50, respectively; (C) BF-TEM image showing a GB phase in E1; (D and E) HRTEM image and corresponding FFT pattern of the GB phase in E1; (F) BF-TEM image showing a GB phase in T50; (G and H) HRTEM image and corresponding FFT pattern of the GB phase in T50. GB: Grain boundarie; LMD: laser metal deposition; BF-TEM: bright-field TEM; TEM: transmission electron microscope; HRTEM: high-resolution transmission electron microscopy; SEM-SE: scanning electron microscopy - secondary electrons; FFT: fast fourier transform.
Consequently, TEM analyses were performed at the GBs, as shown in Figure 7C-H. GB phases are observed in both E1 and T50 [Figure 7C and F]. High-resolution transmission electron microscopy (HRTEM) images and the corresponding fast fourier transform (FFT) patterns indicate that these GB phases possess a hexagonal close-packed (HCP) lattice structure. EDS analysis further shows that the GB phases in both alloys exhibit similar chemical characteristics and are enriched in Ti and Zr [Table 5]. These Ti-Zr-rich GB phases are considered to form during the LMD thermal history, possibly assisted by repeated thermal cycling during multilayer deposition. During subsequent laser scans, previously deposited layers undergo cyclic reheating, which promotes short-range diffusion and Ti/Zr redistribution toward the GBs, thereby facilitating the formation of Ti-Zr-rich GB phases under the non-equilibrium thermal conditions of LMD. Their presence weakens GB cohesion and provides preferential sites for intergranular cracking, which is consistent with previous reports[21,23]. Therefore, the ductility of E1 is expected to be further improved by eliminating or modifying these GB phases through suitable post-deposition heat treatment.
The chemical compositions (in at%) of the GB phases
| Ti | Zr | V | Nb | Al | W | |
| GB Phases in E1 | 41.0 | 47.8 | 3.6 | 2.9 | 3.0 | 1.7 |
| GB Phases in T50 | 41.9 | 41.2 | 5.1 | 6.6 | 5.2 | / |
SUMMARY AND CONCLUSIONS
This work employs W as a grain-refining element in an LMD-fabricated Ti-rich RHEA and establishes a solidification theory-guided ML framework to accelerate alloy development through inverse design. The ML surrogate model enables simultaneous optimization of alloy composition and processing parameters and rapidly identifies suitable composition-processing combinations for targeted microstructures, thereby reducing the risk of overlooking promising compositions because of inappropriate laser processing parameters.
The W-containing Ti-rich RHEA inversely designed by the ML model, E1 (T5093.7W6.3), exhibits finer grains and better mechanical properties than the W-free counterpart T50 fabricated using the same LMD parameters. W addition significantly increases the alloy strength through solid-solution strengthening while effectively refining the grains by promoting CET. The fine equiaxed grains with weak texture in E1 promote more homogeneous strain distribution and improve deformation compatibility, contributing to enhanced ductility and reduced mechanical anisotropy. The YS and UTS of E1 are approximately 33% higher than those of T50, while its elongation is also higher, demonstrating a favorable strength-ductility combination. These results indicate that W is an attractive alloying element for Ti-rich RHEAs, provided that its microsegregation is effectively controlled. However, Ti-Zr-rich phases remain at the GBs in the as-deposited alloy because no post-deposition heat treatment was applied. These phases weaken GB cohesion and promote intergranular fracture. Therefore, the ductility of E1 may be further improved by eliminating or modifying the Ti-Zr-rich GB phases through appropriate post-deposition heat treatment.
In summary, the present solidification theory-guided ML framework enables rapid composition design and coordinated optimization of LMD processing parameters, providing an efficient route for developing fine-grained AM RHEAs. The experimental validation of E1 demonstrates the feasibility of the proposed inverse-design strategy. Although the framework is theoretically transferable to other RHEA systems, the trained surrogate model is mainly applicable within the investigated TiZrVNbAl-W composition and processing window and requires retraining or recalibration for different alloy systems.
DECLARATIONS
Authors’ contributions
Performed data acquisition, data analysis, and interpretation and wrote the first draft of the article: Liu, S.
Provided materials, conception and design of the study and interpretation: Wang, Y.
Performed data analysis and interpretation and contributed to the development of the article: Liang, Y. J.; Xue, Y.
Availability of data and materials
The original contributions presented in this study are included in the article/Supplementary Materials. Further inquiries can be directed to the corresponding authors.
AI and AI-assisted tools statement
Not applicable.
Financial support and sponsorship
This work was financially supported by the National Natural Science Foundation of China [No. 52371018].
Conflicts of interest
All authors declared that there are no conflicts of interest.
Ethical approval and consent to participate
Not applicable.
Consent for publication
Not applicable.
Copyright
© The Author(s) 2026.
Supplementary Materials
REFERENCES
1. Senkov, O.; Wilks, G.; Scott, J.; Miracle, D. Mechanical properties of Nb25Mo25Ta25W25 and V20Nb20Mo20Ta20W20 refractory high entropy alloys. Intermetallics 2011, 19, 698-706.
2. Kumar, P.; Kim, S. J.; Yu, Q.; et al. Compressive vs. tensile yield and fracture toughness behavior of a body-centered cubic refractory high-entropy superalloy Al0.5Nb1.25Ta1.25TiZr at temperatures from ambient to 1200 °C. Acta. Mater. 2023, 245, 118620.
3. Wang, Z.; Chen, S.; Yang, S.; et al. Light-weight refractory high-entropy alloys: a comprehensive review. J. Mater. Sci. Technol. 2023, 151, 41-65.
4. Wei, S.; Kim, S. J.; Kang, J.; et al. Natural-mixing guided design of refractory high-entropy alloys with as-cast tensile ductility. Nat. Mater. 2020, 19, 1175-81.
5. Senkov, O.; Rao, S.; Chaput, K.; Woodward, C. Compositional effect on microstructure and properties of NbTiZr-based complex concentrated alloys. Acta. Mater. 2018, 151, 201-15.
6. Jia, Y.; Li, G.; Ren, C.; et al. Substantially improved room-temperature tensile ductility in lightweight refractory Ti-V-Zr-Nb medium entropy alloys by tuning Ti and V content. J. Mater. Sci. Technol. 2025, 206, 234-47.
7. Zeng, S.; Zhou, Y.; Li, H.; Zhang, H.; Zhang, H.; Zhu, Z. Microstructure and mechanical properties of lightweight Ti3Zr1.5NbVAlx (x = 0, 0.25, 0.5 and 0.75) refractory complex concentrated alloys. J. Mater. Sci. Technol. 2022, 130, 64-74.
8. Wang, L.; Ding, J.; Chen, S.; et al. Tailoring planar slip to achieve pure metal-like ductility in body-centred-cubic multi-principal element alloys. Nat. Mater. 2023, 22, 950-7.
9. Juan, C.; Tsai, M.; Tsai, C.; et al. Simultaneously increasing the strength and ductility of a refractory high-entropy alloy via grain refining. Mater. Lett. 2016, 184, 200-3.
10. Chen, S.; Tseng, K.; Tong, Y.; et al. Grain growth and Hall-Petch relationship in a refractory HfNbTaZrTi high-entropy alloy. J. Alloys. Compd. 2019, 795, 19-26.
11. Brooke, R.; Zhang, D.; Qiu, D.; Gibson, M. A.; Easton, M. Compositional criteria to predict columnar to equiaxed transitions in metal additive manufacturing. Nat. Commun. 2025, 16, 5710.
12. Mendoza, M. Y.; Samimi, P.; Brice, D. A.; et al. Microstructures and grain refinement of additive-manufactured Ti-xW alloys. Metall. Mater. Trans. A. 2017, 48, 3594-605.
13. Wong, K.; Hsu, H.; Wu, S.; Ho, W. Structure and properties of Ti-rich Ti-Zr-Nb-Mo medium-entropy alloys. J. Alloys. Compd. 2021, 868, 159137.
14. Pang, J.; Zhang, H.; Zhang, L.; et al. A ductile Nb40Ti25Al15V10Ta5Hf3W2 refractory high entropy alloy with high specific strength for high-temperature applications. Mater. Sci. Eng. A. 2022, 831, 142290.
15. Zeng, J.; Yang, Y.; Peng, H.; et al. Additive manufacturing of high entropy shape memory alloy with outstanding properties through multi-remelting in-situ alloying. Addit. Manuf. 2024, 88, 104253.
16. Gu, D.; Shi, X.; Poprawe, R.; Bourell, D. L.; Setchi, R.; Zhu, J. Material-structure-performance integrated laser-metal additive manufacturing. Science 2021, 372, eabg1487.
17. Ren, J.; Zhang, Y.; Zhao, D.; et al. Strong yet ductile nanolamellar high-entropy alloys by additive manufacturing. Nature 2022, 608, 62-8.
18. Wang, H.; Dan, X.; Chao, Q.; et al. Impact of hierarchical martensitic structure on deformation twinning in titanium alloys during additive manufacturing. Microstructures 2026, 6, 2026047.
19. Tang, J.; Yu, Y.; Xiong, Z.; Liu, S.; Misra, R.; Jin, X. Thermally tailored cellular microstructure enhances ductility in additively manufactured maraging steel via austenite network reconstruction. Microstructures 2026, 6, 2026072.
20. Chesetti, A.; Banerjee, S.; Dasari, S.; et al. 3D printable low density B2+BCC refractory element based complex concentrated alloy with high compressive strength and plasticity. Scr. Mater. 2023, 225, 115160.
21. Zhang, Y.; Wang, H.; Zhu, Y.; et al. High specific yield strength and superior ductility of a lightweight refractory high-entropy alloy prepared by laser additive manufacturing. Additive. Manufacturing. 2023, 77, 103813.
22. Cui, D.; Guo, B.; Yang, Z.; et al. Unraveling microstructure and mechanical response of an additively manufactured refractory TiVHfNbMo high-entropy alloy. Additive. Manufacturing. 2024, 84, 104126.
23. Xiao, B.; Li, S.; Li, J.; et al. Superior strength-ductility synergy in TiZrNbVAl high entropy alloys via additive manufacturing. Acta. Mater. 2025, 298, 121389.
24. Senkov, O.; Scott, J.; Senkova, S.; Miracle, D.; Woodward, C. Microstructure and room temperature properties of a high-entropy TaNbHfZrTi alloy. J. Alloys. Compd. 2011, 509, 6043-8.
25. Li, C.; Chen, S.; Tang, H.; Zhang, J.; Liu, J.; Wu, Y. Dendrite structure-induced tunable plastic deformation behavior in (Ti-V-Cr)100-xWx refractory high entropy alloys. Int. J. Refract. Met. Hard. Mater. 2023, 116, 106329.
26. Wang, Z.; Wu, H.; Wu, Y.; et al. Solving oxygen embrittlement of refractory high-entropy alloy via grain boundary engineering. Mater. Today. 2022, 54, 83-9.
27. Bermingham, M.; Mcdonald, S.; Dargusch, M.; Stjohn, D. The mechanism of grain refinement of titanium by silicon. Scr. Mater. 2008, 58, 1050-3.
28. Wang, L.; Chen, S.; li, B.; et al. Lightweight Zr1.2V0.8NbTi Al high-entropy alloys with high tensile strength and ductility. Mater. Sci. Eng. A. 2021, 814, 141234.
29. Wang, S.; Xu, J. (TiZrNbTa)-Mo high-entropy alloys: dependence of microstructure and mechanical properties on Mo concentration and modeling of solid solution strengthening. Intermetallics 2018, 95, 59-72.
30. Sun, L.; Wang, L.; Zhao, K.; et al. Laser directed energy deposited Al0.8Nb0.5Ti2V2Zr0.5 lightweight refractory high entropy alloy: regionalization of microstructure characteristics and strengthening mechanisms. Mater. Sci. Eng. A. 2025, 922, 147610.
31. Zhang, D.; Qiu, D.; Gibson, M. A.; et al. Additive manufacturing of ultrafine-grained high-strength titanium alloys. Nature 2019, 576, 91-5.
32. Gäumann, M.; Bezençon, C.; Canalis, P.; Kurz, W. Single-crystal laser deposition of superalloys: processing-microstructure maps. Acta. Mater. 2001, 49, 1051-62.
33. Liang, Y.; Cheng, X.; Wang, H. A new microsegregation model for rapid solidification multicomponent alloys and its application to single-crystal nickel-base superalloys of laser rapid directional solidification. Acta. Mater. 2016, 118, 17-27.
34. Gao, S.; Li, Z.; Van, Petegem. S.; et al. Additive manufacturing of alloys with programmable microstructure and properties. Nat. Commun. 2023, 14, 6752.
35. Meng, L.; Mcwilliams, B.; Jarosinski, W.; et al. Machine learning in additive manufacturing: a review. JOM 2020, 72, 2363-77.
36. He, J.; Li, Z.; Lin, J.; et al. Machine learning-assisted design of refractory high-entropy alloys with targeted yield strength and fracture strain. Mater. Des. 2024, 246, 113326.
37. Gao, T.; Gao, J.; Yang, S.; Zhang, L. Data-driven design of novel lightweight refractory high-entropy alloys with superb hardness and corrosion resistance. npj. Comput. Mater. 2024, 10, 1457.
38. Herzog, T.; Brandt, M.; Trinchi, A.; Sola, A.; Molotnikov, A. Process monitoring and machine learning for defect detection in laser-based metal additive manufacturing. J. Intell. Manuf. 2024, 35, 1407-37.
39. Guo, S.; Agarwal, M.; Cooper, C.; et al. Machine learning for metal additive manufacturing: Towards a physics-informed data-driven paradigm. J. Manuf. Syst. 2022, 62, 145-63.
40. Su, J.; Chen, L.; Van, Petegem. S.; et al. Additive manufacturing metallurgy guided machine learning design of versatile alloys. Mater. Today. 2025, 88, 240-50.
41. Ng, W. L.; Goh, G. L.; Goh, G. D.; Ten, J. S. J.; Yeong, W. Y. Progress and opportunities for machine learning in materials and processes of additive manufacturing. Adv. Mater. 2024, 36, e2310006.
42. He, L.; Wang, C.; Zhang, M.; Li, J.; Chen, T.; Zhou, X. Design of BCC/FCC dual-solid solution refractory high-entropy alloys through CALPHAD, machine learning and experimental methods. npj. Comput. Mater. 2025, 11, 1597.
43. Sheikh, S.; Vela, B.; Honarmandi, P.; et al. High-throughput alloy and process design for metal additive manufacturing. npj. Comput. Mater. 2025, 11, 179.
44. Ganesan, M.; Dye, D.; Lee, P. D. A technique for characterizing microsegregation in multicomponent alloys and its application to single-crystal superalloy castings. Metall. Mater. Trans. A. 2005, 36, 2191-204.
45. Kurz, W.; Fisher, D.J. Fundamentals of Solidification, 4th ed.; Trans Tech Publications, Switzerland, 1998.
46. Kurz, W. Solidification microstructure-processing maps: theory and application. Adv. Eng. Mater. 2001, 3, 443-52.
47. Sheikh, S.; Shafeie, S.; Hu, Q.; et al. Alloy design for intrinsically ductile refractory high-entropy alloys. J. Appl. Phys. 2016, 120, 164902.
48. Qi, L.; Chrzan, D. C. Tuning ideal tensile strengths and intrinsic ductility of bcc refractory alloys. Phys. Rev. Lett. 2014, 112, 115503.
49. Deb, K. Multi-objective optimization using evolutionary algorithms, 1th ed.; John Wiley & Sons, Chichester, England, 2001. https://www.wiley-vch.de/en/areas-interest/mathematics-statistics/multi-objective-optimization-using-evolutionary-algorithms-978-0-471-87339-6 (accessed 2026-09-30).
50. Hunt, J. Steady state columnar and equiaxed growth of dendrites and eutectic. Mater. Sci. Eng. 1984, 65, 75-83.
51. Nartu, M. S. K. K. Y.; Welk, B. A.; Mantri, S. A.; et al. Underlying factors determining grain morphologies in high-strength titanium alloys processed by additive manufacturing. Nat. Commun. 2023, 14, 3288.
52. Shukla, S.; Choudhuri, D.; Wang, T.; et al. Hierarchical features infused heterogeneous grain structure for extraordinary strength-ductility synergy. Mater. Res. Lett. 2018, 6, 676-82.
53. Bu, Y.; Wu, Y.; Lei, Z.; et al. Local chemical fluctuation mediated ductility in body-centered-cubic high-entropy alloys. Mater. Today. 2021, 46, 28-34.
54. Lee, C.; Chou, Y.; Kim, G.; et al. Lattice-distortion-enhanced yield strength in a refractory high-entropy alloy. Adv. Mater. 2020, 32, e2004029.
55. Gou, S.; Gao, M.; Shi, Y.; et al. Additive manufacturing of ductile refractory high-entropy alloys via phase engineering. Acta. Mater. 2023, 248, 118781.
56. He, Q.; Yoshida, S.; Tsuji, N. Characteristic strengthening mechanisms in body-centered cubic refractory high/medium entropy alloys. Scr. Mater. 2023, 231, 115442.
57. Sun, Y.; Chen, P.; Liu, L.; et al. Local mechanical properties of Al CoCrCuFeNi high entropy alloy characterized using nanoindentation. Intermetallics 2018, 93, 85-8.
58. Zeng, S.; Zhou, Y.; Gao, H.; et al. Novel as-cast Ti-rich refractory complex concentrated alloys with superior tensile properties. Sci. China. Mater. 2024, 67, 311-20.
59. Toda-caraballo, I.; Rivera-díaz-del-castillo, P. E. Modelling solid solution hardening in high entropy alloys. Acta. Mater. 2015, 85, 14-23.
60. Wang, H.; Chen, W.; Lu, Y.; et al. Achieving high tensile ductility in a mechanically-stable lightweight refractory high-entropy alloy via dynamic slip band refinement. Mater. Sci. Eng. A. 2024, 900, 146513.
61. An, Z.; Li, A.; Mao, S.; et al. Negative mixing enthalpy solid solutions deliver high strength and ductility. Nature 2024, 625, 697-702.
62. Lei, Z.; Liu, X.; Wu, Y.; et al. Enhanced strength and ductility in a high-entropy alloy via ordered oxygen complexes. Nature 2018, 563, 546-50.
Cite This Article
 Open Access
How to Cite
Liu, S.; Wang, Y.; Liang, Y.J.; Xue, Y. Machine-learning optimization of microstructure and mechanical properties in 3D-printed W-alloyed refractory high-entropy alloys. Microstructures 2026, 6, 20260132. https://dx.doi.org/10.20517/microstructures.2026.155
Download Citation
Export Citation File:
Type of Import
Tips on Downloading Citation
Citation Manager File Format
Type of Import
Direct Import: When the Direct Import option is selected (the default state), a dialogue box will give you the option to Save or Open the downloaded citation data. Choosing Open will either launch your citation manager or give you a choice of applications with which to use the metadata. The Save option saves the file locally for later use.
Indirect Import: When the Indirect Import option is selected, the metadata is displayed and may be copied and pasted as needed.
About This Article
Copyright

Data & Comments
Data
0







Comments
Comments must be written in English. Spam, offensive content, impersonation, and private information will not be permitted. If any comment is reported and identified as inappropriate content by OAE staff, the comment will be removed without notice. If you have any queries or need any help, please contact us at support@oaepublish.com.