




fig4
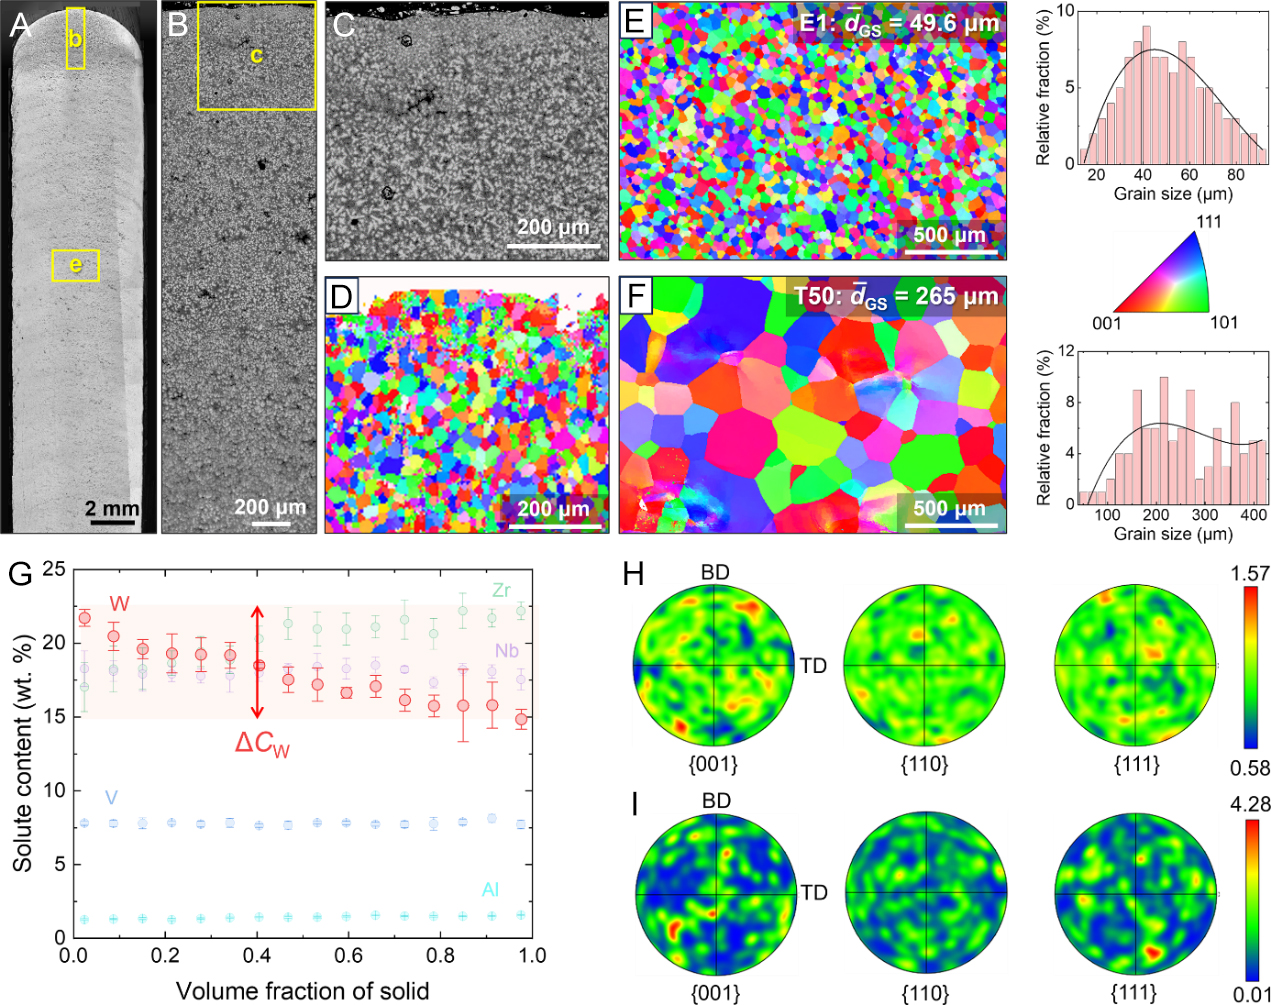
Figure 4. Microstructure and elemental distribution of the LMD E1 and T50. (A) OM image showing the grain morphology of E1; (B) SEM-BSE image showing the microstructural evolution within the last several layers; (C and D) SEM-BSE image and EBSD inverse pole figure showing the dendrite and grain morphology, respectively, at the sample top, marked by a yellow box in (B); (E and F) EBSD inverse pole figures showing the grain morphology and grain size distribution in the main body of the LMD E1 and T50, respectively; (G) Distribution of elements with increasing solid fraction in E1 during solidification; (H and I) EBSD pole figures showing the texture in the main body of the LMD E1 and T50 alloys, respectively. LMD: Laser metal deposition; OM: optical microscope; SEM: scanning electron microscope; BSE: back-scattered electron; EBSD: electron backscatter diffraction; BD: building direction; TD: transverse direction.