




fig6
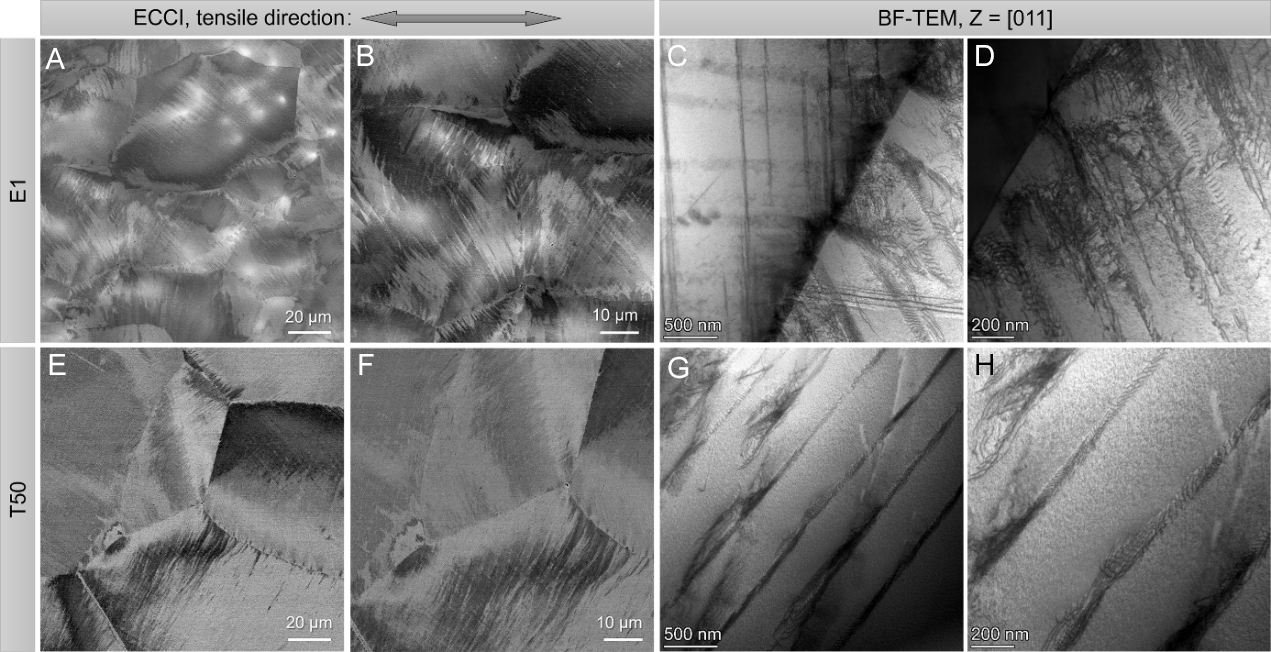
Figure 6. Slip trace and dislocation configuration analyses of the E1 and T50 alloys at 10% strain. (A and B) ECCI analysis showing intersected slip lines with a high density in E1; (C and D) BF-TEM image showing a multiple-slip characteristic in E1; (E and F) ECCI analysis showing a low density of slip lines in T50; (G and H) BF-TEM images showing deformation dominated by planar slip in T50. ECCI: Electron channeling contrast imaging; BF-TEM: bright-field TEM; TEM: transmission electron microscope.