



Figure4
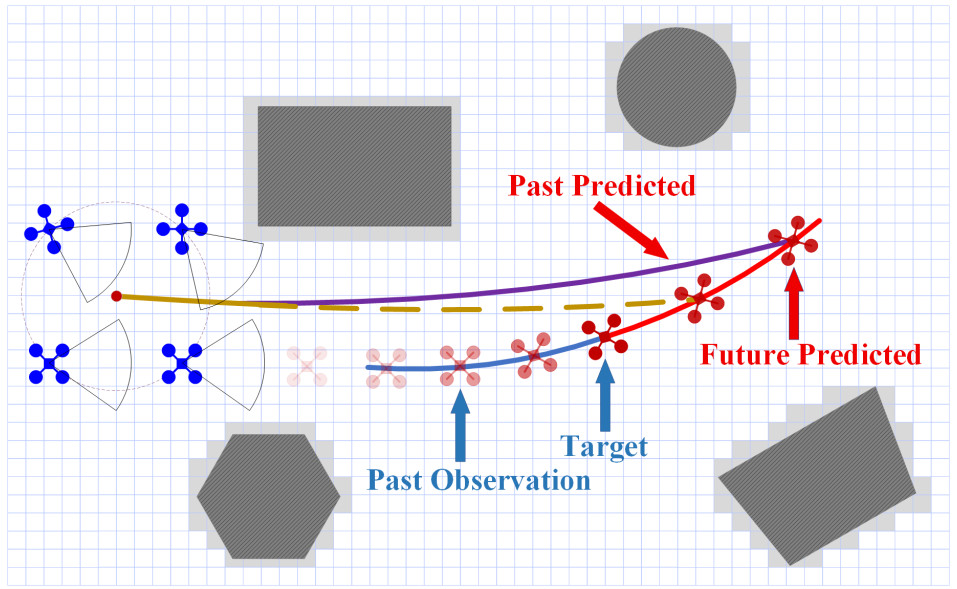
Figure 4. Trajectory prediction: the red dot on the left side of the picture represents the center of mass of the drone swarm, which is the center for surrounding and capturing the target. The blue curve represents the historical trajectory of the target, and the trajectory is predicted based on the first L historical observations. The red curve represents the expected trajectory. The brown curve represents the target prediction of the previous frame, while the purple curve represents the target prediction of the current frame. By piecing these trajectories together, the central point of the real-time captured trajectory is formed.