




fig4
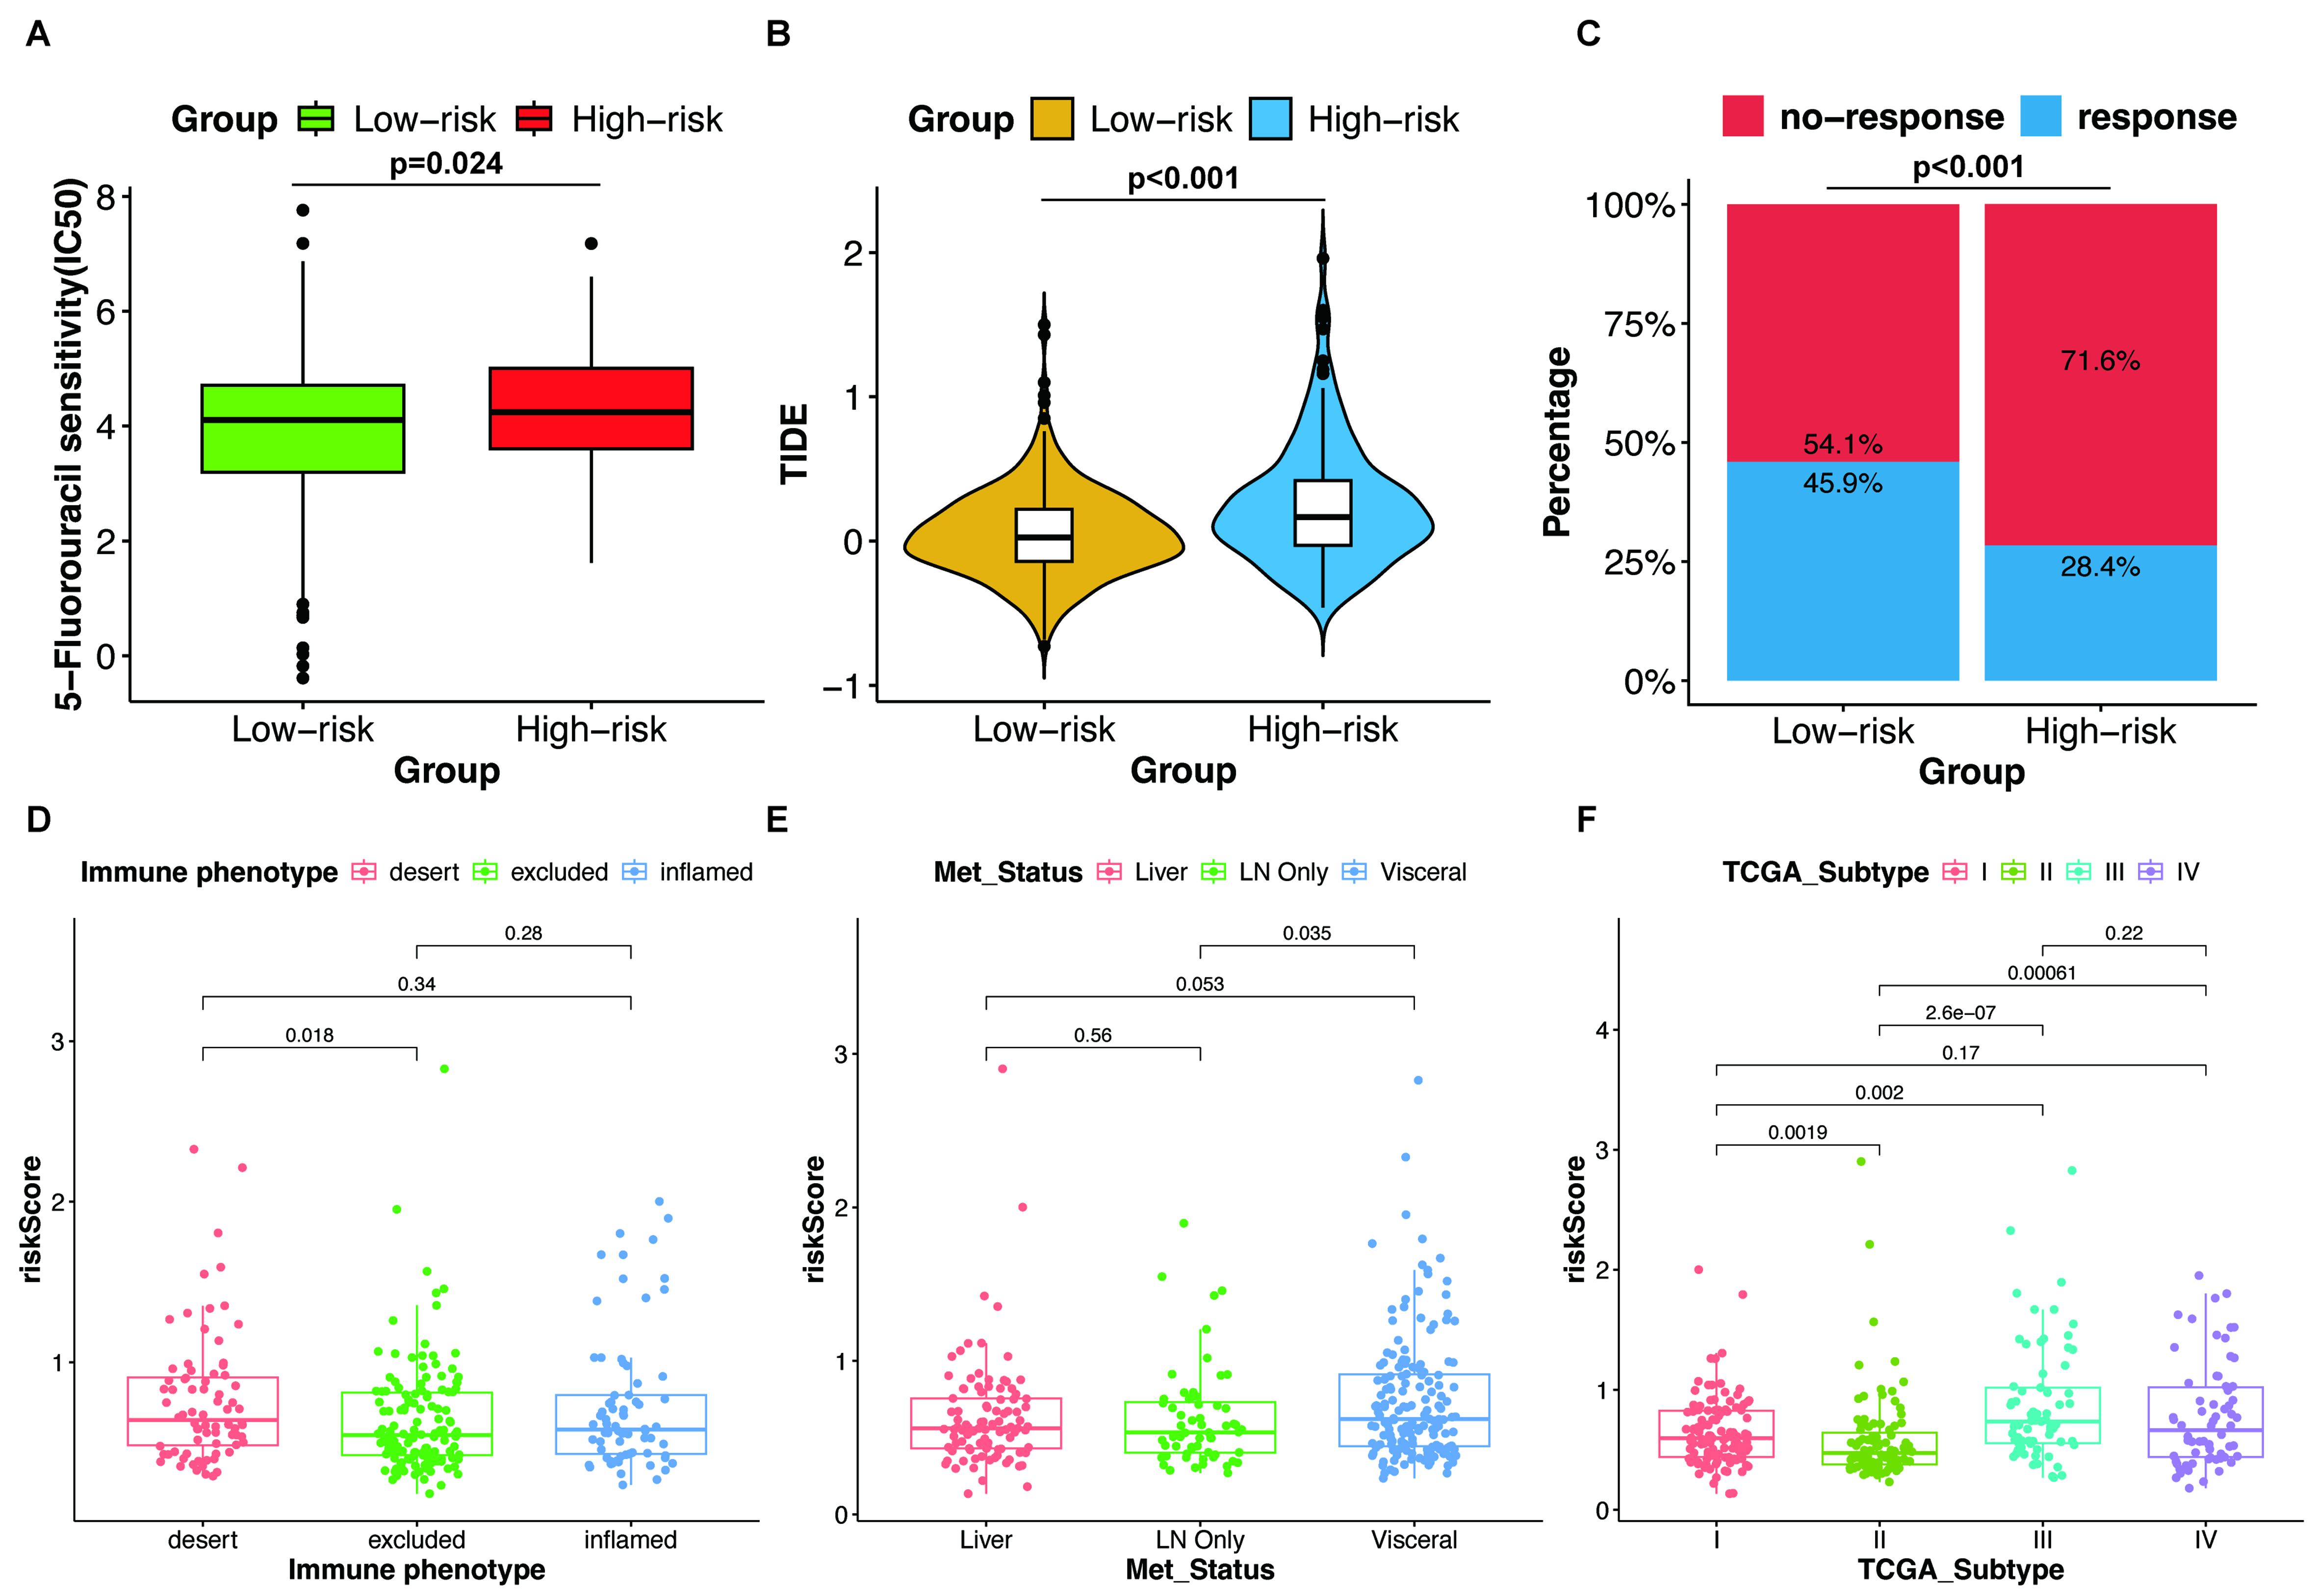
Figure 4. Analysis of tumor immune microenvironment features and drug susceptibility across distinct risk subgroups. (A) Differential therapeutic responses to 5-FU treatment between high-risk and low-risk groups; (B) Quantitative comparison of TIDE scores between the two risk subgroups; (C) The fraction of patients with immunotherapy response in two groups; (D-F) Associations of the risk score with the immune phenotype, metastatic state, and TCGA subtype, respectively. For (A, B, D-F), statistical significance was assessed using two-sided Wilcoxon rank-sum tests. For (C), the difference in response proportions between the two groups was evaluated using Pearson’s Chi-square test. 5-FU: 5-Fluorouracil; TIDE: tumor immune dysfunction and exclusion; TCGA: the Cancer Genome Atlas.





