fig4

Distinct adaptive strategies to cisplatin, vinblastine and gemcitabine in a panel of chemoresistant bladder cancer cell lines

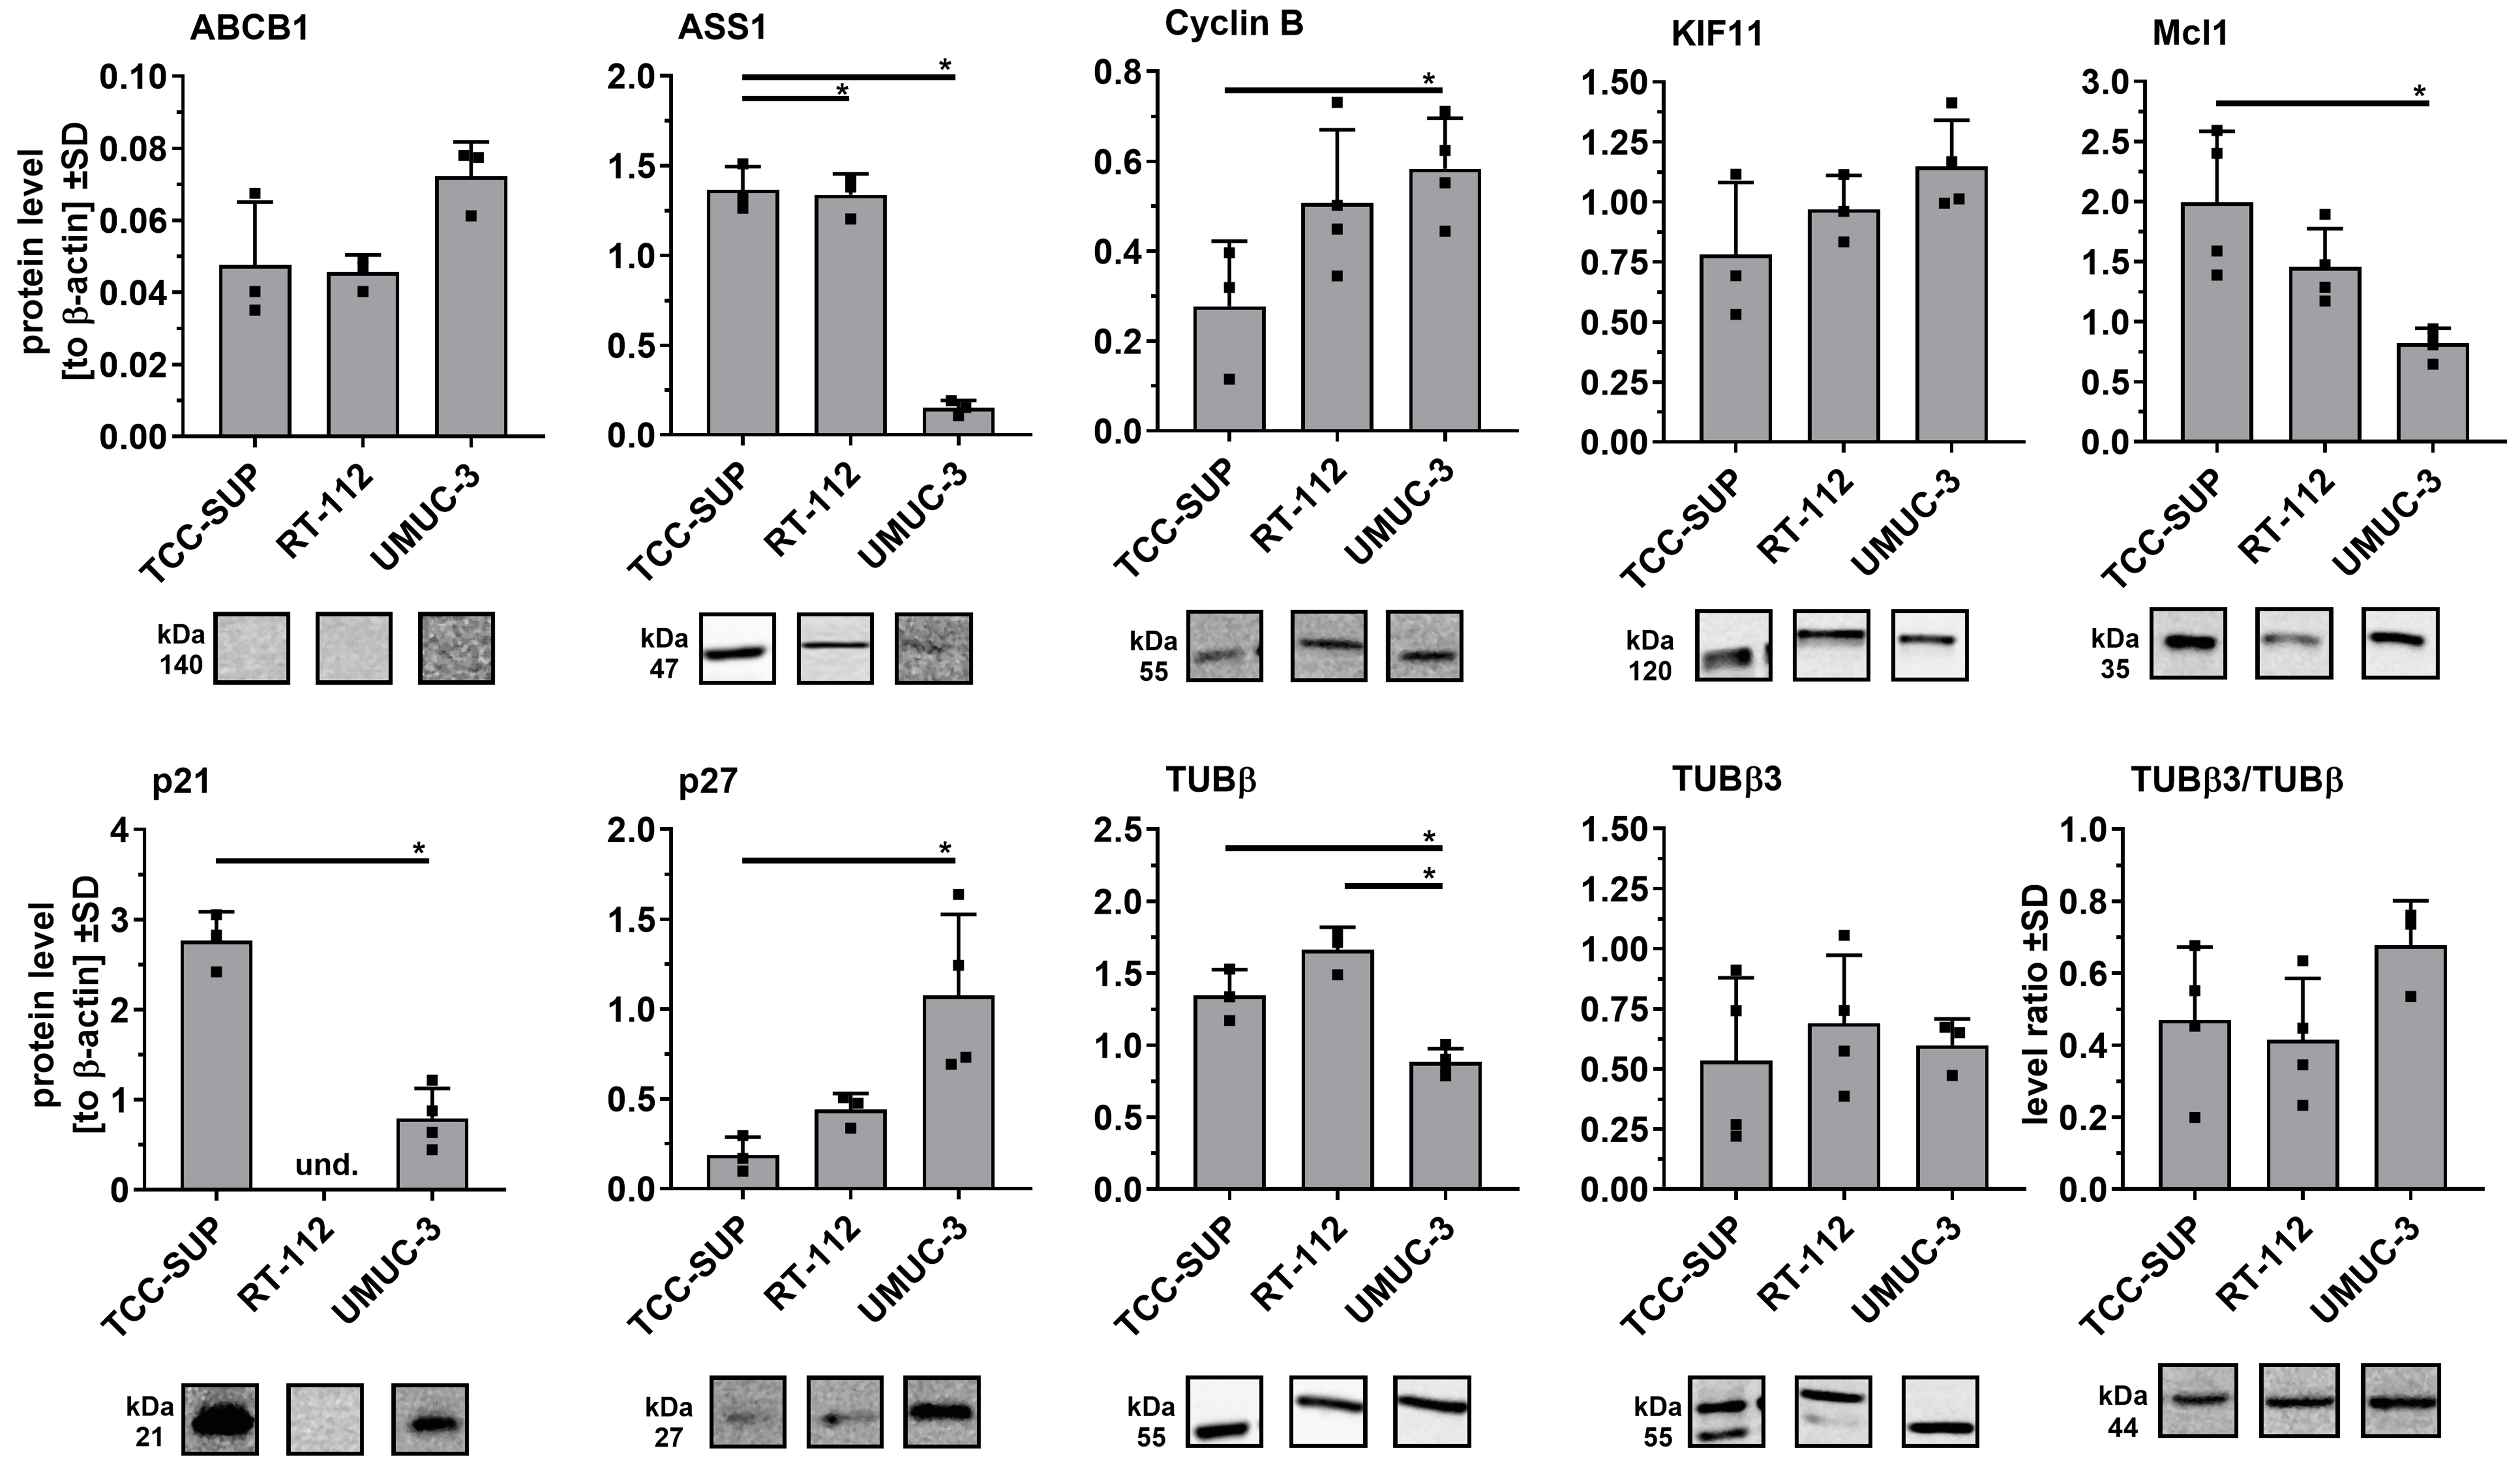
Figure 4. Comparison of selected protein levels in parental cell lines using Western blot analysis. Densitometric values for each protein (n = 3-4) were normalized to β-actin and presented as mean ± SD, with ▪ symbols indicating raw values. *P < 0.05, one-way ANOVA with Tukey’s post-hoc test for multiple comparisons (except p21 results, analyzed by two-tailed t-test); und: undetectable. SD: Standard deviation; ANOVA: analysis of variance.

Cancer Drug Resistance
ISSN 2578-532X (Online)

Portico

All published articles will preserved here permanently:

https://www.portico.org/publishers/oae/

Portico

All published articles will preserved here permanently:

https://www.portico.org/publishers/oae/