


fig1
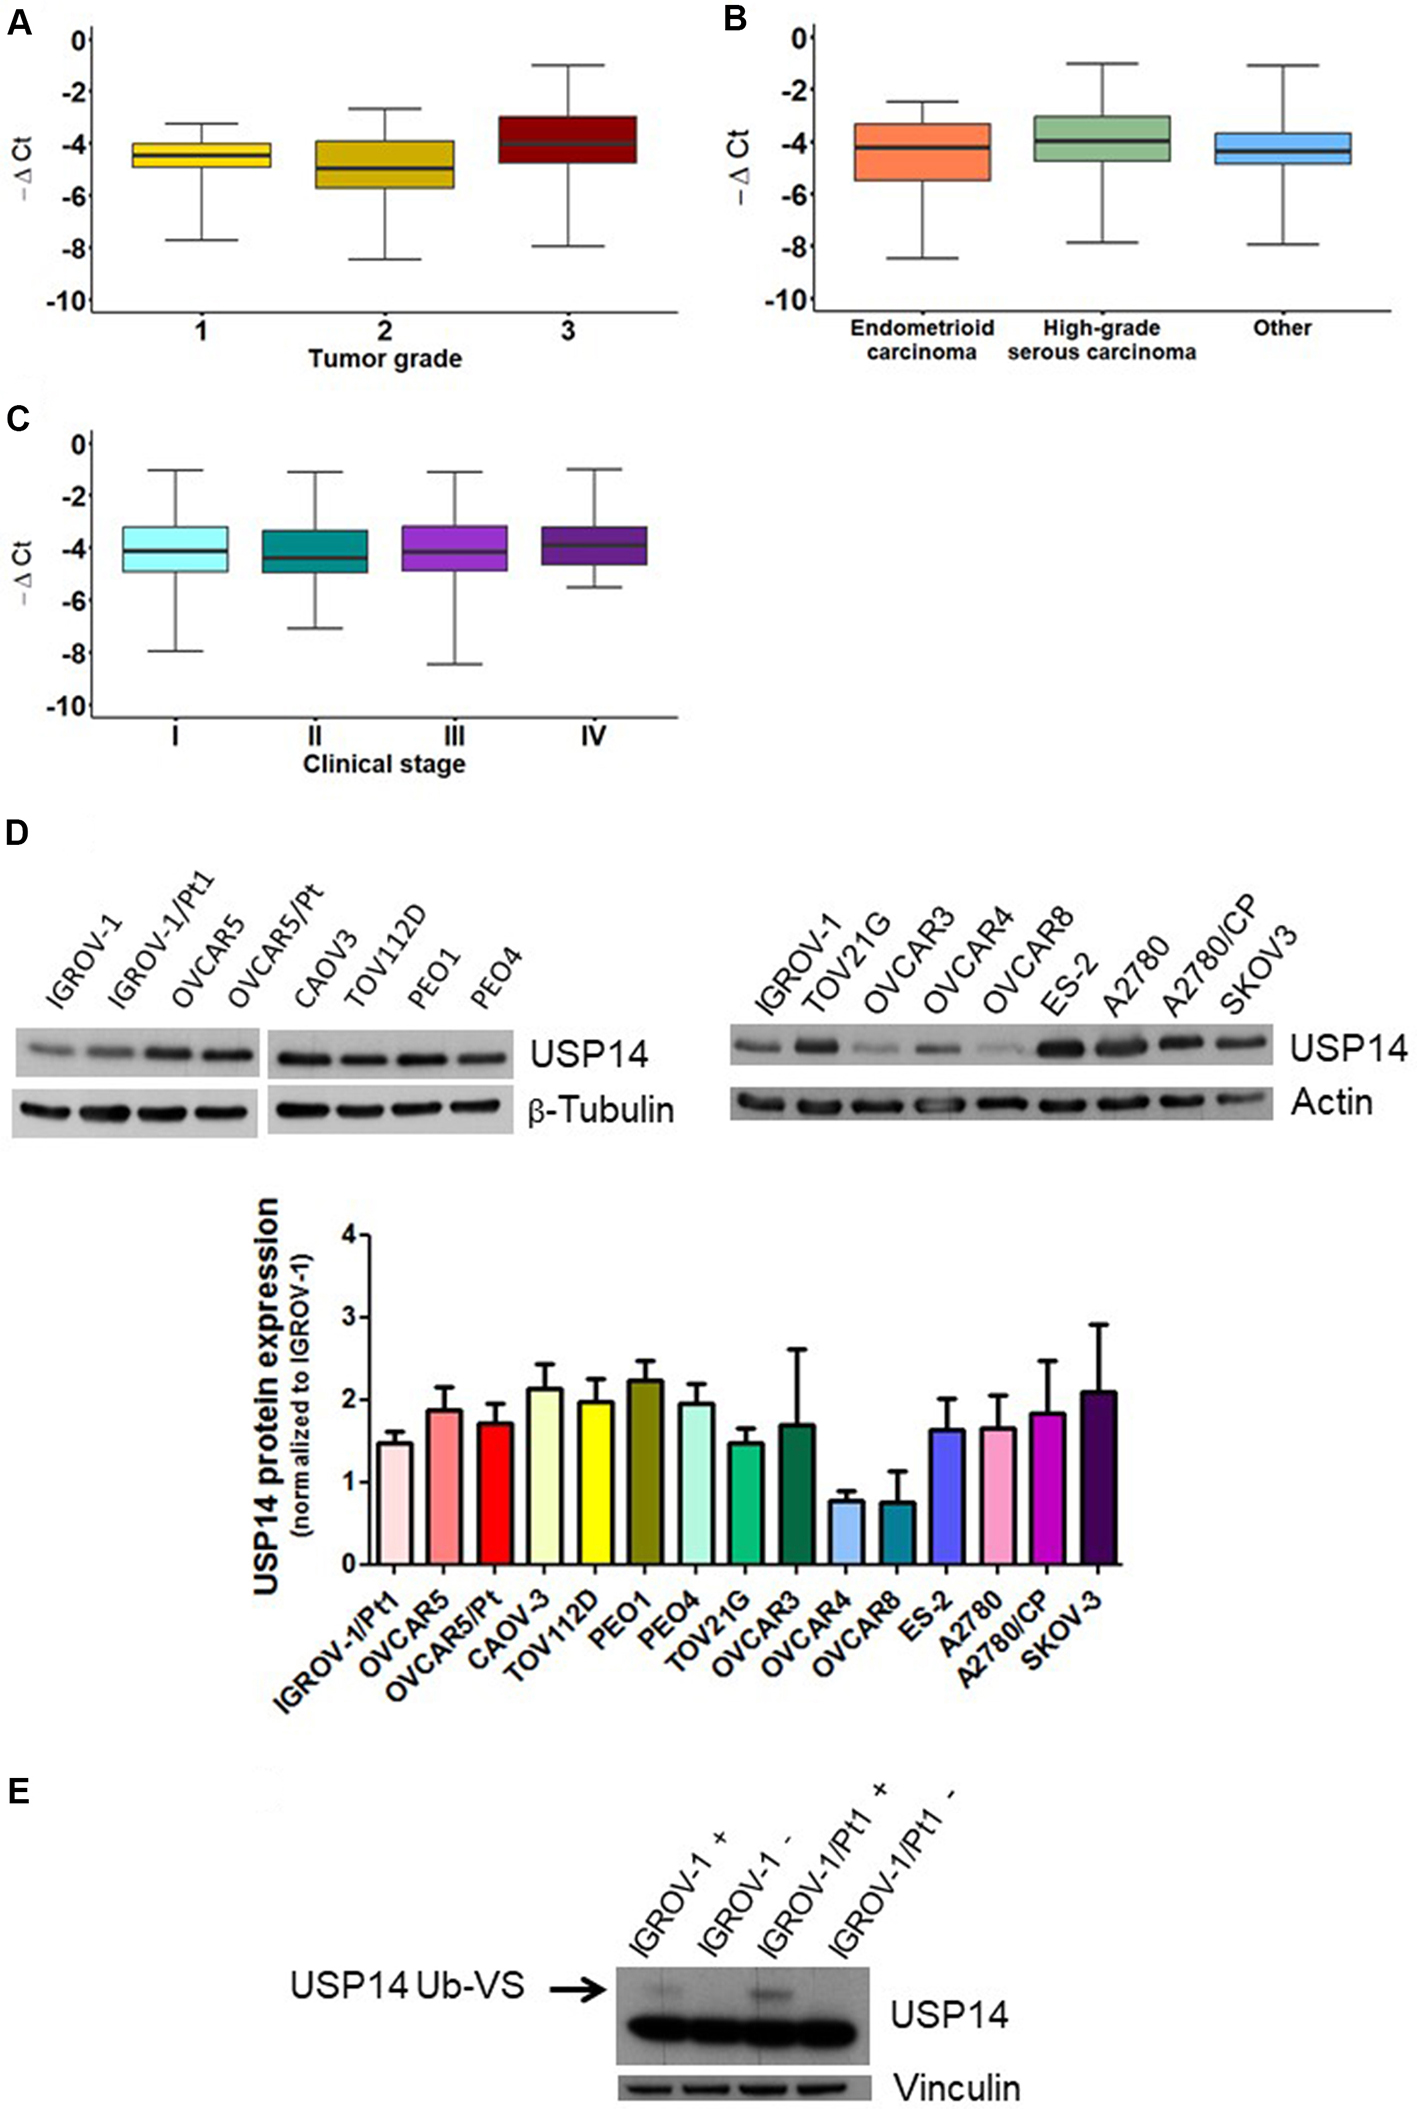
Figure 1. Relative expression of USP14 in ovarian carcinoma patients and USP14 protein expression and activity in different ovarian carcinoma cell lines. Box plots show USP14 expression according to (A) tumor grade, (B) diagnosis, and (C) stage. Each box represents the 25th-75th percentile range, with the horizontal line indicating the median and whiskers showing the extreme values; (D) Western blot analysis of USP14 protein expression in various ovarian carcinoma cell lines and their resistant variants. Actin or β-tubulin served as loading controls. Band intensities were quantified using ImageJ, normalized to the loading control, and expressed relative to IGROV-1. The histogram below reports mean ± standard deviation (SD) from three technical replicates; (E) USP14 activity in IGROV-1 and IGROV-1/Pt1 cells. Deubiquitinase labeling with HA-Ub-VS was followed by SDS-PAGE and immunoblotting with USP14. +, samples incubated with HA-Ub-VS; -, samples incubated without HA-Ub-VS. Vinculin served as loading control; the active band is indicated by the arrow. USP14: Ubiquitin-specific protease 14; HA-Ub-VS: hemagglutinin-ubiquitin-vinyl sulfone.


