


fig4
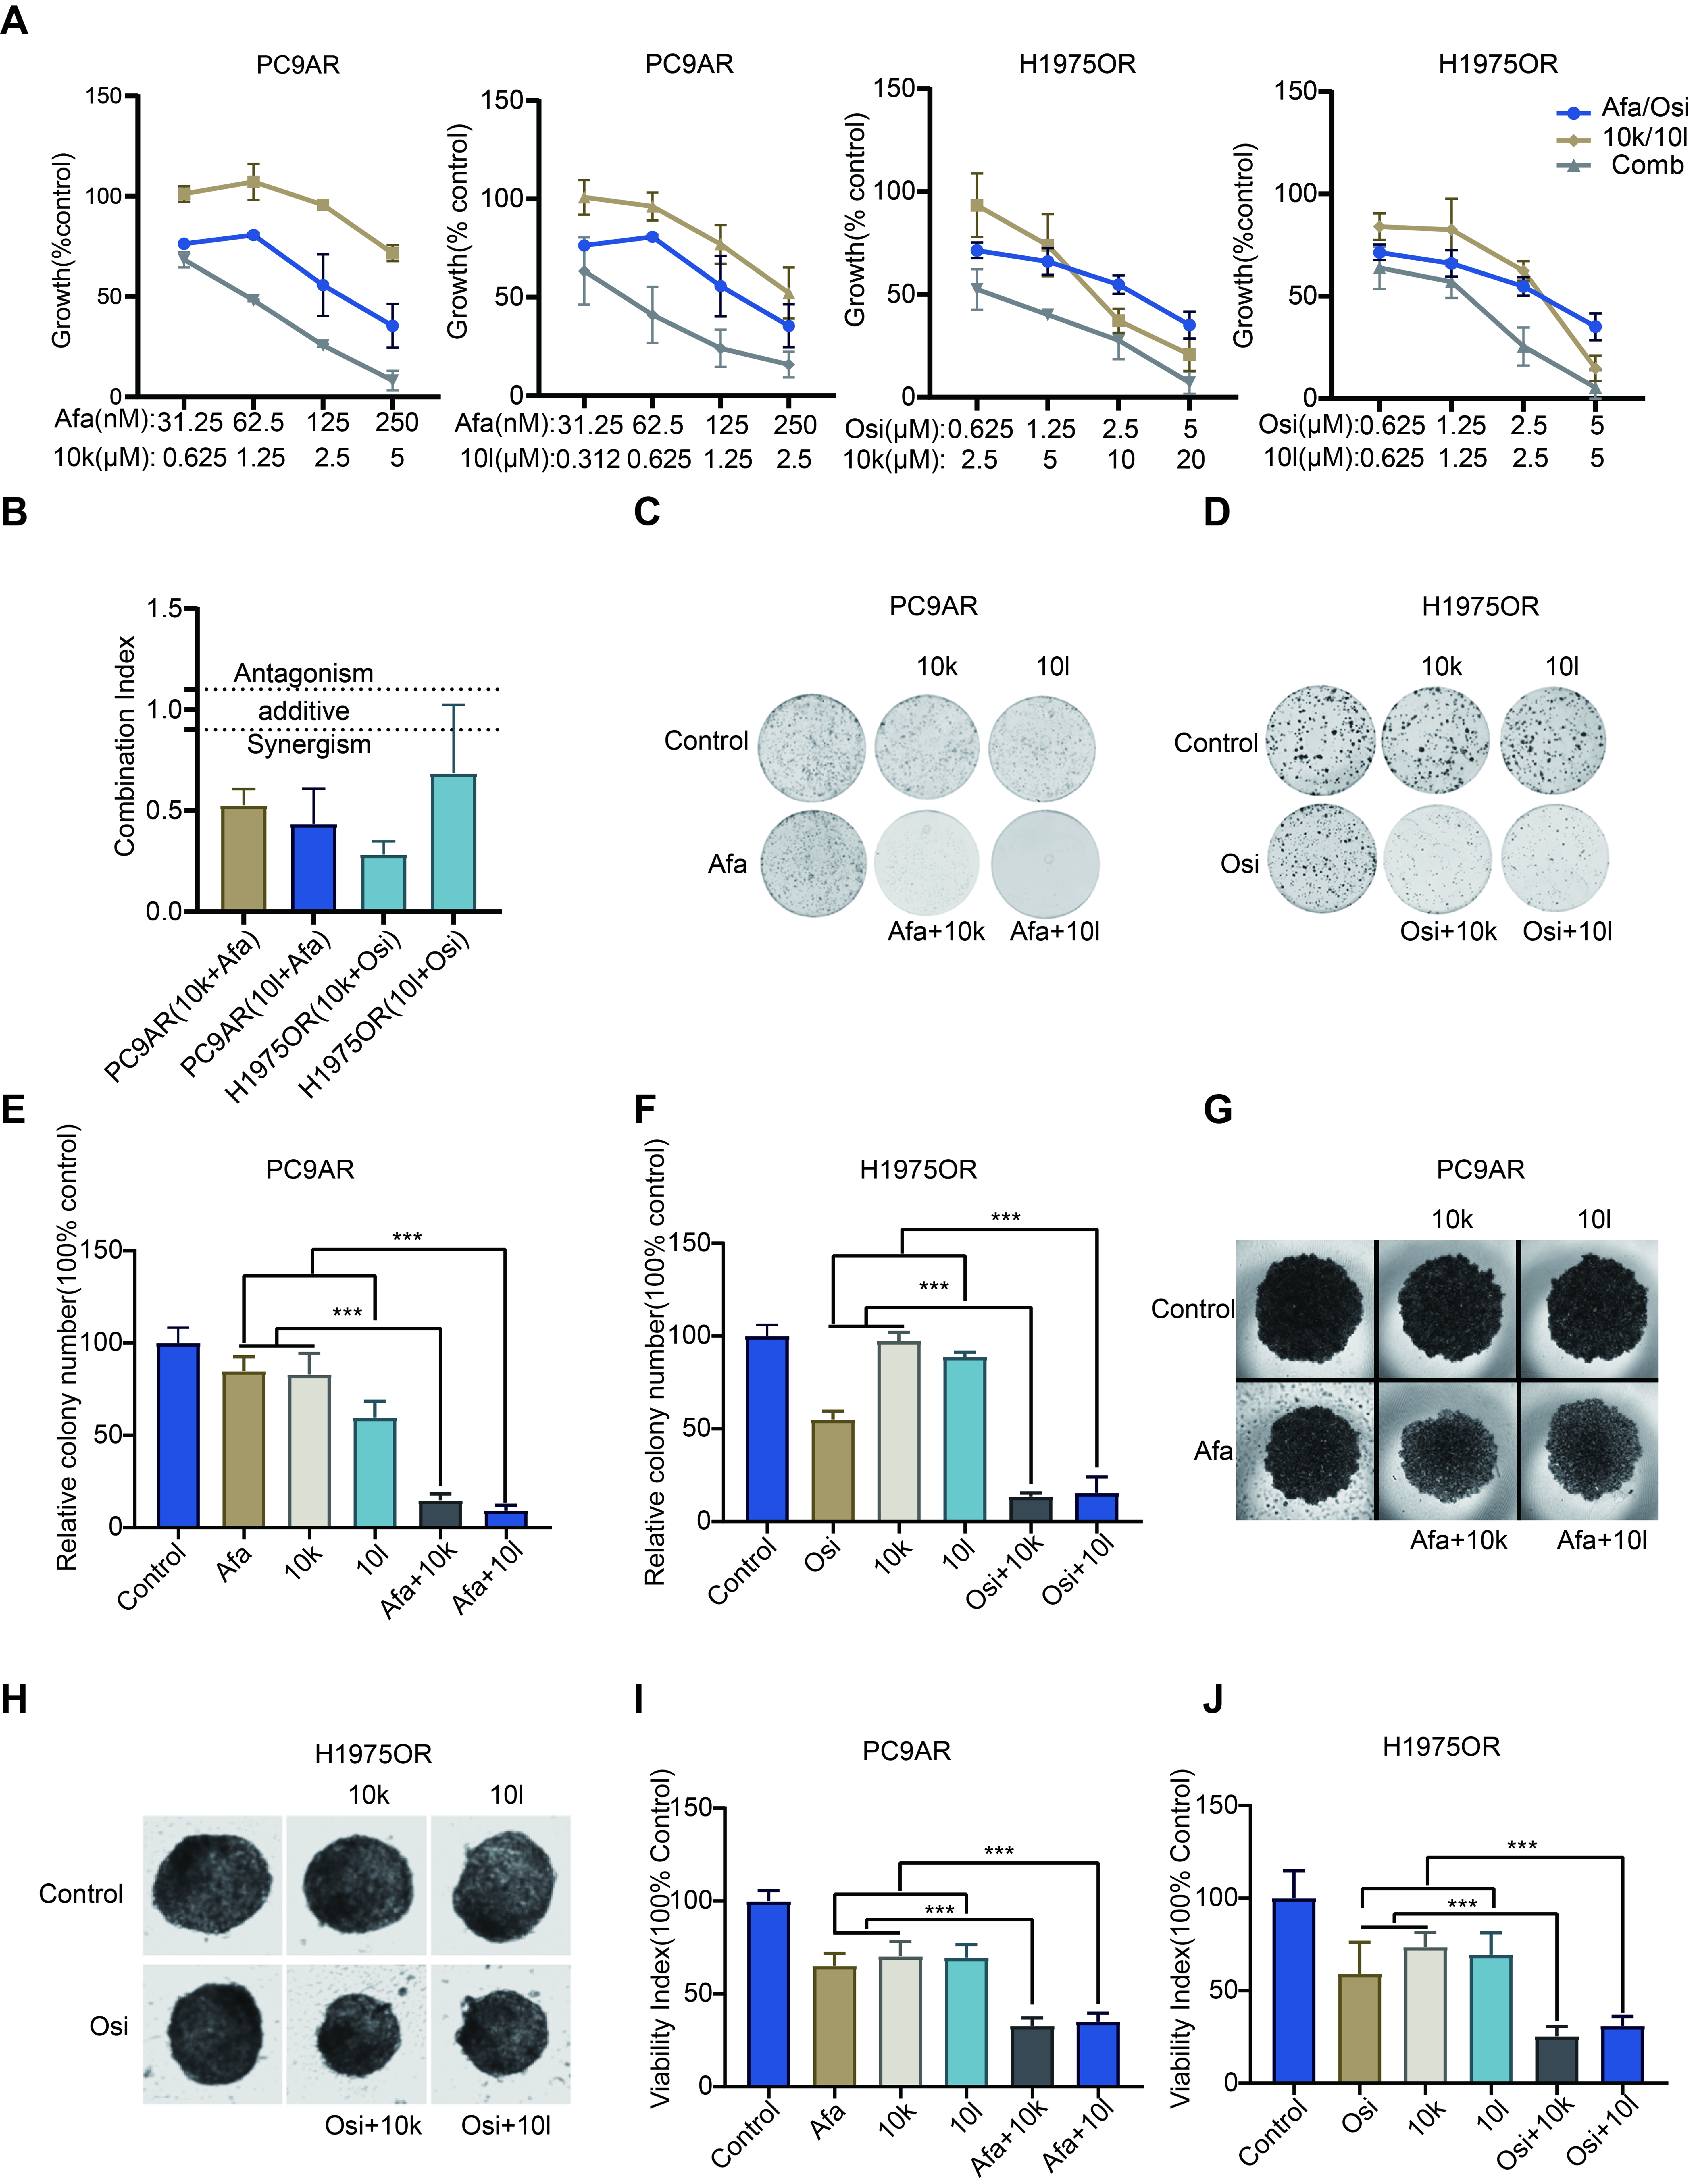
Figure 4. The new FAK inhibitors 10k and 10l enhance EGFR-TKI sensitivity in drug resistant cells. (A) PC9AR and H1975OR cells were treated with the indicated concentrations of the tested drugs, either alone or in combination, and growth rates were measured using the SRB assay after 72 h. The compounds 10k and 10l treated the same cell line in one experiment; (B) CIs at 50 %, 75%, and 90% values of fraction affected revealed a synergistic interaction between the drugs; (C and D) PC9AR and H1975OR cells were plated in 6-well plates (1 × 10³ cells/well) and treated for 10 days with indicated compounds. Representative images of colony formation are shown; (E and F) Quantitative analysis of colony formation results. PC9AR cells: treated with Afatinib, 10k, 10l at 0.125 × IC50 (PC9AR cells) or combination, H1975OR cells: treated with Osimertinib, 10k, 10l at 0.125 × IC50 (H1975OR cells) or combination; (G and H) Spheroids generated from PC9AR and H1975OR cells were treated for 4 days with indicated compounds. PC9AR cells: treated with Afatinib at 0.125 × IC50 (PC9AR cells) and 10k or 10l at 1.5 × IC50 (PC9AR cells) or combination, H1975OR cells: treated with Osimertinib at 0.125 × IC50 (H1975OR cells) and 10k, 10l at 1 × IC50 (H1975OR cells) or combination. Representative images of spheroids are shown; (I and J) Viability of spheroids was assessed using the resazurin assay. Statistical significance was set as follows: ***P < 0.001. The graphs were created with GraphPad Prism. FAK: Focal adhesion kinase; EGFR: epidermal growth factor receptor; TKI: tyrosine kinase inhibitor; PC9AR: PC9 Afatinib resistant; H1975OR: H1975 Osimertinib resistant; SRB: sulforhodamine B; CIs: combination indices; IC50: half-maximal inhibitory concentration; Afa: Afatinib; Osi: Osimertinib.


