


A ferroptosis-based gene signature for relapse prediction in prostate adenocarcinoma
 0
0 Abstract
Aim: This study focused on developing a prognostic index model associated with ferroptosis for predicting prostate cancer (PCa) relapse and progression. The aim was to enhance clinical decision making and improve immunotherapy strategies for PCa patients, ultimately leading to better patient outcomes.
Methods: The study employed the least absolute shrinkage and selection operator to develop the Ferroptosis-related gene (FRG) prognostic index model. This model's predictive power was validated across multiple PCa datasets, and its correlation with clinicopathological factors was investigated. Kyoto Encyclopedia of Genes and Genomes pathway and Gene Ontology analyses were conducted to identify associated signaling pathways. Furthermore, the CIBERSORT algorithm was used to assess PCa patient outcomes based on the combination of the FRGs risk index and immune cell infiltration patterns.
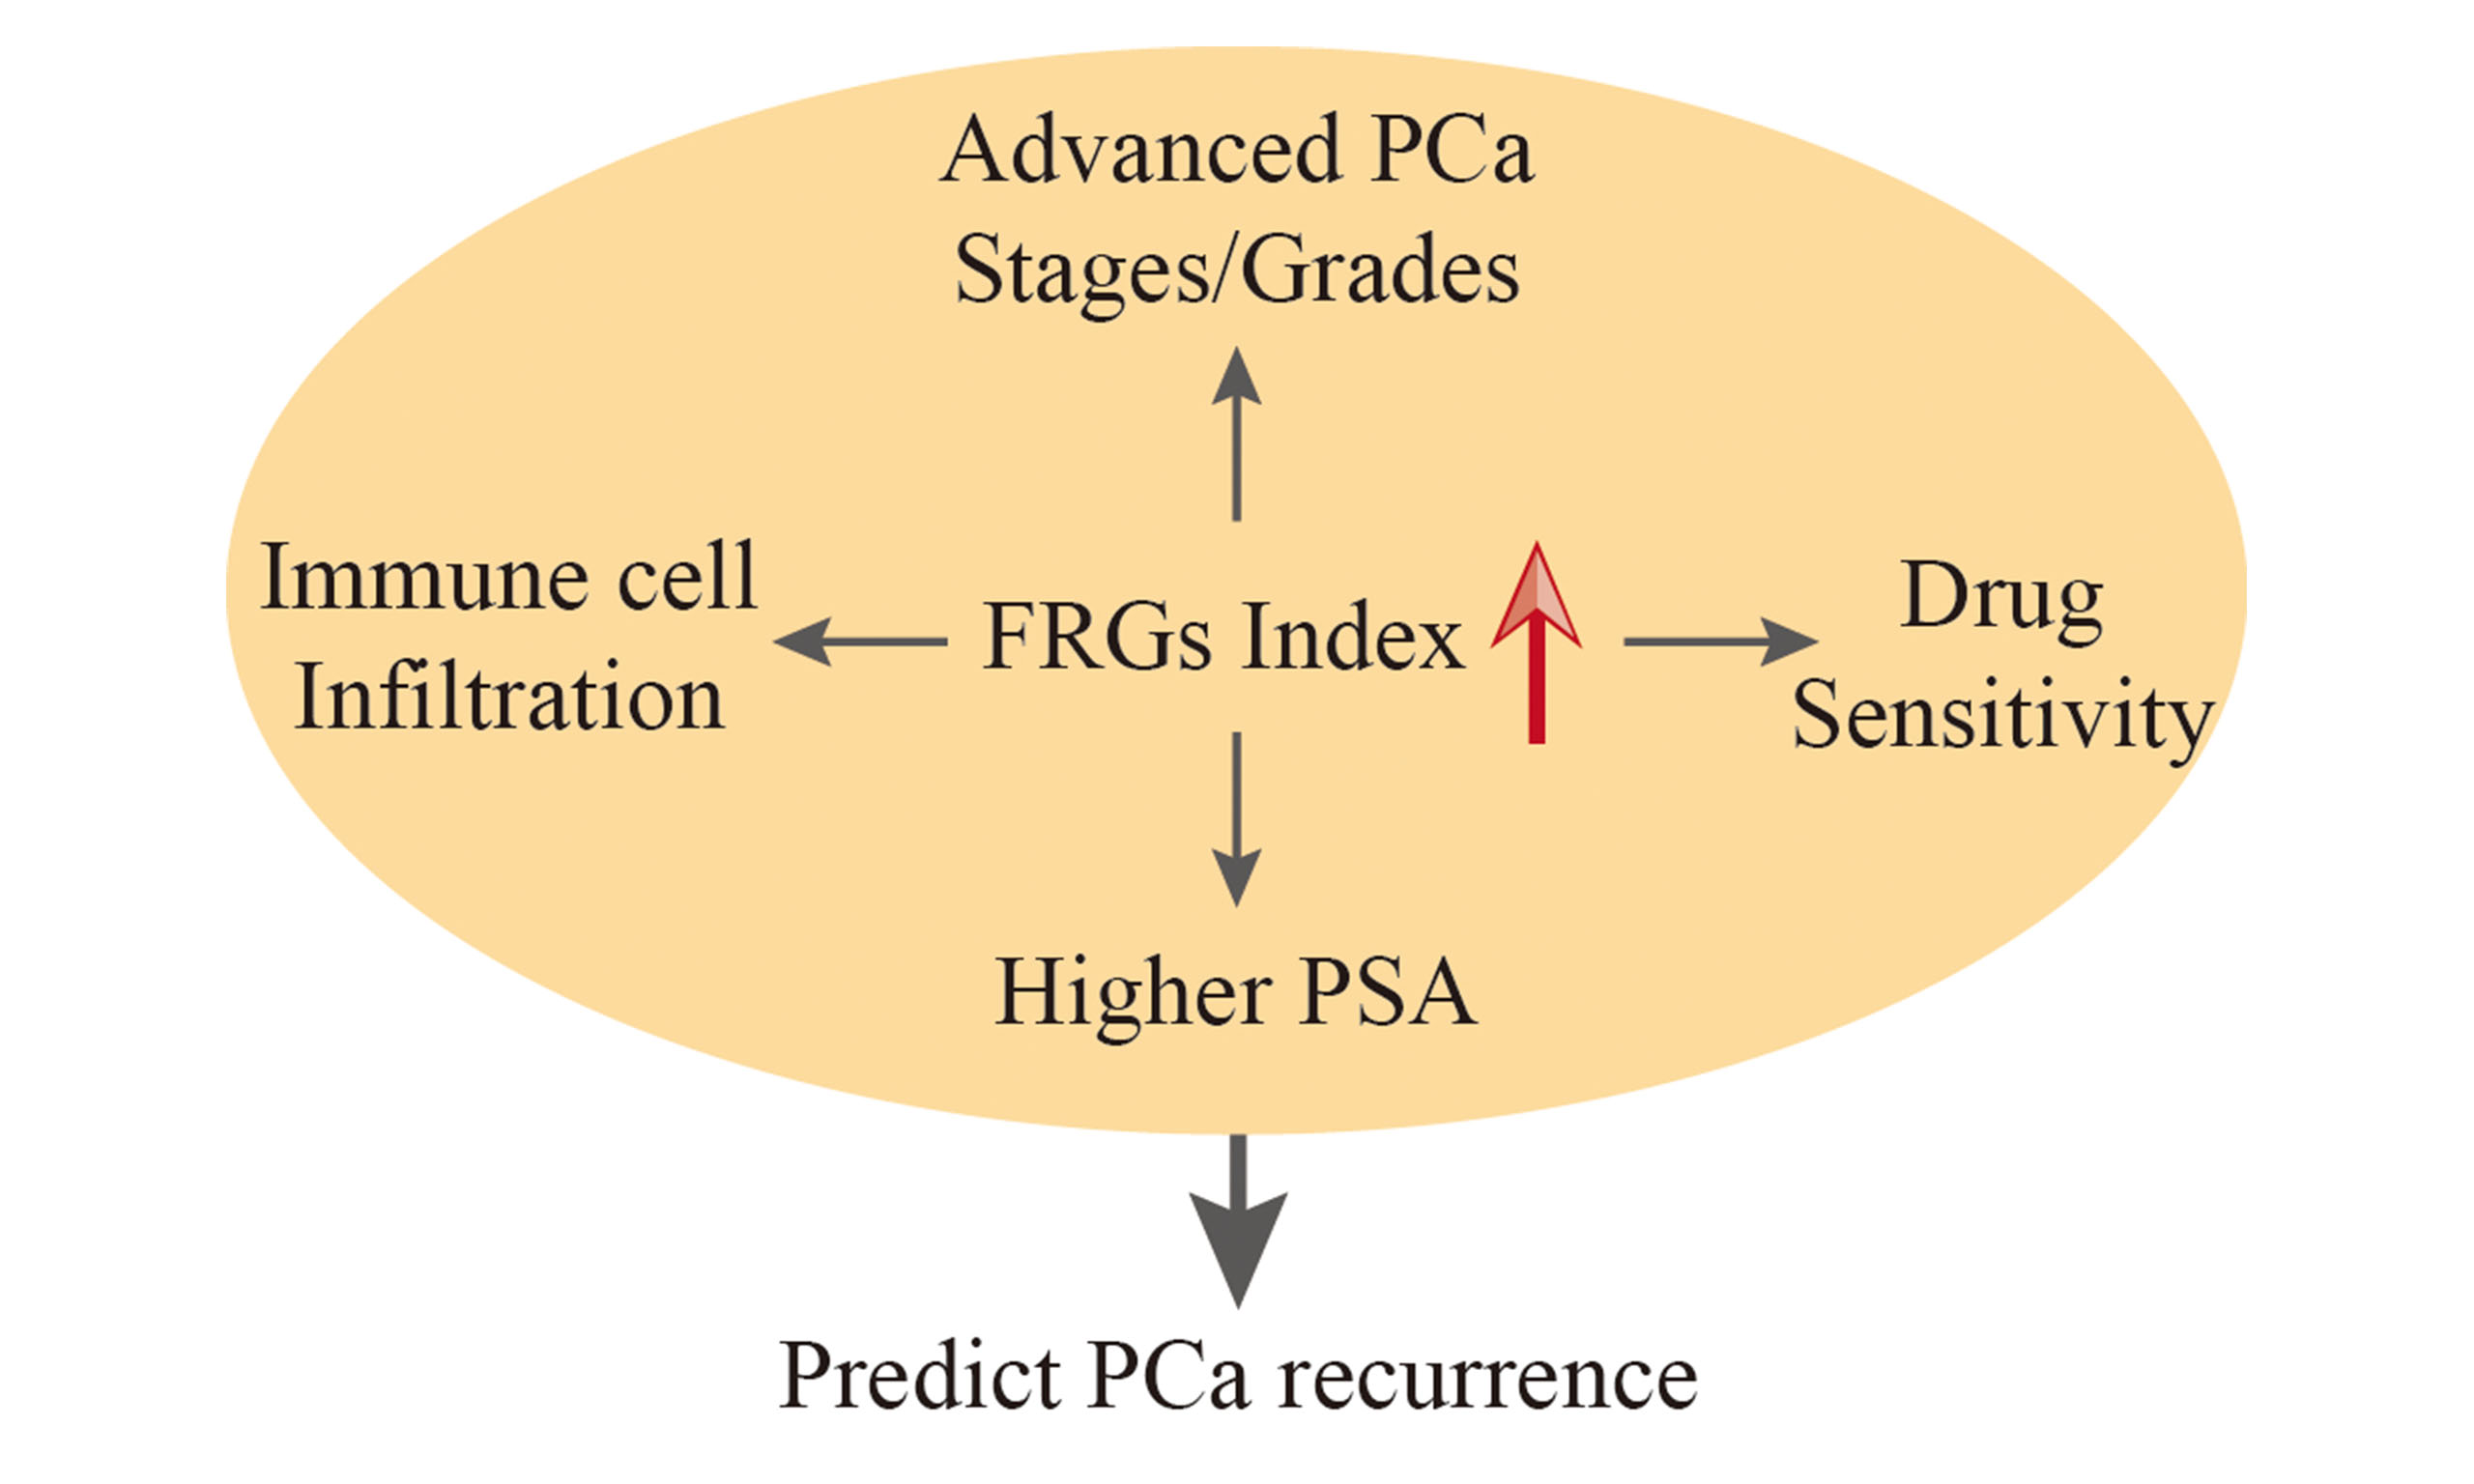
Results: The FRG index model emerged as an independent predictor of PCa recurrence. It correlated with advanced pathological stages, higher prostate-specific antigen levels, and higher tumor grades. Notably, the FRG index was significantly associated with immune cell infiltration, particularly activated mast cells, which are crucial in PCa recurrence and progression. Furthermore, the response of the FRG index in PCa cell lines implies that doxorubicin may hold clinical efficacy for recurrent PCa.
Conclusion: The FRG index established here could serve as a valuable prognostic tool and clinical decision-making aid in PCa. It offers insights into the molecular mechanisms underlying PCa progression and suggests new avenues for immunotherapeutic strategies, potentially leading to improved patient outcomes and a better understanding of PCa biology.
Keywords
INTRODUCTION
Prostate cancer (PCa) is one of the most prevalent malignancies, representing the most frequently diagnosed cancer and the second leading cause of cancer-related deaths among men worldwide[1,2]. Advancing age is a notable risk factor for PCa, with the incidence of the disease significantly increasing in men over 50 years old. Moreover, factors such as diet, lifestyle, and family history also contribute to the risk of developing PCa[1]. Consequently, the global burden of this cancer is expected to rise amidst aging populations and economic prosperity.
Hormone therapy has traditionally been the primary clinical treatment option for PCa[3,4]. However, despite its widespread use, many patients unfortunately transition to a more metastatic and lethal stage within one to two years following treatment[5]. Notably, post-treatment recurrence is a pivotal factor that significantly contributes to the escalating metastasis and poor outcomes in PCa. Therefore, to effectively reduce the mortality rate of PCa, it is paramount to detect clinical progression or recurrence in its earliest stages, when the disease burden is relatively low, and the treatment remains highly responsive and effective[6]. Prostate-specific antigen (PSA) testing is currently the most common approach for PCa detection, but it is subject to controversy, leading to overtesting and overdiagnosis[7]. Alternative biomarkers, including the 4Kscore and prostate health index (PHI) in serum, as well as SelectMDx, ExoDx Prostate Intelliscore, MyProstateScore (MPS), and PCa antigen 3 (PCA3) in urine, have primarily served as auxiliary diagnostic tools[6,8]. The prognosis index for PCa progression remains diverse and challenging, and there is still no good standard index to predict PCa progression[9,10]. Therefore, there is an urgent need for the identification of reliable prognostic biomarkers and a more comprehensive understanding of the underlying molecular mechanisms of PCa progression.
Ferroptosis, an iron-dependent type of programmed cell death characterized by the accumulation of lipid peroxides, is distinct from other types of cell death in terms of mechanisms and morphology aspects, such as its involvement in dysregulation of iron metabolism, unique morphological features like cell swelling and increased mitochondrial membrane density, as well as its sensitivity to specific inhibitors targeting lipid peroxidation[11]. Ferroptosis can serve as a natural barrier to tumor progression and has recently been recognized as a promising target for cancer therapy[12-14], including gastric cancer[15], colorectal cancer[16], breast cancer[14,17], and PCa[14]. It has been implicated in the sensitivity of cancer cells to chemotherapy, radiotherapy, and immunotherapy[18]. Recent studies have linked the modulation of ferroptosis-related pathways to various cancer progression, specifically PCa[14]. Research demonstrated that PCa resistant to traditional treatments exhibited sensitivity to ferroptosis inducers, such as Erastin and RSL3[19]. However, despite the existence of some ferroptosis-related signatures linked to biochemical recurrence or overall survival of PCa[6,20], the potential of ferroptosis-related genes as relapse biomarkers for PCa remains largely unexplored.
In this study, we aimed to systematically identify and validate a ferroptosis-related prognostic index model for PCa recurrence. By analyzing RNA-seq data from prostate adenocarcinoma tissues, we identified a set of ferroptosis-related genes (FRGs) that were differentially expressed. Utilizing these FRGs, we successfully constructed a prognostic index model that exhibited remarkable predictive accuracy across multiple datasets. The identification and validation of this FRG prognostic index model may not only offer a valuable tool for personalized risk stratification and treatment planning, but also provide new insights into the underlying molecular mechanisms driving PCa progression. Moreover, it may serve as a valuable prognostic instrument for guiding clinical decision making. Furthermore, this study could open new avenues for future investigations, particularly in exploring the therapeutic targeting of ferroptosis-related pathways as a potential strategy to improve PCa outcomes.
METHODS
Cell culture
Human prostate cancer cell lines PC3 (Cat: CL-0185), LNCaP (Cat: CL-0143), and VCaP (Cat: CL-0241) were obtained from Wuhan Procell Life Technology Co., LTD. DU145 (TCHu222) was from the Chinese Academy of Sciences Cell Bank (Shanghai, China). C4-2 were previously generated by our lab. All cell lines underwent standard authentication (STR profiling) and mycoplasma testing by the provider.
Human PCa cell lines (PC3, LNCaP, VCaP, DU145, C4-2) were cultured in RPMI 1640 (pH 7.4, Servicebio, Cat. G4531) or DMEM (pH 7.4, Servicebio, Cat. G4511) medium supplemented with 10% fetal bovine serum (FBS, TRAN, Cat. FS301-02) and 1% penicillin/streptomycin (P/S, HyClone, Cat. SV30010) at 37 °C with 5% CO2. Cells were treated with 0.5 µM doxorubicin (DOX, Selleck, Cat. S1208) or DMSO (control) for 24 h.
Quantitative real-time PCR
Total RNA was extracted with TRIzol reagent (Invitrogen, Cat. 15596018), in accordance with the manufacturer’s instructions. Subsequently, 1 µg of total RNA was reverse transcribed into complementary DNA (cDNA) using the PrimeScript™ RT Master Mix kit (Takara, Cat. RR036A), following the manufacturer’s protocol. PCR amplification was performed using TB Green Premix Ex Taq II (Tli RNaseH Plus, Takara, Cat. RR820A) along with specific primers. The primer sequences (5' to 3') employed were as follows:
CDO1 - forward: ATGGAACAGACCGAAGTGCTG, reverse: CTTGGCGTACATTGCCCAC;
ANO6 - forward: AAATTGCCTCTGAAACCCAATGA, reverse: GCTTTCGTCTACACTGAGGACTT;
NUPR1 - forward: GCCTTGGTTACAGGAGGTGG, reverse: TAGTGTCCATGGTCTGGCCT;
KIF20A - forward: TTGAGGGTTAGGCCCTTGTTA, reverse: GTCCTTGGGTGCTTGTAGAAC;
PTGS2 - forward: TAAGTGCGATTGTACCCGGAC, reverse: TTTGTAGCCATAGTCAGCATTGT;
EZH2 - forward: AATCAGAGTACATGCGACTGAGA, reverse: GCTGTATCCTTCGCTGTTTCC;
Actin - forward: GCTATCCAGGCTGTGCTATC, reverse: TGTCACGCACGATTTCC.
Real-time PCR reactions were performed using a CFX96 Real-Time System (Bio-Rad). Relative gene expression levels were calculated using the 2-∆∆CT method. The results were expressed as fold changes normalized to the Actin control group.
Bioinformatic data acquisition
To establish a ferroptosis-related prognostic gene model, we sourced transcriptome data in FPKM format and clinical information encompassing 51 normal and 492 prostate tumor tissues from The Cancer Genome Atlas (TCGA) database (https://portal.gdc.cancer.gov/). Furthermore, to validate our prognostic gene risk model, we delved into the PCa Data Base (PCaDB, http://bioinfo.jialab-ucr.org/PCaDB/)[21]. Specifically, we utilized transcriptome data and clinical information from eight studies: GSE21034 with 140 PCa patients[22], GSE94767 with 127 PCa patients[23], DKFZ2018 with 105 PCa patients[24], E-MTAB-6128 with 81 PCa patients[25], GSE70768 with 111 PCa patients[26], GSE116918 with 248 PCa patients[27], GSE54460 with
Construction and validation of the FRG prognostic model
The differentially expressed genes (DEGs) between prostate tumor and normal control tissues were identified utilizing the R package “limma”, employing a cut-off criterion of |log2FoldChange| > 2 and adjusted P-value < 0.05. Ferroptosis-related genes (FRGs), comprising ferroptosis driver, suppressor, and marker, were retrieved from FerrDb (http://www.zhounan.org/ferrdb/current/)[30]. Subsequently, the overlapping genes between the DEGs and FRGs were selected for further in-depth analysis.
Utilizing clinical data, ferroptosis-related DEGs were filtered by univariate Cox regression analysis, with a threshold of P-value < 0.05. The least absolute shrinkage and selection operator (LASSO) Cox regression analysis was employed to construct the FRG prognostic model associated with survival and relapse outcomes of PCa. The risk score was calculated using a formula as “riskScore = Σ (expression of each gene × its corresponding coefficient)”.
Furthermore, the “survminer” R package was employed to generate Kaplan-Meier (K-M) survival curves. Moreover, to assess the independent prognostic value of our gene model, both univariate and multivariate Cox regression analyses were conducted, considering both the risk score and several clinicopathological features. Additionally, the “survivalROC” R package was applied to plot the time-dependent receiver operating characteristic (ROC) curve and quantify the predictive power of our risk model.
Genetic interaction network analysis
To conduct a thorough exploration of the intricate relationships among genes within the ferroptosis-associated prognostic model, we utilized the "igraph" and "corrplot" R packages for comprehensive correlation analysis. Specifically, we employed both the "Spearman" and "Pearson" methods to accurately calculate the correlation coefficients for each pair of genes. To facilitate the interpretation of these correlations, we designed the resulting visualizations in a manner that intuitively represented the relationships. Positive correlations were depicted using red lines or boxes, while negative correlations were visualized with blue lines or boxes. Additionally, the corresponding correlation values were also presented.
Furthermore, to gain a deeper understanding of the functional interactions between these genes, we generated a protein-protein interaction (PPI) network using the STRING database (http://string-db.org/). By integrating both correlation analysis and PPI network visualization, we were able to gain a comprehensive and multifaceted understanding of the relationships among genes within our prognostic model.
Function enrichment analysis
TCGA PCa patients were stratified into two distinct cohorts: a high-risk group and a low-risk group, based on their risk scores computed from the FRG model. To gain insights into the underlying biological differences between these two cohorts, we employed the "limma" package to identify DEGs that exhibited significant changes (|log2FoldChange| > 1 and adjusted P-value < 0.05) between the high-risk and low-risk groups. Subsequently, utilizing enrichGO and enrichKEGG modules in the "clusterProfiler" R package, Gene Ontology (GO) and Kyoto Encyclopedia of Genes and Genomes (KEGG) enrichment analysis were performed on these DEGs.
The GO analysis was conducted in three dimensions: biological processes (BP), cellular components (CC), and molecular functions (MF). In each GO category, we highlighted the top five most significant terms. For KEGG analysis, we displayed the top 10 most enriched pathways. The analyses of GO and KEGG were both in the human genome background, with the parameters set to P value cut-off = 0.05 and q value
Clinicopathological features and drug sensitivity analysis of the FRG index risk model in PCa
Guided by the 2019 International Society of Urological Pathology (ISUP) Consensus Conference on Grading of Prostatic Carcinoma[31] and the Eighth Edition of the AJCC Cancer Staging Manual[32], we categorized the TCGA PCa patients into distinct pathological grades: Grade I, II, III, IV, and V, as well as into four distinct stages: Stage I, II, III, and IV. This classification process ensured a thorough and comprehensive evaluation of the patients' disease status. Following this categorization, we further analyzed and compared the risk scores of these patients in different pathological T and N stages, PSA levels, grades, and stages. These comparisons were presented in boxplots, which were computed and generated using the "ggplot2" R package.
To identify the drug sensitivity profiles of TCGA PCa cohorts that were stratified by the FRG index risk model, we first sourced the drug response data from two repositories: the Cancer Therapeutics Response Portal[33] (CTRP, https://portals.broadinstitute.org/ctrp/) and CellMiner[34] (https://discover.nci.nih.gov/cellminer/). These databases provide invaluable information on the response of diverse human cancer cell lines to Food and Drug Administration (FDA)-approved drugs. Subsequently, utilizing the “oncoPredict” R package and the above drug response data, the drug sensitivity of each TCGA PCa patient was predicted.
Specifically, we focused on two commonly used drugs in PCa hormonal therapy: Abiraterone and Enzalutamide. These drugs play a crucial role in managing PCa, particularly in advanced stages. By analyzing the predictions of drug sensitivity in TCGA PCa patients, we compared the response profiles of Abiraterone and Enzalutamide between high-risk and low-risk PCa cohorts.
Immune characteristics analysis of the FRG index risk model in PCa
Utilizing the CIBERSORT algorithm, the immune infiltration patterns of TCGA prostate cancer patients were calculated. To uncover potential immunological differences that might underlie PCa progression, the infiltration levels of various immune cells were compared in normal versus prostate tumor, as well as between high- and low-risk PCa cohorts. Specifically, the PCa patients were classified into four distinct groups, based on both the infiltration level of a specific immune cell type and their individual risk score derived from the FRG model. To assess the prognostic performance of these patient groups, the “survminer” R package was utilized to generate K-M survival curves. Furthermore, the "Spearman" method was employed to calculate the correlation coefficients between each immune cell infiltration level and the FRG index risk score.
Statistical analysis
The R platform, specifically version 4.4.0 (https://cran.r-project.org/), was utilized for the statistical analysis. Group differences were assessed using ANOVA and Student’s t-test. Furthermore, the log-rank tests were applied to determine the statistical significance of the Kaplan-Meier method. An adjusted P-value was set for all statistical tests, and a P-value < 0.05 was considered statistically significant.
RESULTS
Identification and validation of the FRG prognostic index model in prostate cancer
To identify ferroptosis-related DEGs in PCa, we initially analyzed RNA-seq datasets from prostate adenocarcinoma tissues in TCGA using the R package “limma”. DEGs were filtered at a threshold of
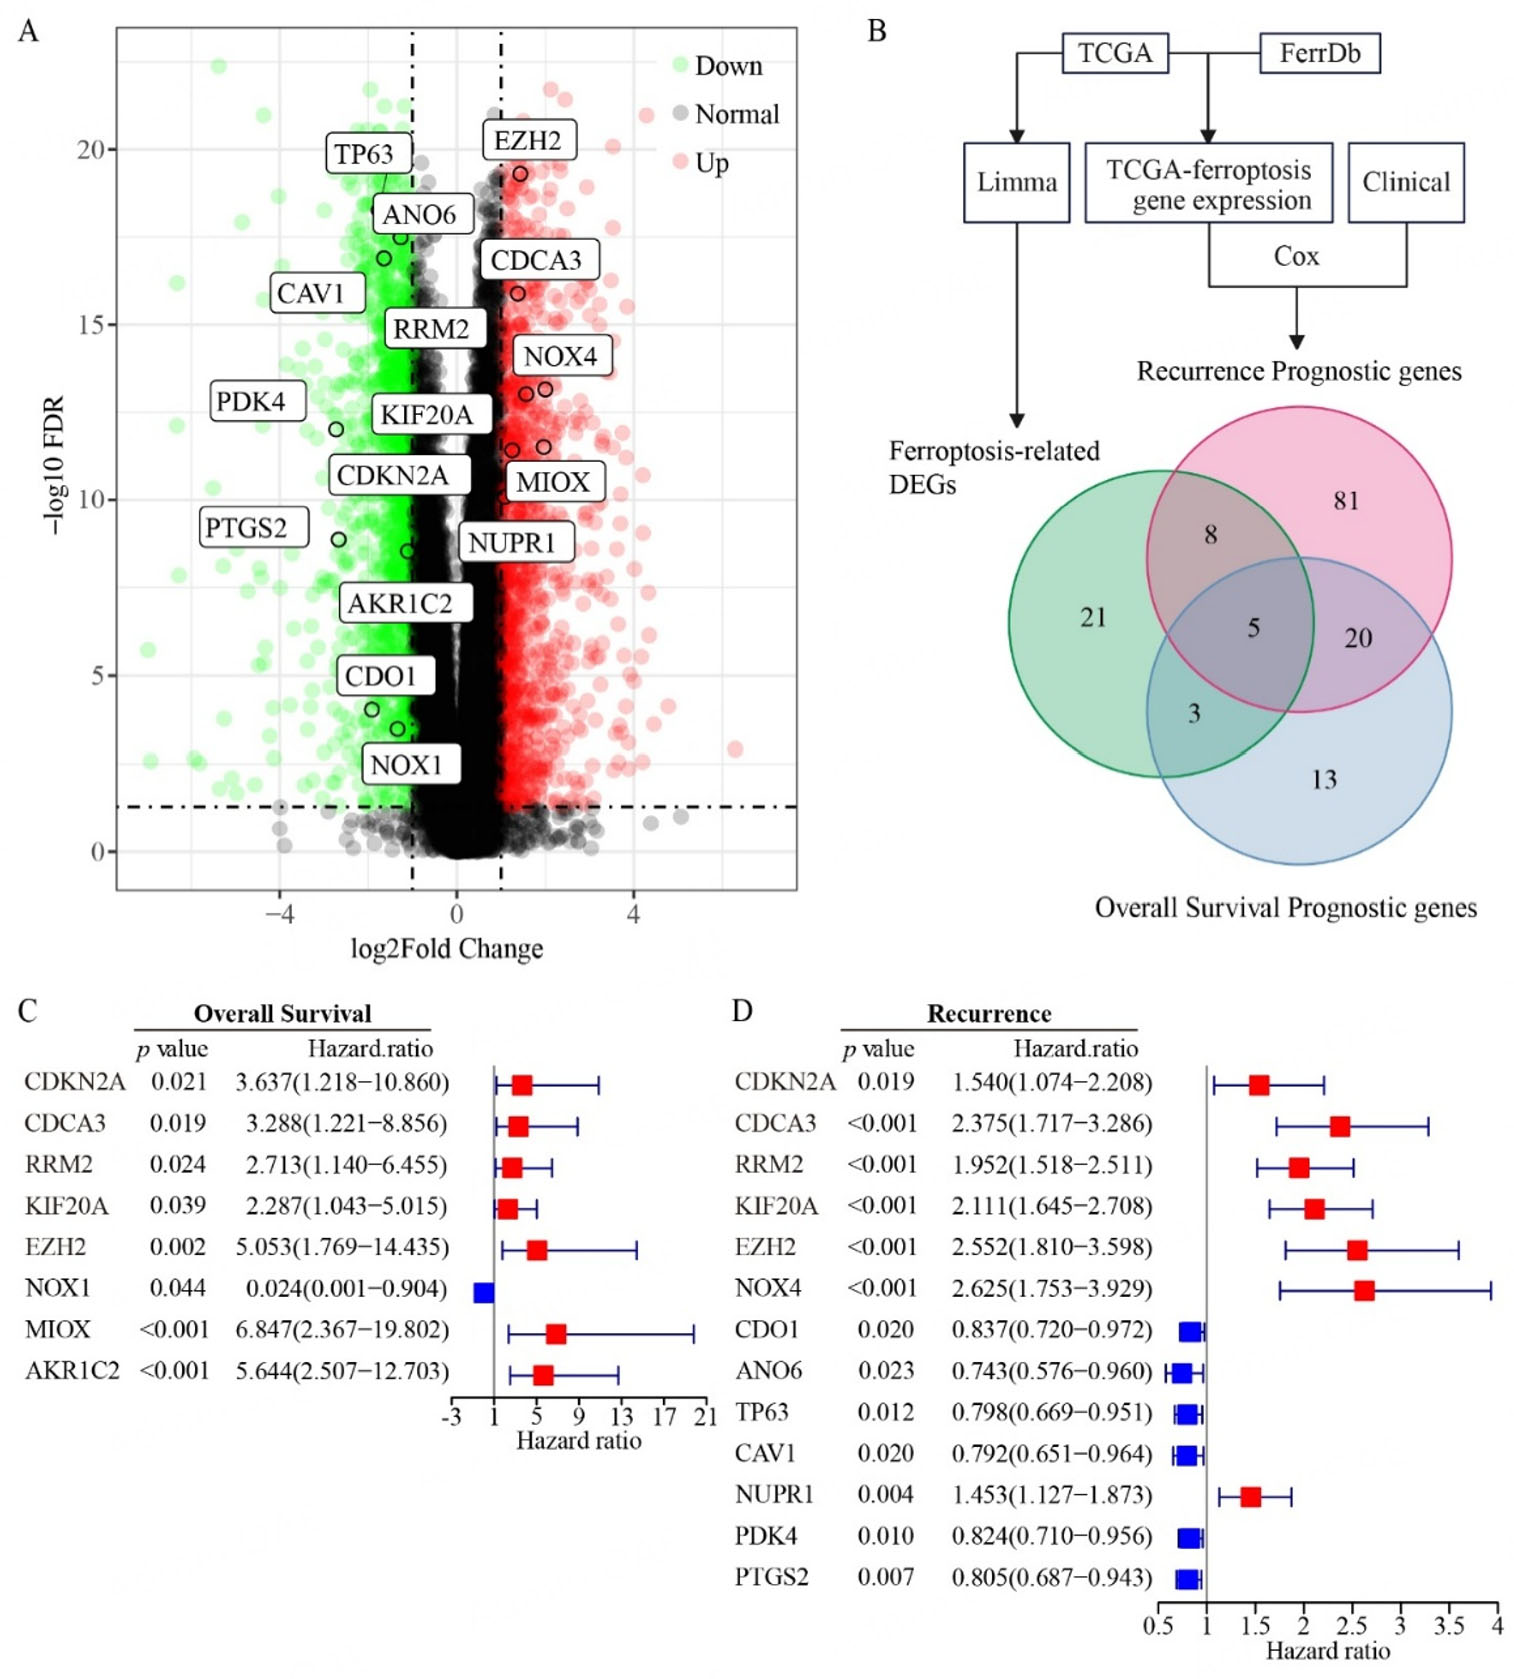
Figure 1. Identification of FRG prognostic genes in prostate cancer. (A) Volcano plot showing differentially expressed genes (DEGs) between prostate tumor and normal tissues from the TCGA dataset. (B) Venn diagram showing the overlap between DEGs of FRGs and prognostic genes for recurrence/overall survival. (C and D) Univariate Cox regression analysis of FRGs associated with overall survival (C) and recurrence (D) in prostate cancer. Sample sizes: normal tissues (n = 51); prostate tumors (n = 492).
Based on the above 13 recurrence-related prognostic DEGs and 8 overall survival-related prognostic DEGs, seven genes (NOX4, CDO1, ANO6, NUPR1, KIF20A, EZH2, PTGS2) for recurrence prediction and six genes (NOX1, CDKN2A, MIOX, AKR1C2, RRM2, EZH2) for overall survival were further selected by LASSO-penalized regression modeling. For each PCa case, we calculated a FRG prognostic index risk score based on the expression levels of the selected genes, weighted by their respective regression coefficients. Based on these risk scores, these PCa patients were next divided into high-risk and low-risk groups. As expected, the high-risk group exhibited significantly poorer relapse-free and overall survival probabilities than the low-risk group [Figure 2A and B]. Notably, as the FRG prognostic index risk score increases, both the number of relapsed cases [Figure 2C] and deaths [Figure 2D] among PCa patients rise markedly. Furthermore, the area under the ROC curve for 1-3-year relapse-free survival and overall survival was consistently above 0.65 [Figure 2E and F], indicating the promising predictive power of the FRG prognostic index.
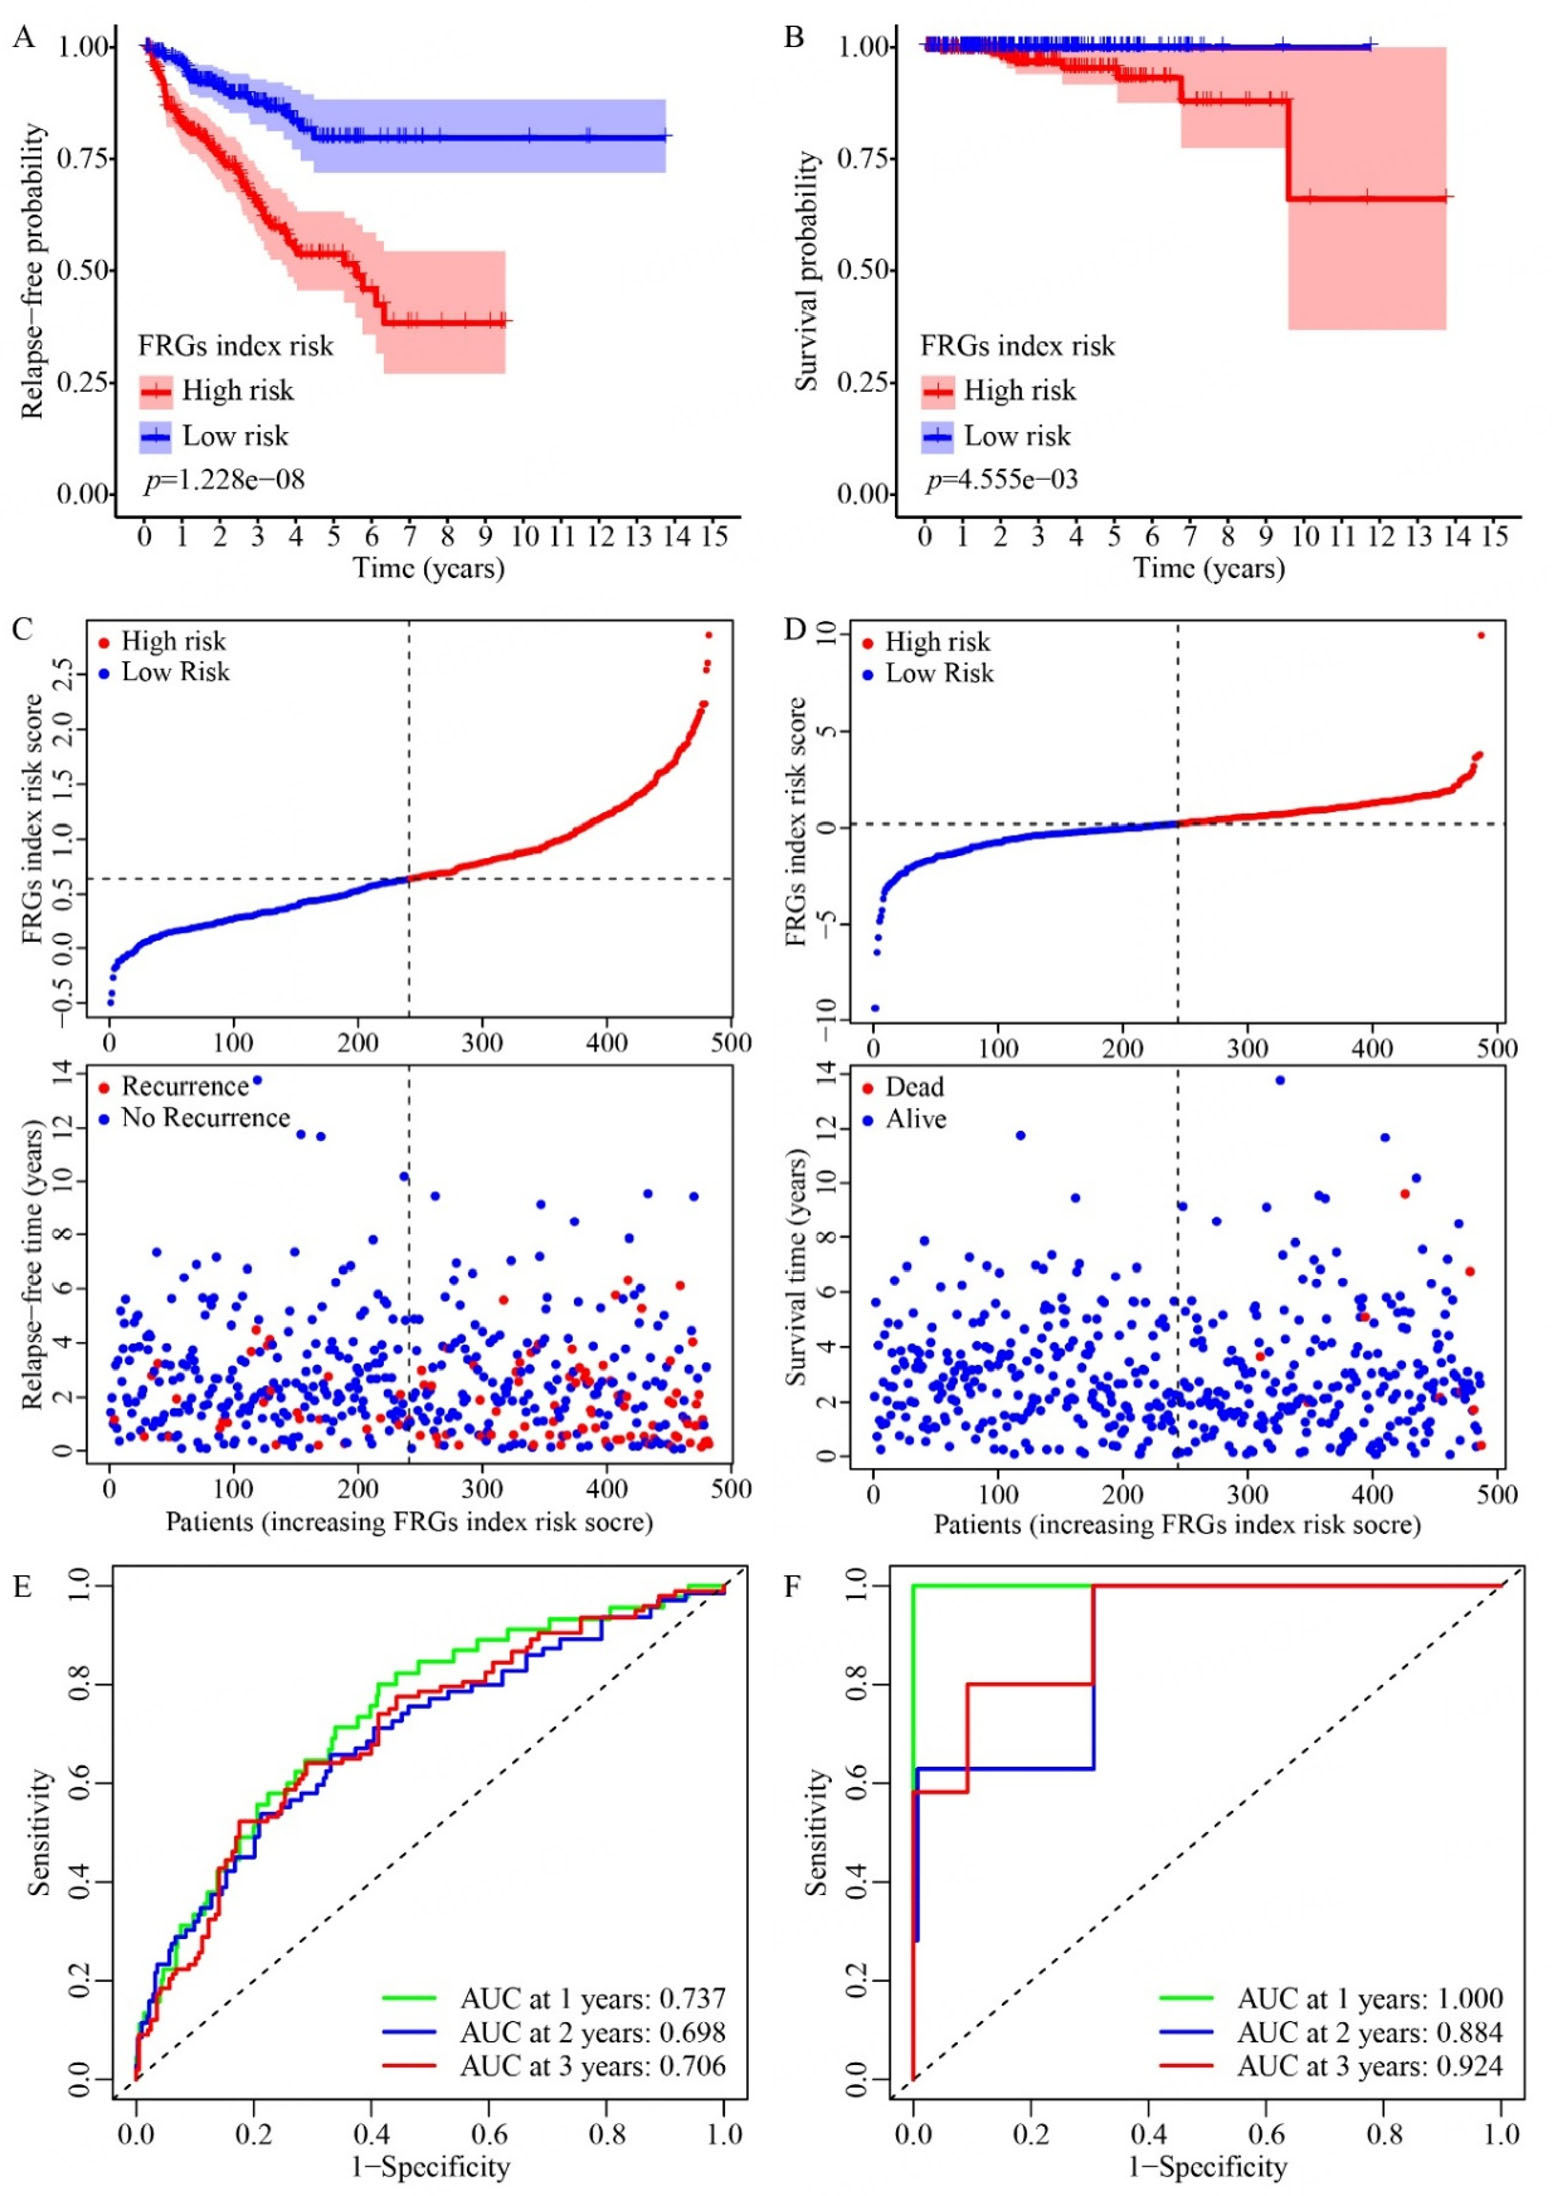
Figure 2. Analysis of relapse and survival patterns in TCGA prostate cancer patients based on the FRG prognostic index. (A and B) Kaplan-Meier curves show relapse-free probability (A) and overall survival (B) in high- and low-risk groups, classified according to the FRG prognostic model derived from LASSO Cox regression analysis. (C and D) Risk distribution plots visualize the risk scores and corresponding recurrence status (C) or survival status (D) of TCGA prostate cancer patients. (E and F) ROC curves illustrate the predictive performance of the FRG prognostic index for recurrence (E) and survival (F) at 1-, 2-, and 3-year intervals. n = 482.
As clinical recurrence is a critical factor for PCa progression, our subsequent focus was primarily on the risk model of the FRG prognostic index for PCa recurrence. We then validated the prognostic value of our FRG recurrence index model based on eight additional PCa datasets (GSE21034, GSE94767, DKFZ2018,
Based on the established risk model of FRG prognostic index for PCa recurrence (NOX4, CDO1, ANO6, NUPR1, KIF20A, EZH2, PTGS2), we conducted an analytical and experimental validation on the expression of these model genes in PCa cell lines. Among these genes, CDO1, ANO6, and PTGS2 are linked to high recurrence risk when they are lowly expressed, whereas NOX4, KIF20A, EZH2, and NUPR1 are associated with high recurrence risk when they are highly expressed in PCa [Figure 1D]. Expression pattern validation through integrated analysis of cohorts containing normal tissues (GSE21034, E-MTAB-6128, GSE70768, and GSE35988; Supplementary Figure 3) further supports this: for the ferroptosis suppressors (high expression indicating high risk), NUPR1, KIF20A, EZH2, and NOX4 showed consistent upregulation in prostate tumors (both primary and CRPC); for the ferroptosis promoters (low expression indicating high risk), ANO6 and PTGS2 were uniformly downregulated in prostate cancer patients, while CDO1 exhibited a context-dependent pattern, not showing a consistent pattern in primary prostate cancer but being significantly downregulated in CRPC. These associations reflect distinct expression-risk patterns tied to ferroptosis regulation: NUPR1, KIF20A, EZH2, and NOX4 are ferroptosis suppressors, and their high expression suppresses ferroptosis to drive high recurrence risk and resistance, while low expression of CDO1, ANO6, and PTGS2 (ferroptosis promoters) impairs ferroptosis and similarly elevates recurrence risk.
According to the DepMap portal database [Figure 3A], compared to normal epithelial cells PRECLH and benign cells BPH1, CDO1 is obviously downregulated in PC3 and LNCAP, aligning with its low expression-high risk profile, but is notably upregulated in VCAP. Similarly, ANO6 and PTGS2 are markedly decreased in BPH1, PC3, LNCAP, and VCAP compared to PRECLH, consistent with their low expression-high risk status. NUPR1, KIF20A, and EZH2 exhibit upregulated trends in both LNCAP and VCAP, corroborating their high expression-high risk associations. NOX4 is notably downregulated in LNCAP and PC3 but shows no significant difference in VCAP, which contradicts its high expression-low risk classification. Further validation using RT-PCR across different PCa cell lines (PC3, DU145, LNCAP, C4-2 and VCAP) revealed that NOX4 expression is extremely low in various PCa cell lines, explaining the discrepancy observed in the model. Consistent with previous findings, the RT-PCR results of CDO1 showed exceptionally high expression in VCAP [Figure 3B]. Moreover, the expression patterns of ANO6, PTGS2, NUPR1, KIF20A, and EZH2 in LNCAP and VCAP cells align with the trends observed in the DepMap portal database
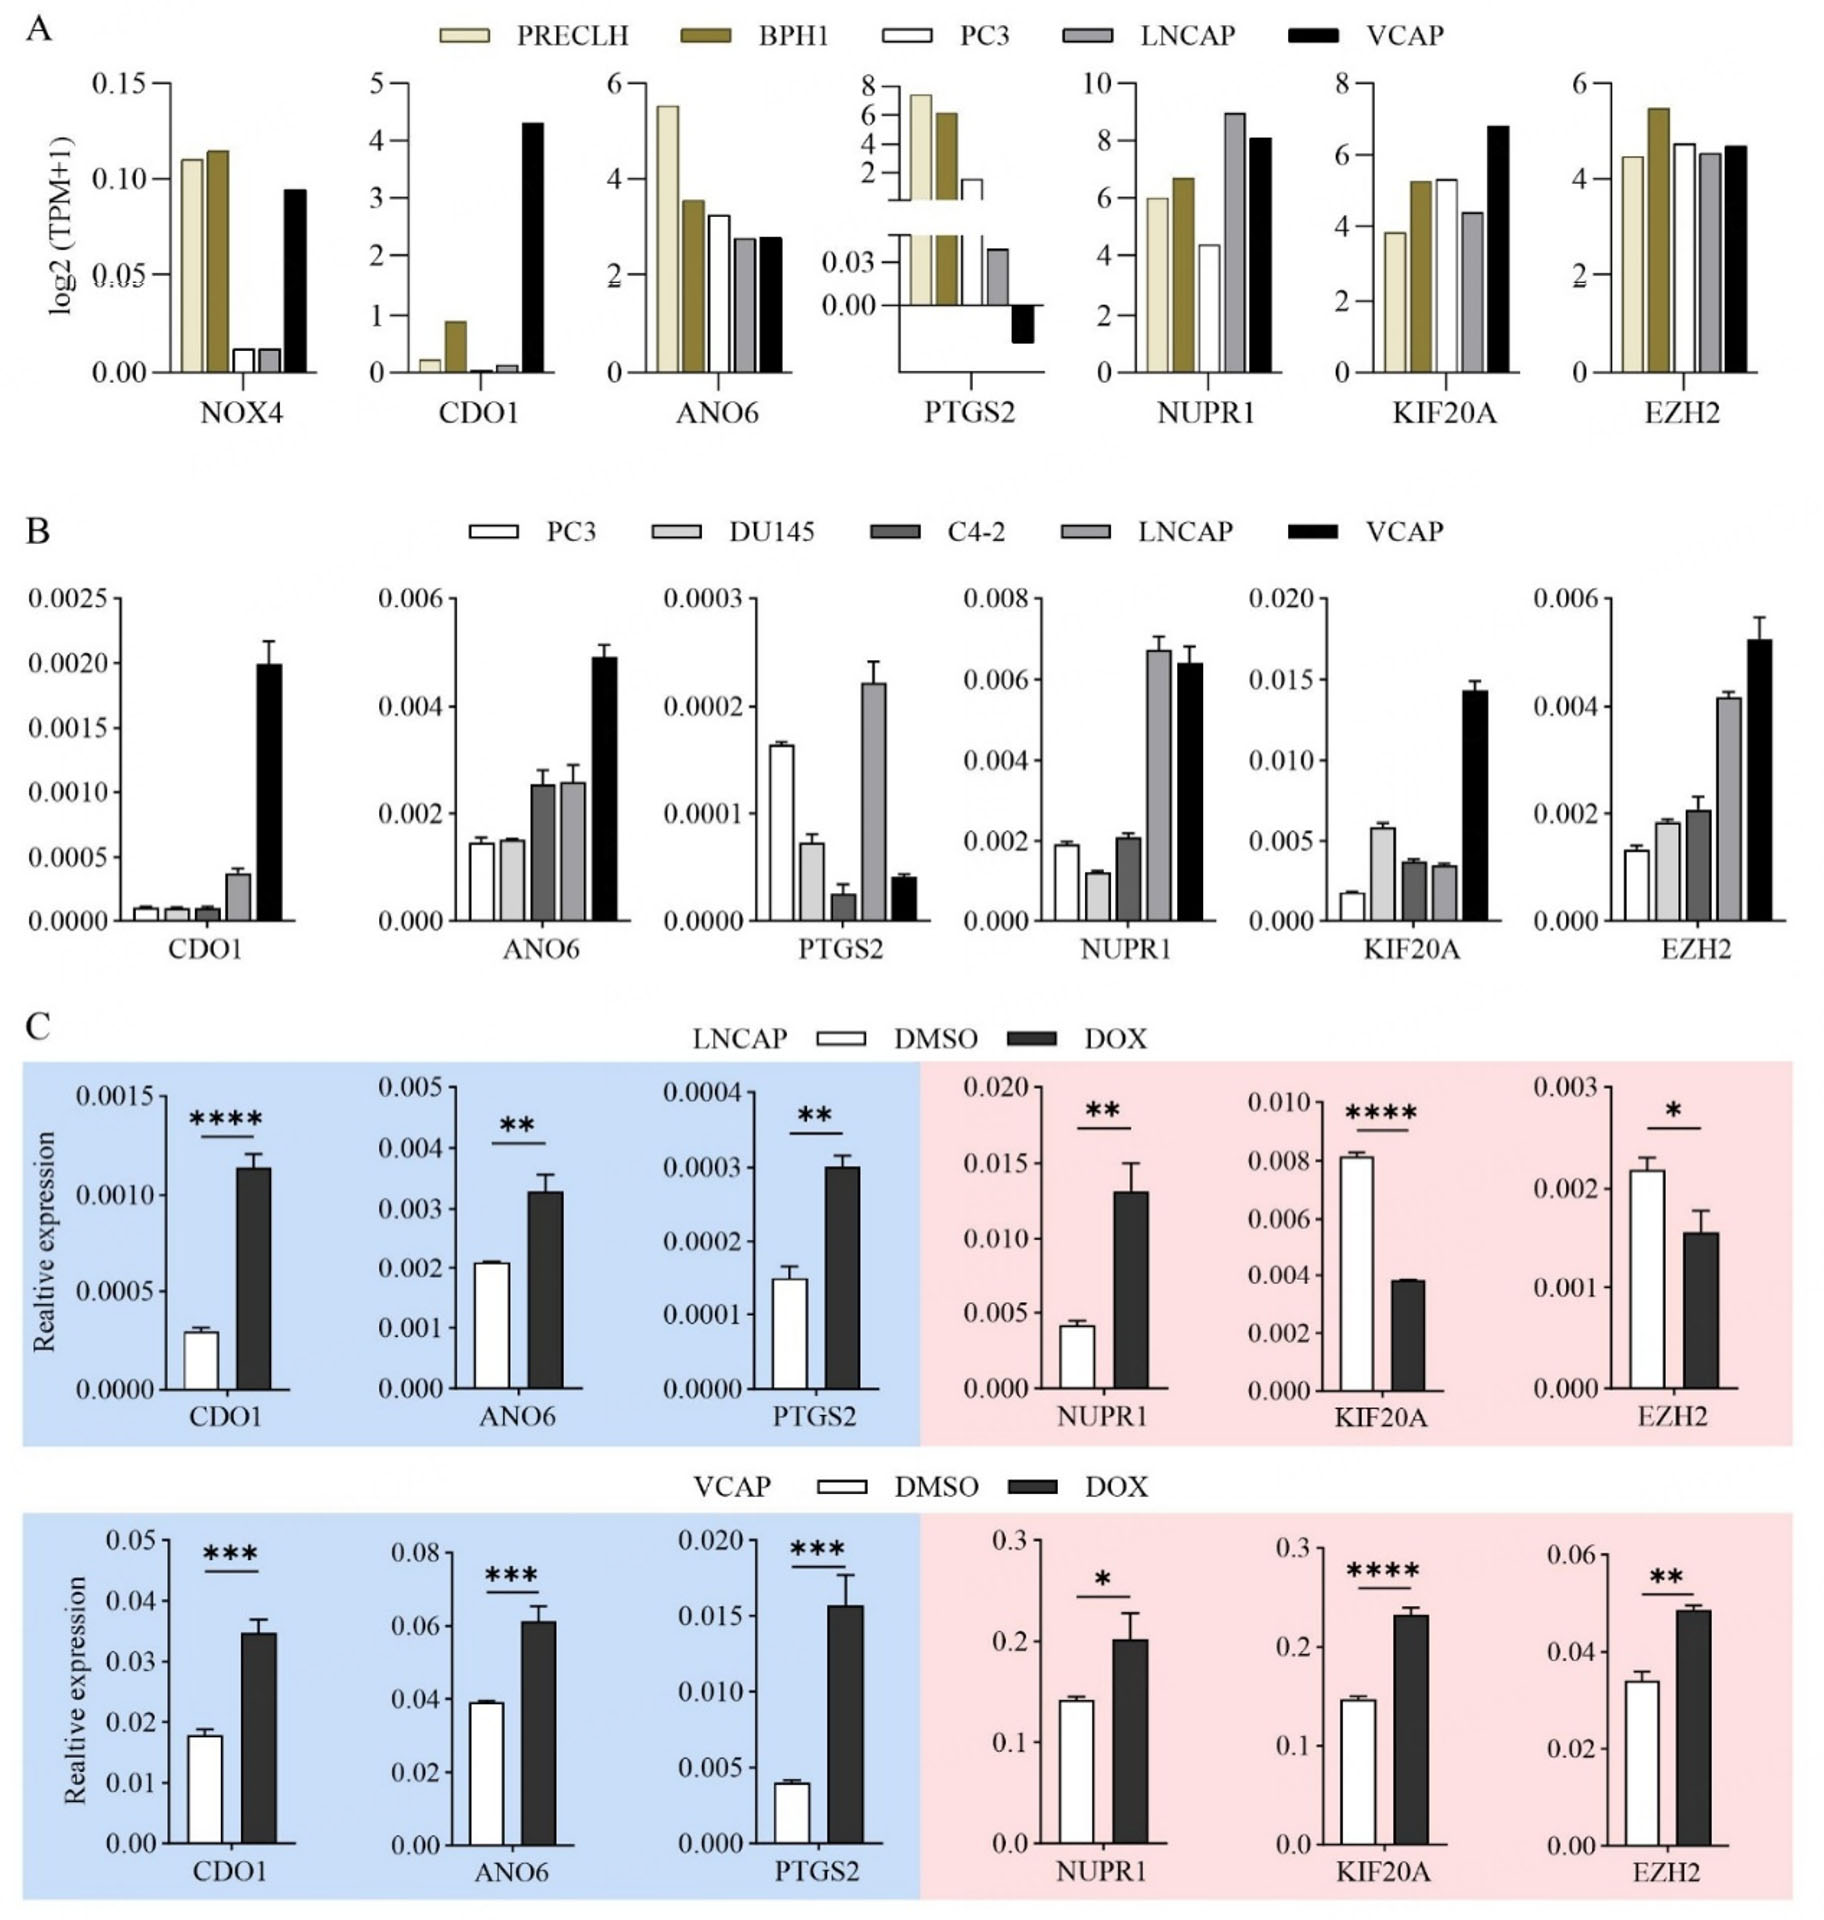
Figure 3. Validation of the FRG recurrence prognostic index for the ferroptosis-induced response in PCa cells. (A) Expression profiles of genes in the FRG-based prognostic risk index for PCa recurrence, measured in two benign prostate cell types: immortalized Prostate Epithelial Cells (PrEC-LH) and Benign Prostatic Hyperplasia-1 cells (BPH-1), and in prostate adenocarcinoma cell lines: PC3, LNCAP, and VCAP. (B) RT-PCR verification of endogenous expression levels of the FRG risk model genes in PCa cell lines: PC3, DU145, C4-2, LNCAP, and VCAP. (C) Relative expression levels of FRG risk model genes in LNCAP and VCAP cells after exposure to DOX (0.5 μM) for 24 h. Actin was used as the reference gene for normalization, and the DMSO-treated group served as the control. *P < 0.05,
To functionally validate the FRG model, we used doxorubicin (DOX) treatment as a ferroptotic stress challenge, given that DOX induces ferroptosis by increasing lipid peroxidation[35]. Experimental results showed that CDO1, which was less expressed in LNCAP than VCAP cells, was significantly more upregulated in LNCAP upon DOX treatment (Fold Change [FC] = 3.8 in LNCAP vs. 1.9 in VCAP) [Figure 3C]. Conversely, PTGS2, which was relatively lower in VCAP than LNCAP, displayed a more marked upregulation in VCAP in response to DOX (FC = 2.0 in LNCAP vs. 3.9 in VCAP). NUPR1, which was relatively higher in LNCAP than VCAP, showed a more evident upregulation in LNCAP upon DOX exposure (FC = 3.2 in LNCAP vs. 1.4 in VCAP). For KIF20A and EZH2, both of which were expressed at higher levels in VCAP than LNCAP, were significantly upregulated in VCAP upon DOX treatment, while strikingly downregulated in LNCAP cells (KIF20A, FC = 0.5 in LNCAP vs. 1.6 in VCAP; EZH2, FC = 0.7 in LNCAP vs. 1.4 in VCAP). ANO6 exhibited similar upregulation in both lines in response to DOX treatment (FC = 1.6). These amplified gene expression responses in high-risk cells reflect underlying ferroptosis dysregulation, which is consistent with their recurrence-prone phenotype and suggests ferroptosis inducers like DOX may target recurrence-driven vulnerabilities. Collectively, VCAP, characterized by low PTGS2 and high KIF20A and EZH2 expression, showed a more pronounced response of these three genes to DOX, while LNCAP, with low CDO1 and high NUPR1 expression, exhibited a more evident response of these two genes to DOX, both conform to the pattern that higher recurrence risk corresponds to a more pronounced response to DOX.
CDO1, ANO6, and PTGS2, as ferroptosis drivers or markers, have been reported to promote ferroptosis. Conversely, NUPR1, KIF20A, and EZH2 act as ferroptosis inhibitors, suppressing ferroptosis[30]. By integrating our experimental and analytical results, we found that low expression of ferroptosis drivers/markers and high expression of ferroptosis inhibitors in PCa predict a higher recurrence risk, suggesting that the blockade of ferroptosis may contribute to a notable increase in PCa recurrence rates. Furthermore, the previously observed more pronounced response to DOX in the context of high recurrence risk implies that DOX may hold clinical efficacy in the treatment of recurrent PCa, thereby reinforcing the validity of our FRG recurrence index.
The FRG prognostic index could serve as an independent predictor of relapse for clinical PCa
Based on the prognostic value of our FRG recurrence index in PCa, we delved deeper into their expression profiles and co-expression patterns to uncover their intricate correlations. Among the 13 recurrence-related prognostic DEGs, two distinct expression profiles emerged. Notably, CDO1, TP63, ANO6, CAV1, PDK4, and PTGS2 displayed significant upregulation, whereas NUPR1, EZH2, CDCA3, RRM2, KIF20A, NOX4, and CDKN2A exhibited marked downregulation in prostate tumor tissues compared to normal tissues [Figure 4A]. Our correlation analysis using the “Spearman” [Figure 4B] and “Pearson” [Figure 4C] methods both revealed that genes within each of the above two profiles exhibited internally positive correlation, but negative correlations with genes in the other profile. The seven FRG recurrence index (CDO1, ANO6, PTGS2, NOX4, NUPR1, KIF20A, EZH2) identified through Lasso regression models encompassed both the above two distinct expression profiles. Utilizing the STRING database, we predicted protein interactions and found that only four of these lasso genes (PTGS2, NOX4, EZH2, KIF20A) exhibited interaction [Figure 4D]. The differential expression patterns suggested that these genes may function interrelatedly as a network that can be linked to the prognosis of PCa recurrence.
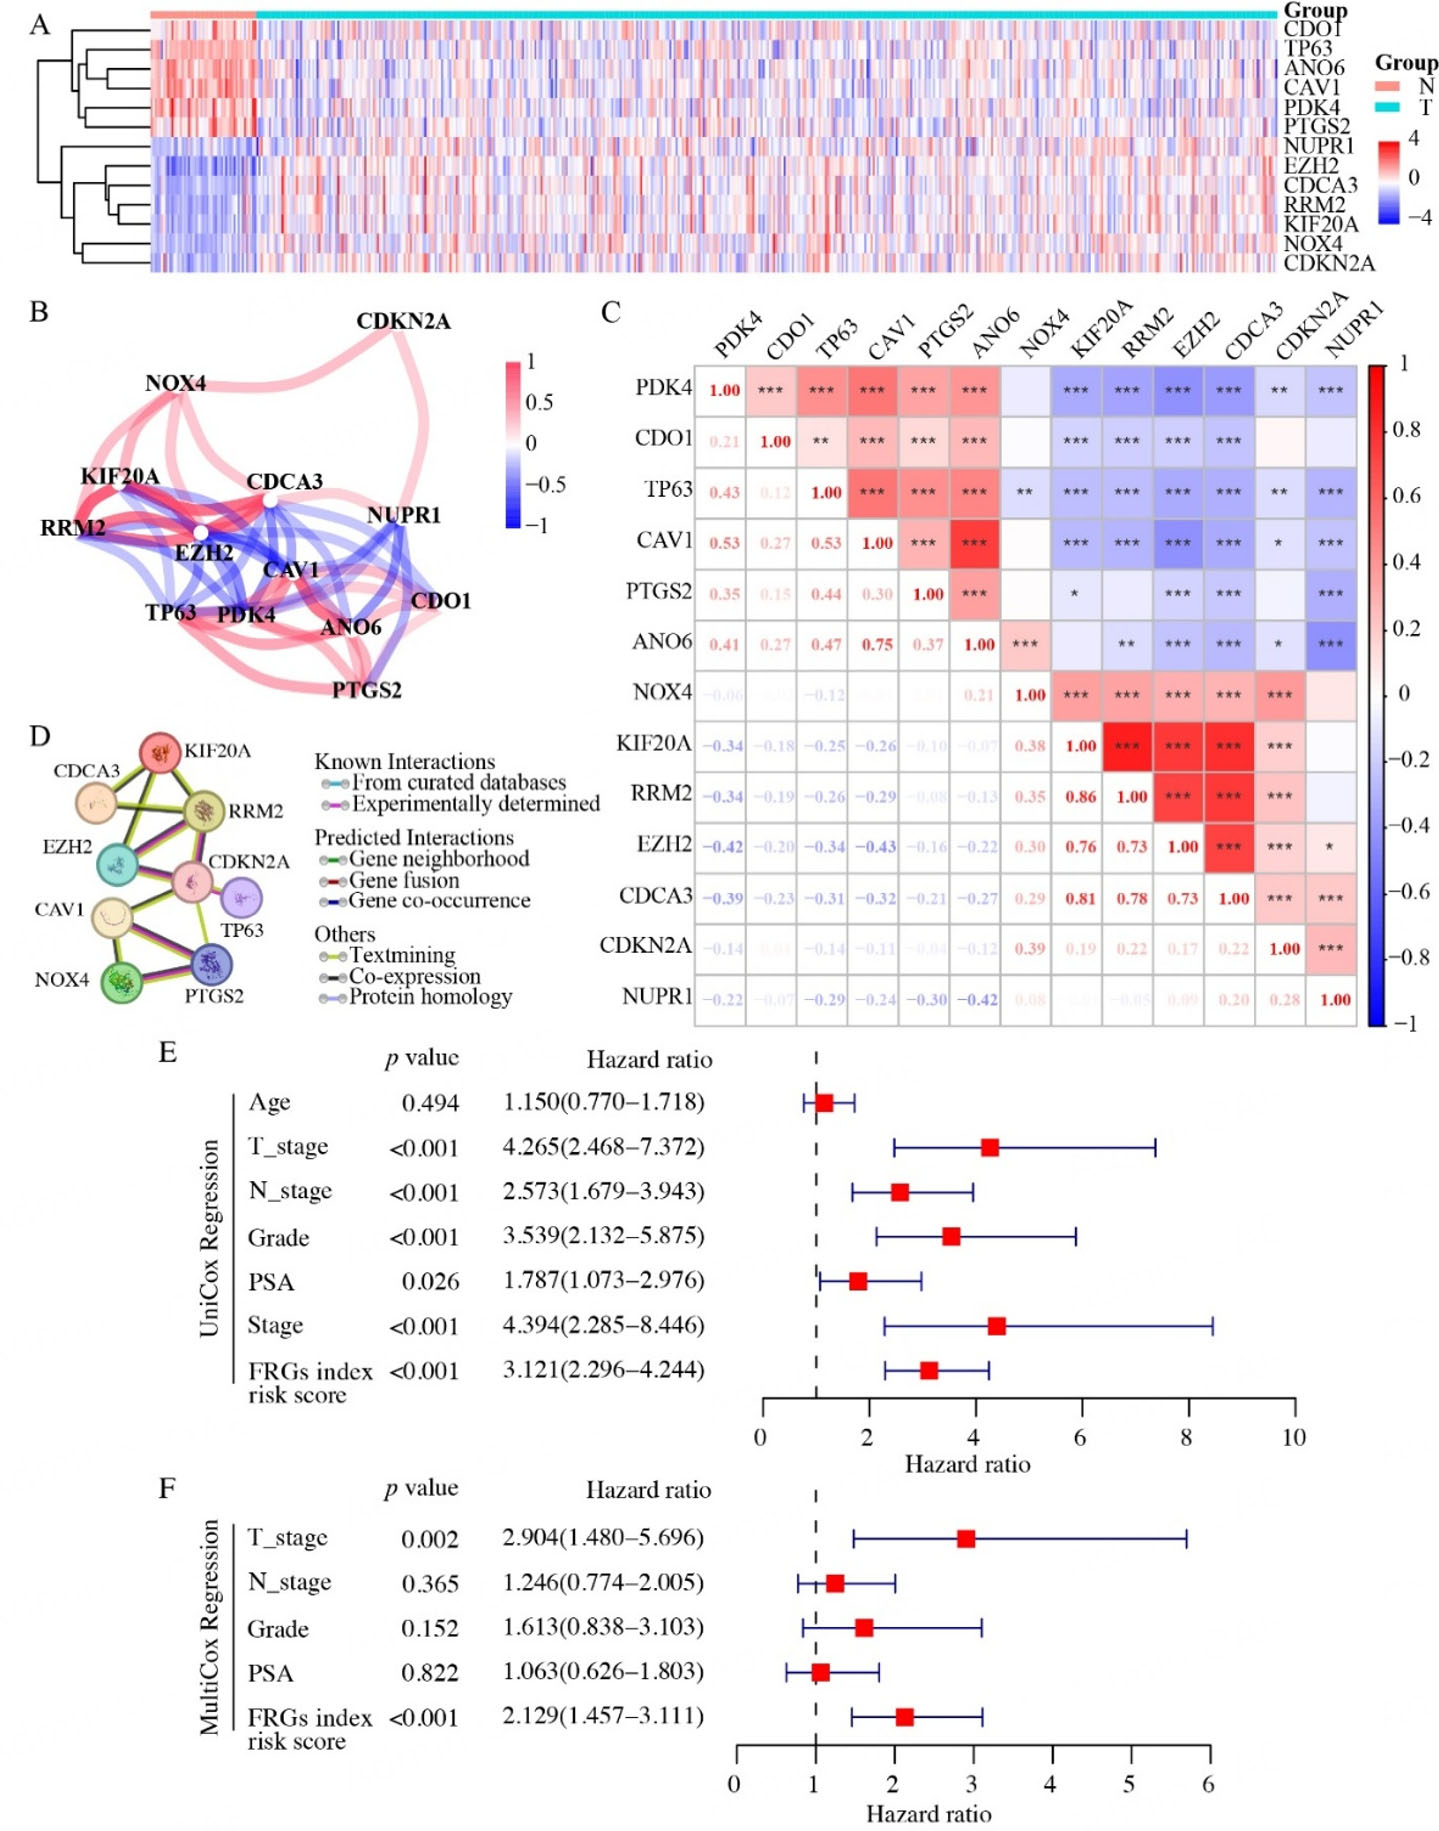
Figure 4. Expression patterns and prognostic value of the FRG recurrence index in TCGA prostate cancer. (A) Heatmap showing the expression profiles of 13 relapse-associated FRGs in TCGA prostate cancer samples. (B) Spearman correlation network of the selected FRGs. (C) Lower left panel: Pearson correlation coefficients between the selected relapse-associated FRGs. Upper right panel: results of statistical significance tests, with asterisks indicating significance levels (*P < 0.05, **P < 0.01, ***P < 0.001). (D) Interaction network of the selected FRGs retrieved from the STRING database. (E and F) Univariate (E) and multivariate (F) analyses of the prognostic value of the FRG recurrence risk score in TCGA prostate cancer patients, along with clinicopathological parameters. N: Normal tissue. T: tumor tissue. n (Normal) = 51, n (Prostate tumor) = 492.
To further solidify the significance of the FRG recurrence index risk score as an indicator of PCa progression, we next grouped TCGA PCa patients into five Grades according to their Gleason scores, referencing the 2019 International Society of Urological Pathology (ISUP) Consensus Conference on Grading of Prostatic Carcinoma[31]. Additionally, the cancer stage of each case was also assigned in accordance with the Eighth Edition of the AJCC Cancer Staging Manual[32].
Furthermore, to substantiate the potential of our FRG recurrence index risk model as an independent PCa prognostic factor, we conducted comprehensive univariate and multivariate Cox regression analyses. These analyses encompassed diverse factors such as age, clinicopathological parameters (including pathological T and N stage, PSA level, Grade, and Stage), and the risk score derived from our FRG recurrence index model. Since the Stage was determined by factors such as pathological T stage, pathological N stage, PSA level, and Gleason score, we excluded it from the multivariate Cox regression analysis to avoid redundancy. The univariate analysis showed that pathological T stage, N stage, PSA level, Grade, Stage, and FRG recurrence index risk scores were all significant predictors for PCa relapse [Figure 4E]. However, the multivariate analysis revealed that only the T stage and FRG recurrence index risk score emerged as independent predictors of relapse for PCa patients [Figure 4F]. Our comprehensive Cox regression analyses demonstrated that, among multiple factors underlying PCa relapse, the risk score derived from our FRG recurrence index model stood out as an independent predictor for PCa recurrence.
The FRG recurrence index effectively reflects PCa progression
Based on the clinicopathological categorization of PCa patients, our investigation into the correlation between the FRG recurrence index risk score and clinicopathological features has yielded intriguing insights. Our comprehensive analysis revealed that patients with advanced pathological T and N stages exhibited significantly higher FRG recurrence index risk scores, indicating a greater likelihood of relapse
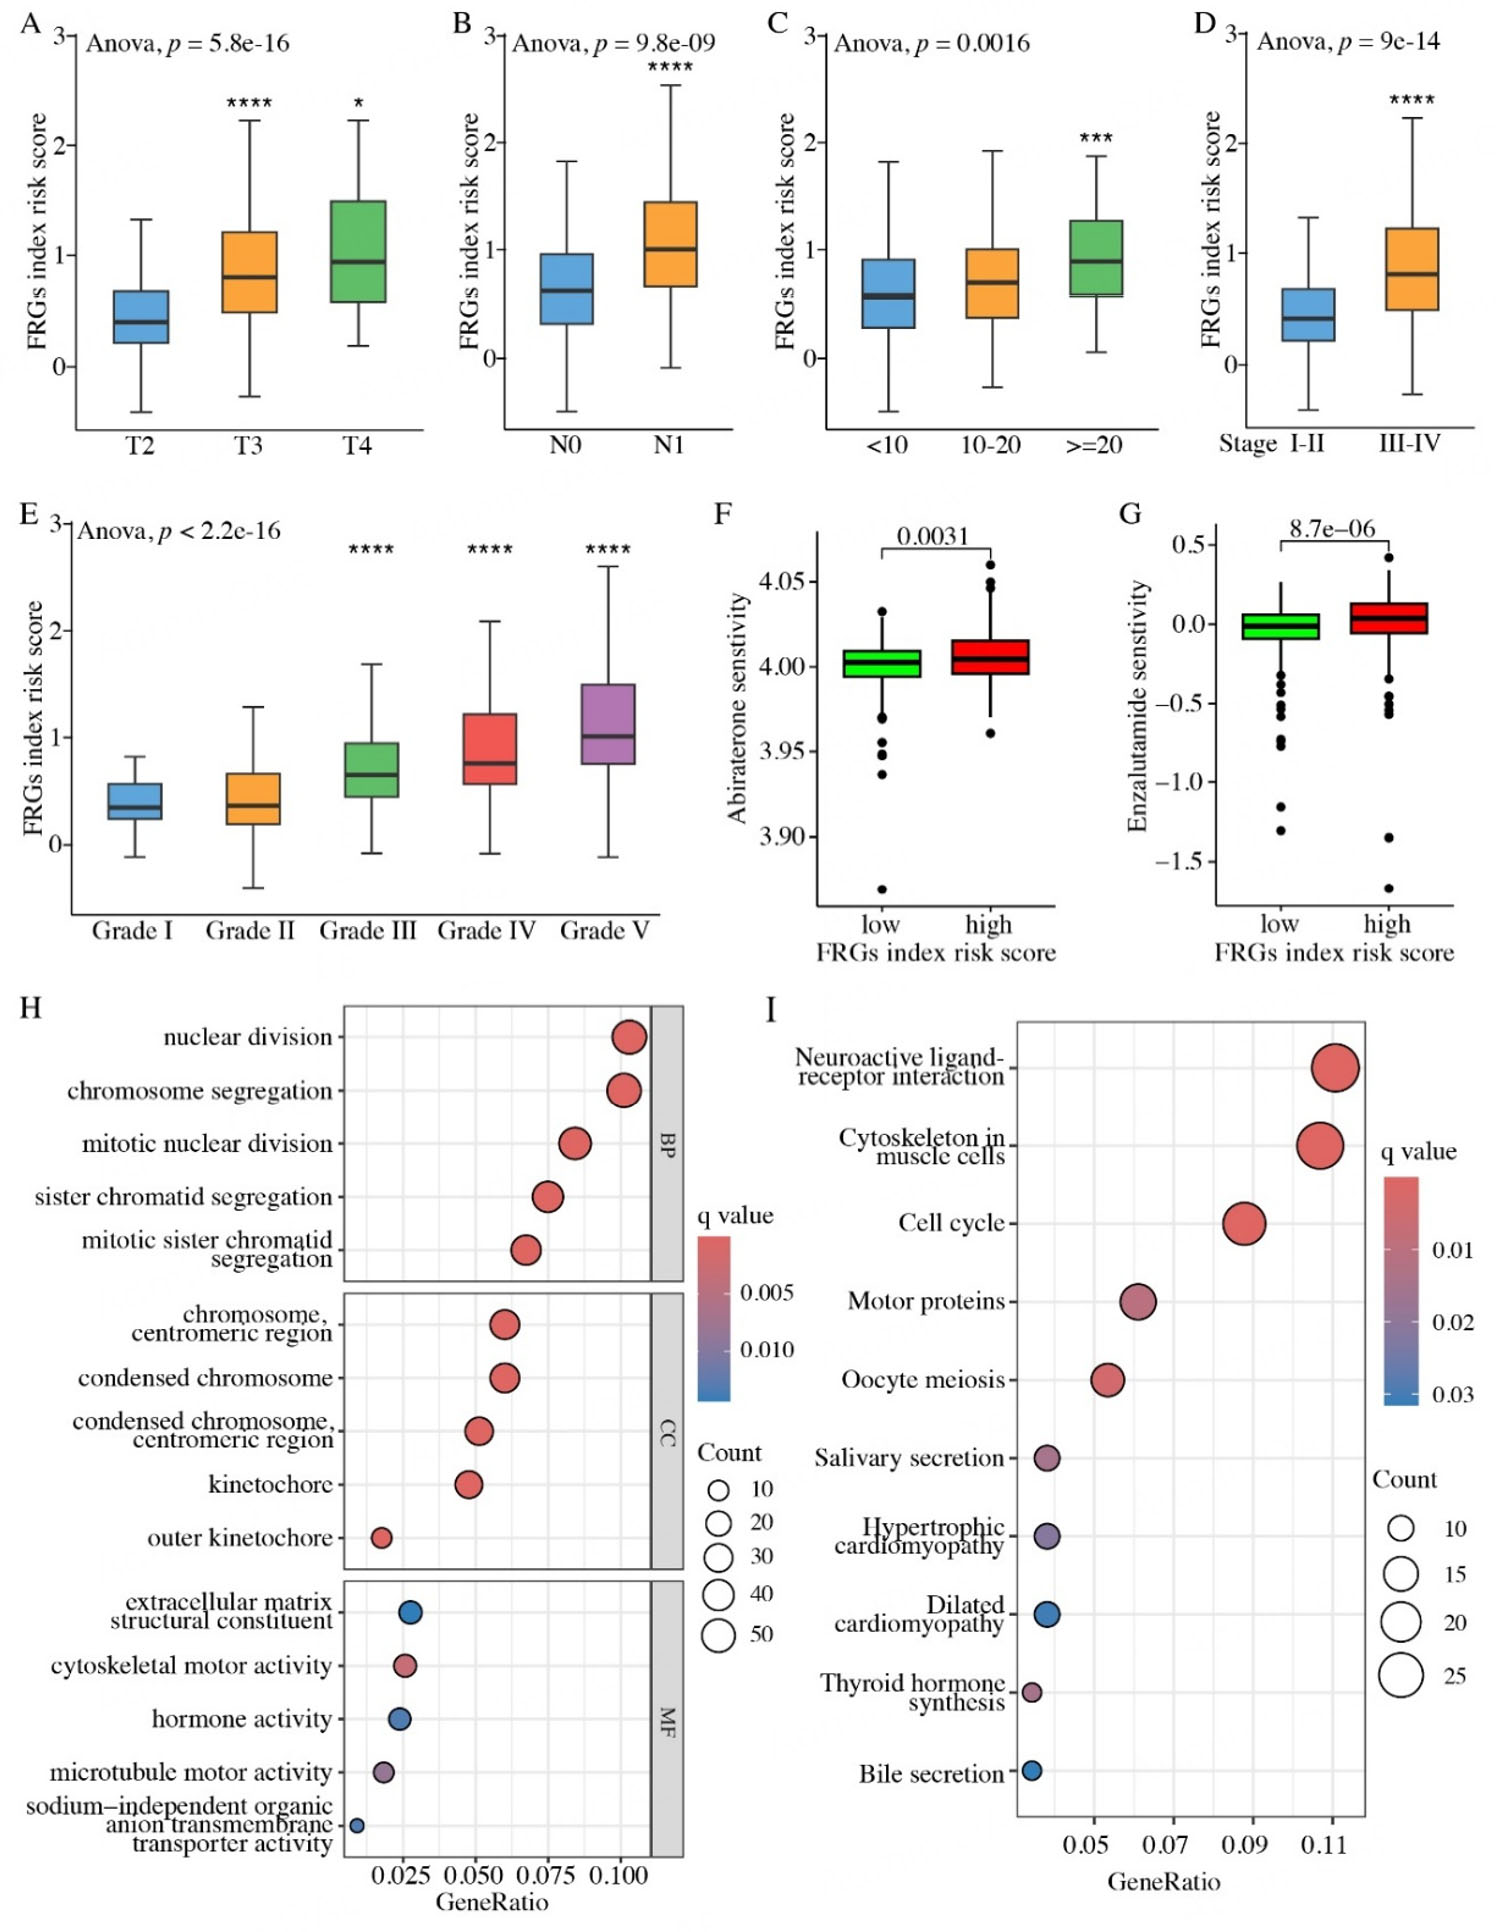
Figure 5. Clinicopathological and biological characteristics of TCGA prostate cancer patients according to the FRG recurrence index risk group. (A-E) Associations between the FRG recurrence index risk score and clinicopathological features, including pathological T stage (A), pathological N stage (B), PSA level (C), overall stage (D), and tumor grade (E). (F and G) Positive correlations between drug sensitivity to Abiraterone (F) or Enzalutamide (G) and the FRG recurrence index risk score in prostate cancer patients. (H) The top five enriched terms in the Biological Process (BP), Cellular Component (CC), and Molecular Function (MF) categories from Gene Ontology (GO) analysis. (I) The top 10 enriched terms from the KEGG pathway analysis. GO and KEGG enrichment analyses were performed by comparing the high- and low-risk groups of TCGA prostate cancer patients. *P < 0.05, ***P < 0.001, ****P < 0.0001. The term “risk score” refers to scores calculated from our FRGs-based model.
Furthermore, we also observed that patients with PSA levels exceeding 20 ng/mL (PSA >= 20, n = 53) had significantly higher FRG recurrence index risk scores compared to those with PSA levels below 10 ng/mL (PSA < 10, n = 315) [Figure 5C]. PSA is an androgen receptor (AR)-driven gene that is widely used as a PCa biomarker, and its elevated expression often correlates with disease progression. Our findings suggested that the higher FRG recurrence index risk score could serve as a significant predictive indicator for the elevated PSA level of PCa patients.
Additionally, we found that the patients in the more aggressive stage (Stage III-IV, n = 303) also had markedly higher FRG recurrence index risk scores than those in Stages I-II (n = 129) [Figure 5D]. Furthermore, compared with the PCa patients in Grade I (n = 45) and II (n = 145), the patients in advanced tumor grades (Grade III, n = 99; Grade IV, n = 59; and Grade V, n = 134) showed higher FRG recurrence index risk scores [Figure 5E]. These clinicopathological parameters are known indicators of tumor aggressiveness and disease progression. Our results indicated that the FRG recurrence index risk score can be a valuable prognostic instrument, given that patients with higher risk scores tend to exhibit poorer clinicopathological characteristics. Notably, PCa patients in the higher FRG recurrence index risk score group exhibited higher sensitivity to Abiraterone [Figure 5F] and Enzalutamide [Figure 5G], two commonly administered AR antagonists in hormonal therapy. These findings implied that, apart from the prognostic significance, our FRG recurrence index model could also serve as a reference for therapeutic interventions.
The convergence of the FRG recurrence index risk model with the PCa cell cycle pathway and tumor immune microenvironment
Based on the risk scores derived from our FRG recurrence index risk model, we categorized PCa patients into two cohorts: the high- and low-risk groups. To explore the underlying molecular mechanisms, we next employed the “limma” package to perform differential transcriptome analysis between these two cohorts. As a result, a total of 595 genes were filtered. To gain further insights into the linked biological functions and pathways, we subsequently conducted GO [Figure 5H] and KEGG [Figure 5I] enrichment analyses. The results indicated that these genes were significantly enriched in the cell cycle pathway, which drives cell growth and division. Aberrations of the cell cycle are linked to cancer progression and evasion from immune surveillance[36,37]. Consistently, we have confirmed a positive correlation between our FRG recurrence index risk scores and PCa progression [Figure 5A-E].
Next, we pursued the correlation between the FRG recurrence index risk scores and immune response in PCa patients. To explore the immune landscape in the PCa context, we employed the CIBERSORT algorithm to analyze TCGA PCa RNA-seq datasets. Our results indicated that prostate tumor tissues were infiltrated with a relatively higher proportion of M0/M1/M2 macrophages and regulatory T cells (Tregs), but a lower fraction of resting mast cells, monocytes, and naïve B cells [Figure 6A]. The distinct PCa immune infiltration profiles, particularly macrophages and mast cells, provide insights into the immune landscape of the PCa tumor immune microenvironment (TME). Further analysis revealed that in PCa, the risk score derived from our FRG recurrence index model was significantly positively correlated with the distributions of eosinophils, M0/M2 macrophages, monocytes, memory/naïve B cells, and neutrophils. Conversely, a significant negative correlation was noted between the FRG recurrence index risk scores and resting/activated mast cells [Figure 6B]. These findings indicated that our FRG recurrence index risk model, coupled with immune cell infiltration analysis, holds promise as a more predictive tool for forecasting PCa recurrence.
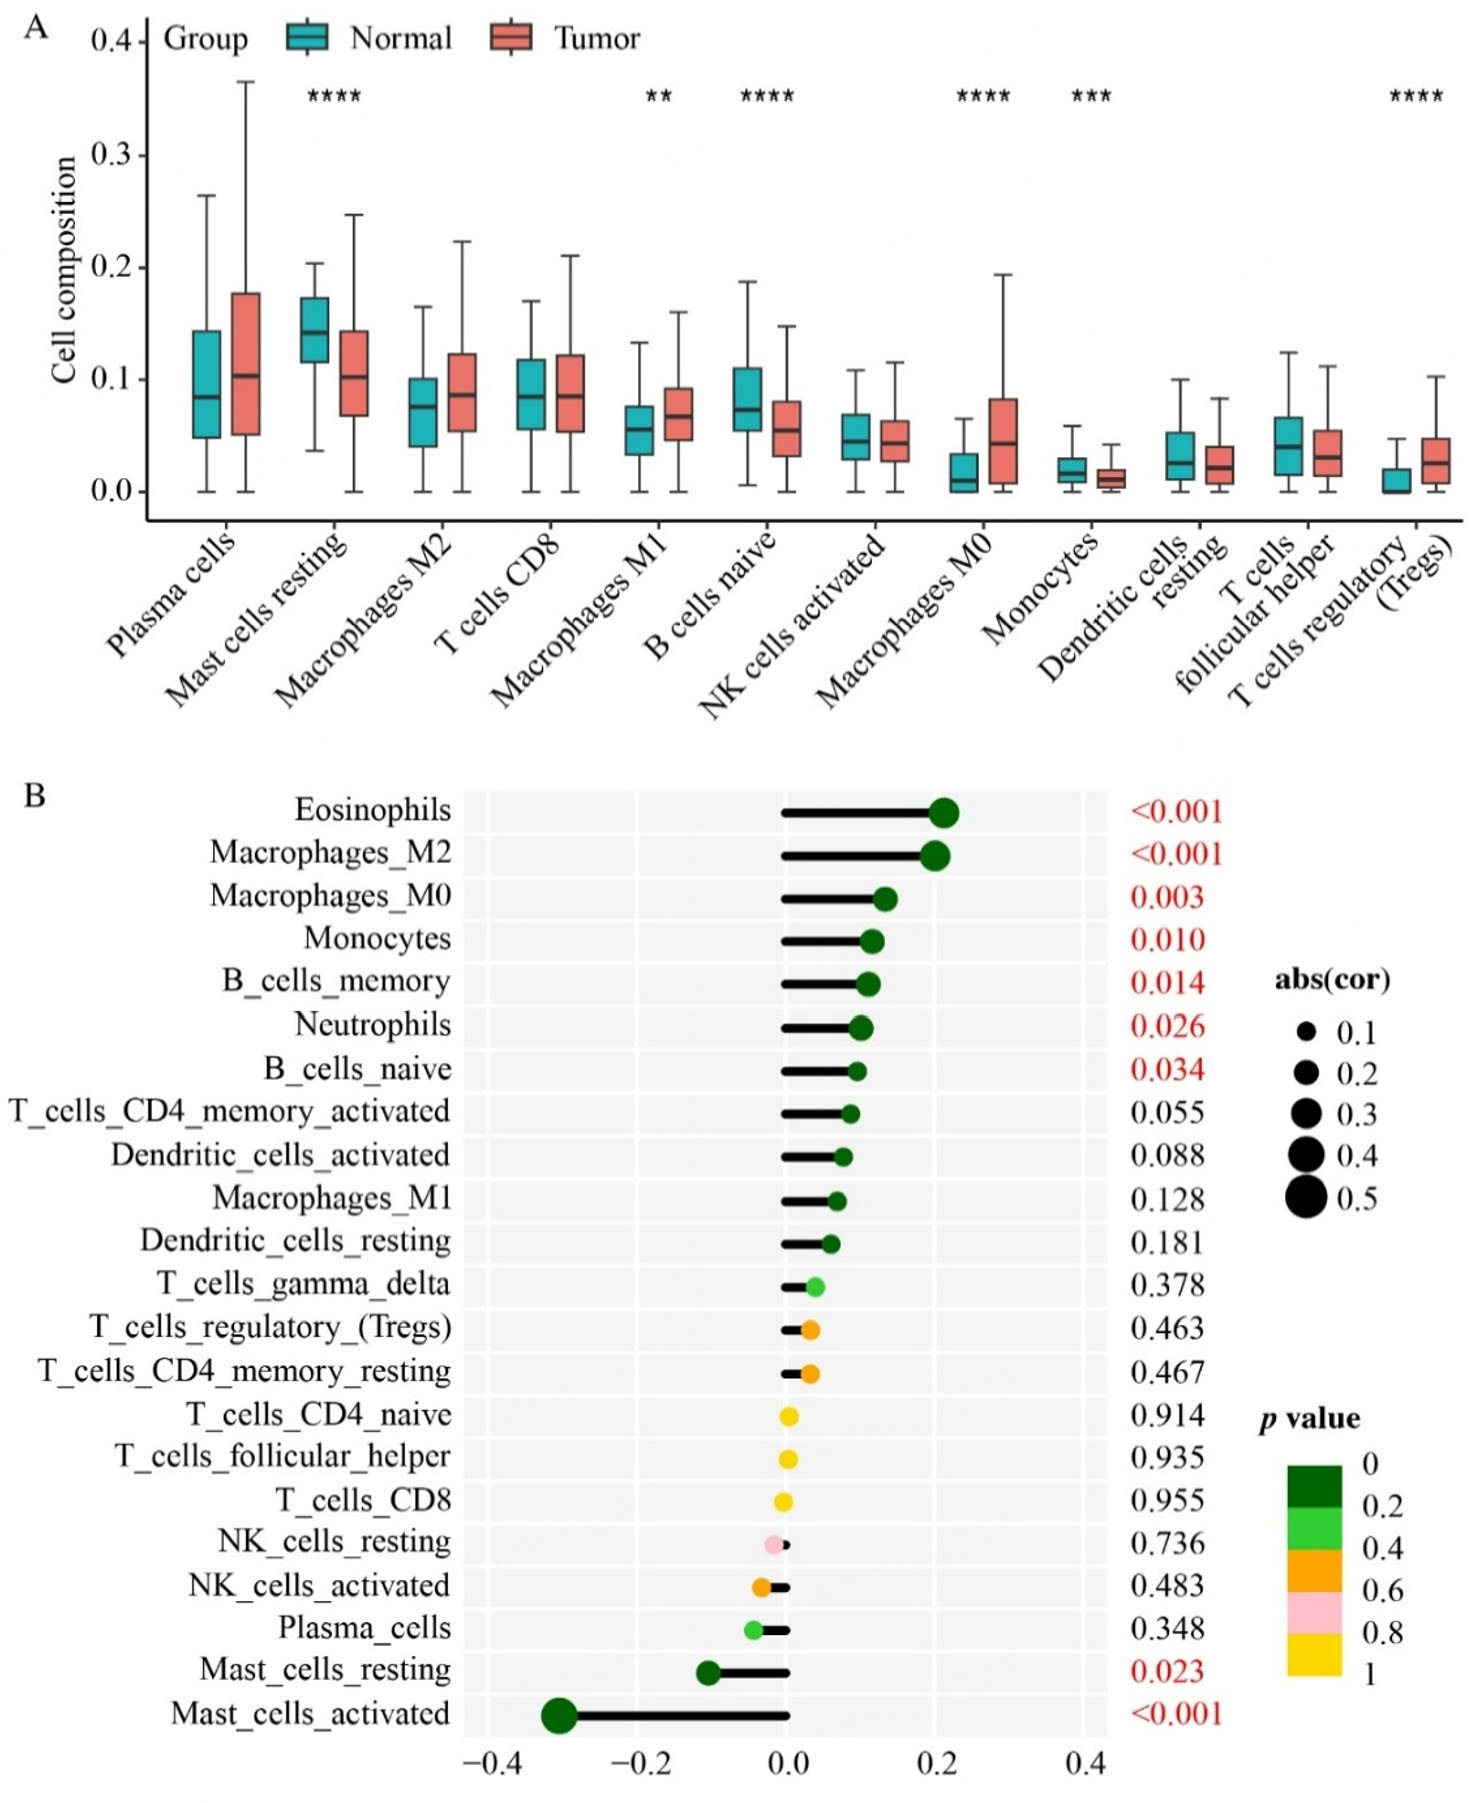
Figure 6. Immune landscape of the prostate tumor microenvironment. (A) Using the CIBERSORT algorithm, the differences in the infiltration of various immune cell types between prostate tumor and normal tissues are shown. (B) The correlations between the FRG recurrence index risk score and the infiltration levels of specific immune cell types are illustrated. **P < 0.01, ***P < 0.001,
The activated state of mast cells significantly affects the recurrence of prostate cancer patients
Next, we embarked on comprehensive analyses of the relapse-free probability in clinical PCa, by incorporating both the FRG recurrence index risk score and the infiltration patterns of various immune cells. Based on the result of the CIBERSORT algorithm analysis, we further conducted systematic profiling of immune infiltration in the TCGA PCa cohort of high and low FRG recurrence index risk, respectively. The results showed a significant association between the FRG recurrence index risk scores and the infiltration statuses of monocytes, M0/M2 macrophages, eosinophils, and activated mast cells. More specifically, the high FRG recurrence index risk cohort exhibited markedly increased infiltration of eosinophils, monocytes, and M0/M2 macrophages, whereas infiltration of activated mast cells was significantly reduced [Figure 7A].
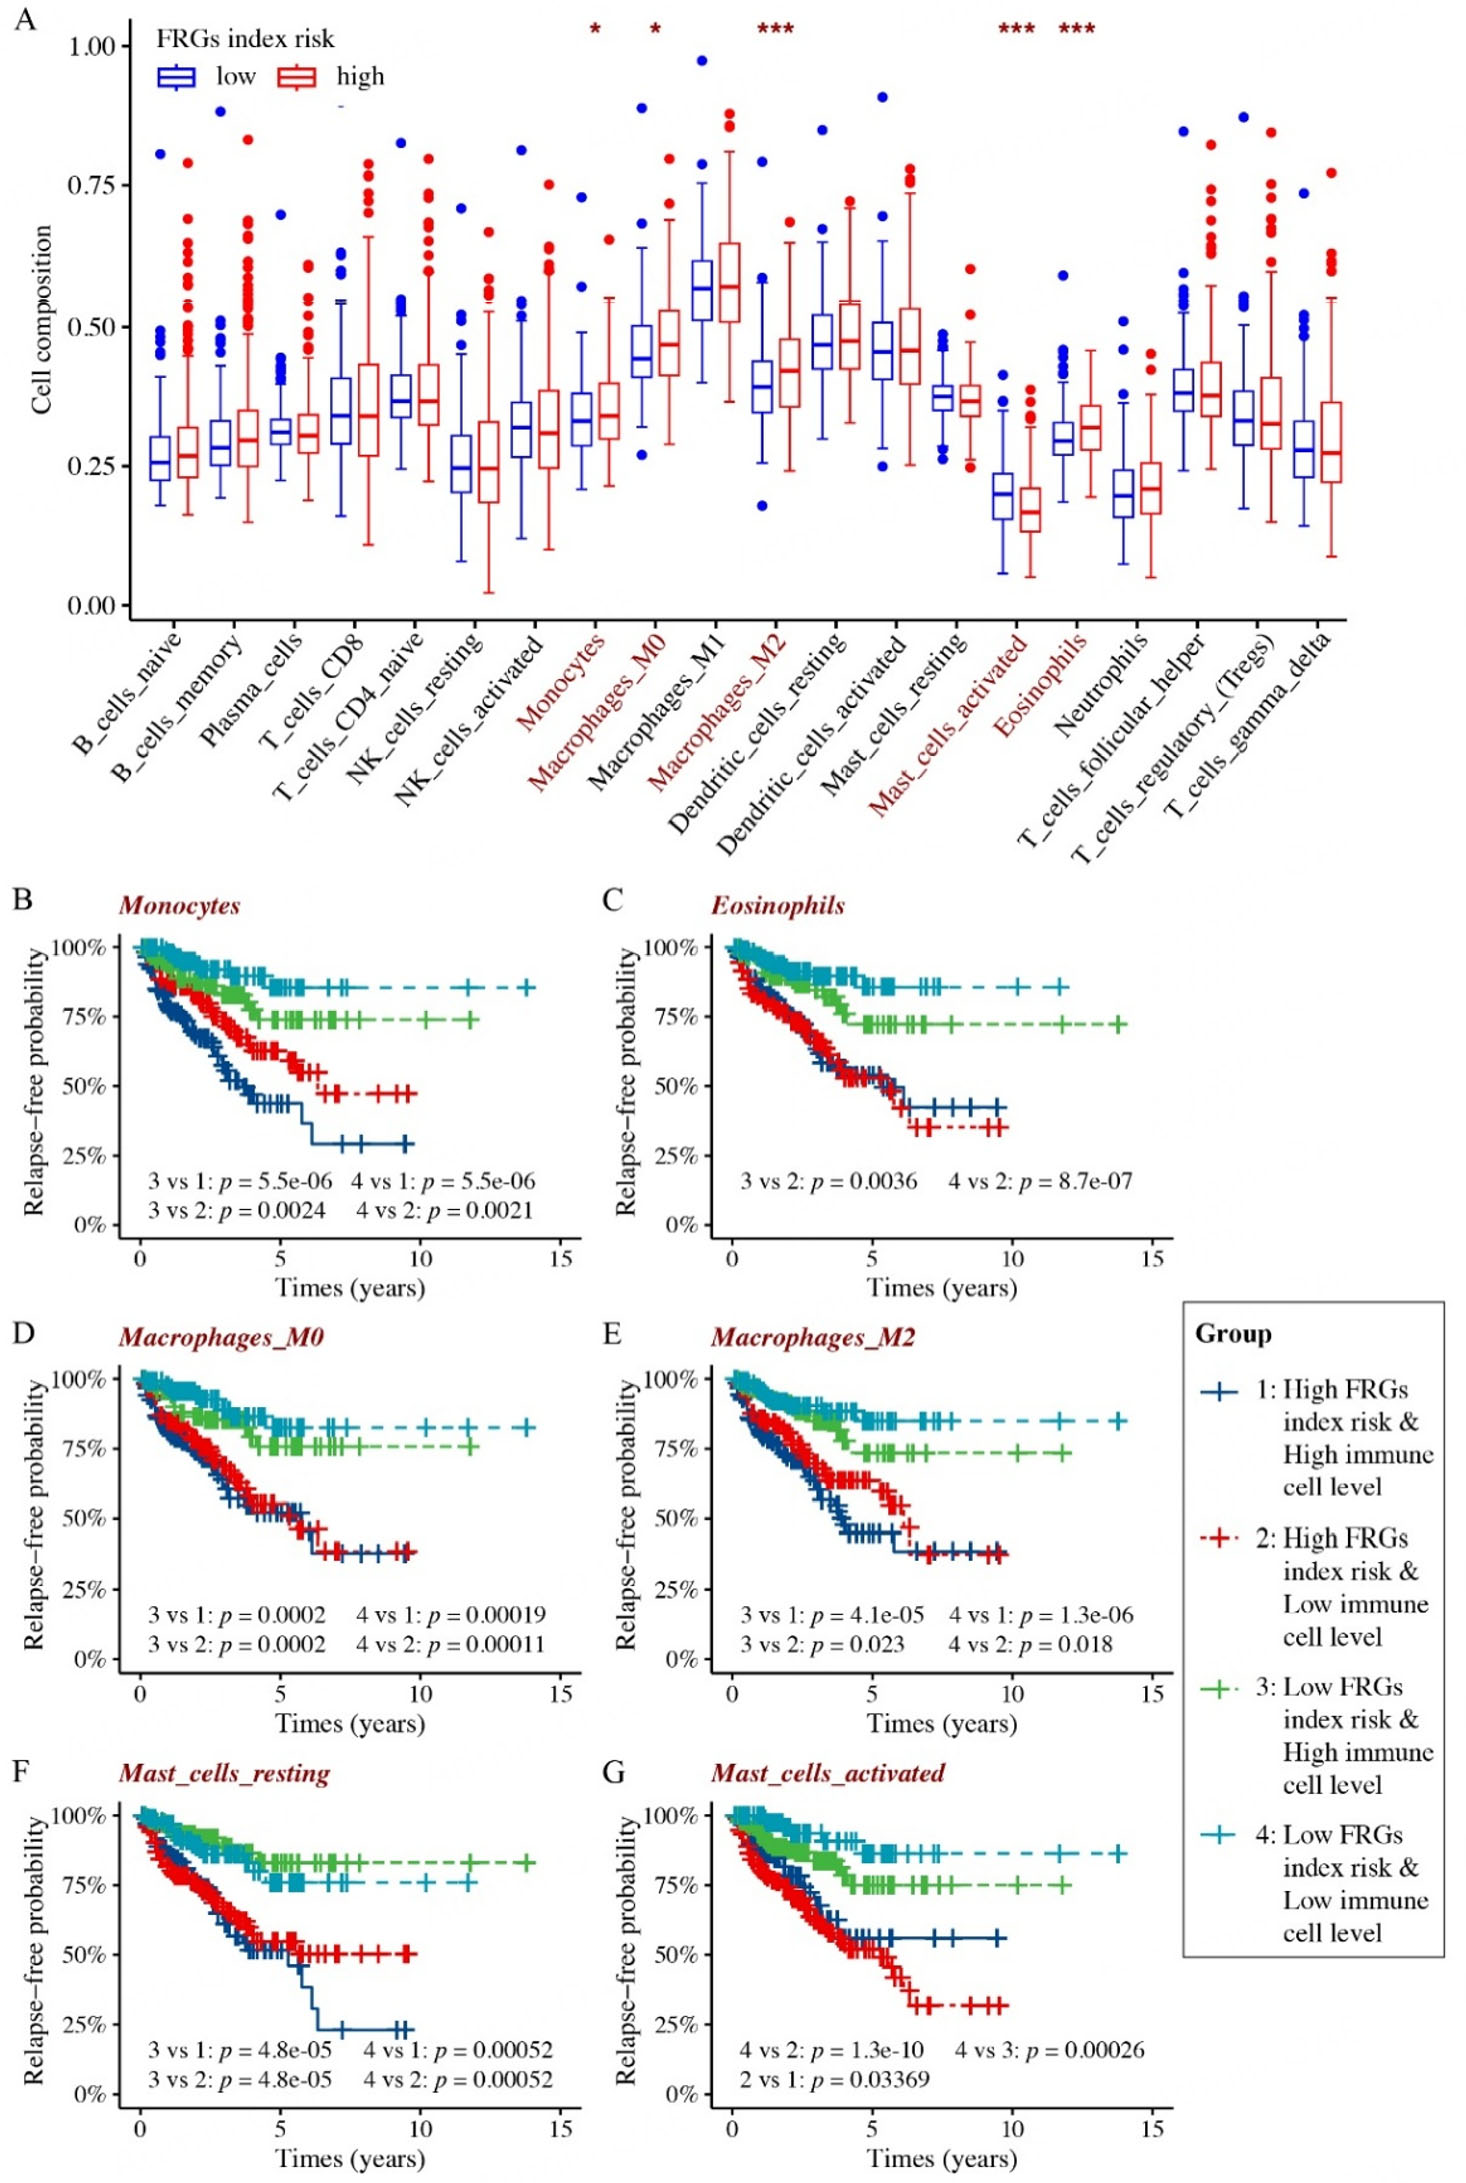
Figure 7. Outcomes of immuno-infiltration analysis combined with the FRG recurrence index risk score in TCGA prostate cancer patients. (A) Differences in immune infiltration between high- and low-risk FRG index prostate cancer cohorts. (B-G) Based on the FRG recurrence index risk score and the infiltration levels of specific immune cell types, TCGA prostate cancer patients were divided into four cohorts: 1. high FRG index risk and high immune cell infiltration; 2. high FRG index risk and low immune cell infiltration; 3. low FRG index risk and high immune cell infiltration; 4. low FRG index risk and low immune cell infiltration. Kaplan-Meier analyses comparing relapse-free survival probabilities among the four groups are presented. *P < 0.05, ***P < 0.001.
We subsequently performed relapse probability analysis to evaluate the prognostic value of our FRG recurrence index risk model, in conjunction with immune populations that exhibited significant differences between high and low FRG recurrence index risk of PCa cohorts. The PCa patients were categorized into four groups based on their FRG recurrence index risk score and immune cell infiltration status: (1) high FRG recurrence index risk and high immune cell infiltration; (2) high FRG recurrence index risk and low immune cell infiltration; (3) low FRG recurrence index risk and high immune cell infiltration; and (4) low FRG recurrence index risk and low immune cell infiltration.
The results showed that, independent of immune cell infiltration, our FRG index risk model alone remained predictive for PCa recurrence [Figure 7B-G]. Specifically, PCa patients with a high FRG index risk consistently exhibited poorer relapse outcomes compared to those with a low index risk, regardless of the level of immune cell infiltration. Among both the high and low FRG index risk groups, the infiltration levels of monocytes [Figure 7B], eosinophils [Figure 7C], macrophages M0/M2 [Figure 7D and E], and resting mast cells [Figure 7F] did not yield significant differences in terms of PCa recurrence. Notably, the status (resting or activated) of mast cells exerted diametrically opposed effects on both high and low FRG index risk groups [Figure 7F and G]. However, only the infiltration level of activated mast cells exhibited significant differences within both the high and low FRG index risk groups [Figure 7G]. This observation underscores the potential prognostic and therapeutic relevance of mast cell transition from a resting to an activated state in PCa. Critically, high FRG risk consistently predicts poorer outcomes regardless of mast cell state [Figure 7B-G]. Collectively, these findings emphasize the pivotal role of activated mast cells in the interplay between ferroptosis, cancer progression, and immune response, thereby necessitating the repositioning of mast cells in novel PCa immunotherapeutic strategies.
DISCUSSION
In this study, we established a FRG prognostic index for PCa recurrence. The model highlights that low expression of ferroptosis drivers (CDO1, ANO6, PTGS2) and high expression of inhibitors (NUPR1, KIF20A, EZH2) predict recurrence and correlate with DOX sensitivity. This suggests that blocking ferroptosis may contribute to increased PCa recurrence, and DOX may be effective in treating recurrent PCa, validating our FRG recurrence index.
Although some ferroptosis-related signatures have been reported in PCa[6,20], our FRG recurrence index stands out as a more systematically developed and rigorously validated model, having undergone exact scrutiny across eight PCa datasets. Our data revealed that our FRG index risk model could serve as an independent predictor of recurrence for PCa patients. The comprehensive univariate and multivariate Cox regression analyses showed that the risk score derived from our FRG index risk model is an independent predictor for recurrence of PCa patients, even when considering other clinicopathological factors such as age, pathological stage, and PSA level. Moreover, the FRG recurrence index could effectively reflect the progression of PCa. The PCa patients with higher FRG recurrence index risk scores always exhibited advanced pathological T and N stages, higher PSA levels, and higher tumor grades and stages, indicating a greater likelihood of relapse. These findings suggest that the FRG recurrence index may serve as a valuable prognostic instrument for predicting PCa progression.
Extensive investigations have definitively pinpointed cell cycle aberration as a hallmark of cancer, crucially involved in its initiation, progression, malignant transformation, and evasion from immune surveillance[36,37]. In our study, through enrichment analyses of differentially expressed genes between PCa cohorts with high and low FRG index risk, we discovered that these genes were significantly enriched in the cell cycle pathway. Based on the positive correlation we have confirmed between the FRG recurrence index risk scores and PCa progression, along with the crucial role of cell cycle in cancer progression, our findings indicate that our FRG recurrence index likely contributes to cancer progression by influencing cell cycle functions. Targeted investigations of ferroptosis-driven cell cycle dysregulation, including single-gene functional studies and cyclin network analyses, will be addressed in subsequent work.
On the other hand, given the pivotal role that the cell cycle plays in immunotherapy, we next investigated the correlation between our FRG recurrence index and the immune microenvironment of PCa. Previous studies have revealed that both macrophages and mast cells hold critical roles in cancer progression at least within recurrence[38]. Specifically, M2 macrophages are known to promote angiogenesis and tumor cell invasion, whereas M1 macrophages generally exhibit antitumor effects[39,40]. Mast cells, meanwhile, may have either pro-tumorigenic or anti-tumorigenic functions depending on the tumor type[41-43]. Research in PCa has demonstrated that patients with high levels of M2 macrophages face increased risk of mortality and biochemical recurrence[43-45], while the role of mast cells remains controversial[41,43]. In this study, we found that the FRG recurrence index risk score was significantly correlated with various immune cell infiltration levels in PCa patients. Notably, the status of mast cells showed opposite effects in high-risk vs. low-risk FRG recurrence index cohorts. Among these, only the infiltration levels of activated mast cells significantly influenced PCa recurrence in both risk groups. Interestingly, we observed that the transition of mast cells from a resting to an activated state may offer new insights into the interplay between immune responses and ferroptosis in cancer progression. This finding could potentially inform the development of novel immunotherapeutic strategies for PCa.
While these findings support the utility of our FRG recurrence index, key limitations include reliance on retrospective datasets (needing prospective validation), transcriptomics-only basis (requiring multi-omics integration), in vitro-only validation (needing in vivo/primary samples), computational dependency in immune analyses (needing spatial/multiplex methods for mast cells), and the need for clinical trials to confirm predicted drug sensitivity.
In summary, our study successfully established a FRG index risk model for predicting recurrence status in PCa patients. This FRG recurrence index risk model may serve as a valuable prognostic tool for clinical decision making and may provide insights into the underlying molecular mechanisms of PCa progression. Further studies are warranted to validate the prognostic value of this index in larger cohorts and to investigate the potential therapeutic implications of targeting these genes in PCa.
Conclusion
This study successfully identifies and validates a FRG index risk model for predicting PCa recurrence. The FRG index serves as an independent predictor of recurrence and correlates with clinicopathological characteristics and immune cell infiltration levels in PCa. These findings may provide insights into the mechanisms driving PCa progression and guide clinical decision making. Further studies are needed to validate its prognostic value and explore therapeutic implications.
DECLARATIONS
Acknowledgments
The authors acknowledge Dr. Zhenyu Jia and Dr. Ruidong Li for providing their PCaDB platforms. Appreciation is also given to the TCGA, GEO, and other publicly accessible databases, as well as the contributors who have uploaded their invaluable datasets.
Authors’ contributions
Writing - original draft, investigation, conceptualization, and funding acquisition: Wang LY
Writing - review & editing: Wang M, Fan MY, Jiang XY, Bing KJ, Wang YJ, Liang JQ
Writing - review & editing, Supervision: Wang KS, Huang YM
Availability of data and materials
All data generated or analyzed during this study are included in this published article and
Financial support and sponsorship
This work was supported by the Natural Science Basic Research Program of Shaanxi Province (#2023-JC-QN-0239), the National Department of Education Central Universities Research Fund (#GK202207004), the University-Industry Collaborative Education Program (#231005940204433) to Wang LY, and the National Natural Science Foundation of China (#82000512) to Huang YM.
Conflicts of interest
Wang KS is a Junior Editorial Board member of Journal of Cancer Metastasis and Treatment. Wang KS was not involved in any steps of editorial processing, notably including reviewer selection, manuscript handling, or decision making, while the other authors have declared that they have no conflicts of interest.
Ethical approval and consent to participate
All human cell lines used (LNCaP, VCaP, PC3, DU145, C4-2) were commercially obtained as anonymized, de-identified resources. As these cell lines carry no donor-associated identifiable information and were procured from certified biobanks, this study is exempt from ethical approval requirements per internationally recognized guidelines. All biosafety protocols were strictly followed in accordance with institutional regulations.
Consent for publication
Not applicable.
Copyright
© The Author(s) 2025.
Supplementary Materials
REFERENCES
2. Xia C, Dong X, Li H, et al. Cancer statistics in China and United States, 2022: profiles, trends, and determinants. Chin Med J. 2022;135:584-90.
3. Liang J, Wang L, Poluben L, et al. Androgen receptor splice variant 7 functions independently of the full length receptor in prostate cancer cells. Cancer Lett. 2021;519:172-84.
4. Wang H, Li N, Liu Q, et al. Antiandrogen treatment induces stromal cell reprogramming to promote castration resistance in prostate cancer. Cancer Cell. 2023;41:1345-62.e9.
5. Kotamarti S, Armstrong AJ, Polascik TJ, Moul JW. Molecular mechanisms of castrate-resistant prostate cancer. Urol Clin North Am. 2022;49:615-26.
6. Wang Y, Fan J, Chen T, et al. A novel ferroptosis-related gene prognostic index for prognosis and response to immunotherapy in patients with prostate cancer. Front Endocrinol. 2022;13:975623.
7. Salciccia S, Capriotti AL, Laganà A, et al. Biomarkers in prostate cancer diagnosis: from current knowledge to the role of metabolomics and exosomes. Int J Mol Sci. 2021;22:4367.
8. Farha MW, Salami SS. Biomarkers for prostate cancer detection and risk stratification. Ther Adv Urol. 2022;14:17562872221103988.
9. Litwin MS, Tan HJ. The diagnosis and treatment of prostate cancer: a review. JAMA. 2017;317:2532-42.
10. Adamaki M, Zoumpourlis V. Prostate cancer biomarkers: from diagnosis to prognosis and precision-guided therapeutics. Pharmacol Ther. 2021;228:107932.
11. Dixon SJ, Lemberg KM, Lamprecht MR, et al. Ferroptosis: an iron-dependent form of nonapoptotic cell death. Cell. 2012;149:1060-72.
12. Zhang C, Liu X, Jin S, Chen Y, Guo R. Ferroptosis in cancer therapy: a novel approach to reversing drug resistance. Mol Cancer. 2022;21:47.
13. Mou Y, Wang J, Wu J, et al. Ferroptosis, a new form of cell death: opportunities and challenges in cancer. J Hematol Oncol. 2019;12:34.
14. Liang D, Feng Y, Zandkarimi F, et al. Ferroptosis surveillance independent of GPX4 and differentially regulated by sex hormones. Cell. 2023;186:2748-64.e22.
15. Li D, Wang Y, Dong C, et al. CST1 inhibits ferroptosis and promotes gastric cancer metastasis by regulating GPX4 protein stability via OTUB1. Oncogene. 2023;42:83-98.
16. Li H, Yu K, Hu H, et al. METTL17 coordinates ferroptosis and tumorigenesis by regulating mitochondrial translation in colorectal cancer. Redox Biol. 2024;71:103087.
17. Yang F, Xiao Y, Ding JH, et al. Ferroptosis heterogeneity in triple-negative breast cancer reveals an innovative immunotherapy combination strategy. Cell Metab. 2023;35:84-100.e8.
18. Zhao L, Zhou X, Xie F, et al. Ferroptosis in cancer and cancer immunotherapy. Cancer Commun. 2022;42:88-116.
19. Ghoochani A, Hsu EC, Aslan M, et al. Ferroptosis inducers are a novel therapeutic approach for advanced prostate cancer. Cancer Res. 2021;81:1583-94.
20. Feng D, Shi X, Xiong Q, et al. A ferroptosis-related gene prognostic index associated with biochemical recurrence and radiation resistance for patients with prostate cancer undergoing radical radiotherapy. Front Cell Dev Biol. 2022;10:803766.
21. Li R, Zhu J, Zhong WD, Jia Z. PCaDB - a comprehensive and interactive database for transcriptomes from prostate cancer population cohorts; 2021.
22. Taylor BS, Schultz N, Hieronymus H, et al. Integrative genomic profiling of human prostate cancer. Cancer Cell. 2010;18:11-22.
23. Luca BA, Brewer DS, Edwards DR, et al. DESNT: a poor prognosis category of human prostate cancer. Eur Urol Focus. 2018;4:842-50.
24. Gerhauser C, Favero F, Risch T, et al. Molecular evolution of early-onset prostate cancer identifies molecular risk markers and clinical trajectories. Cancer Cell. 2018;34:996-1011.e8.
25. Nabila E. Expression array for multi-omics molecular profiling of primary prostate adenocarcinoma. BioStudies. 2018. Available from: https://www.ebi.ac.uk/biostudies/arrayexpress/studies/E-MTAB-6128 [Last accessed on 12 Aug 2025].
26. Ross-Adams H, Lamb AD, Dunning MJ, et al. Integration of copy number and transcriptomics provides risk stratification in prostate cancer: a discovery and validation cohort study. EBioMedicine. 2015;2:1133-44.
27. Jain S, Lyons CA, Walker SM, et al. Validation of a metastatic assay using biopsies to improve risk stratification in patients with prostate cancer treated with radical radiation therapy. Ann Oncol. 2018;29:215-22.
28. Long Q, Xu J, Osunkoya AO, et al. Global transcriptome analysis of formalin-fixed prostate cancer specimens identifies biomarkers of disease recurrence. Cancer Res. 2014;74:3228-37.
29. Sinha A, Huang V, Livingstone J, et al. The proteogenomic landscape of curable prostate cancer. Cancer Cell. 2019;35:414-27.e6.
30. Zhou N, Yuan X, Du Q, et al. FerrDb V2: update of the manually curated database of ferroptosis regulators and ferroptosis-disease associations. Nucleic Acids Res. 2023;51:D571-82.
31. van Leenders GJLH, van der Kwast TH, Grignon DJ, et al. The 2019 international society of urological pathology (ISUP) consensus conference on grading of prostatic carcinoma. Am J Surg Pathol. 2020;44:e87-99.
32. Amin MB, Greene FL, Edge SB, et al. The eighth edition AJCC cancer staging manual: continuing to build a bridge from a population-based to a more "personalized" approach to cancer staging. CA Cancer J Clin. 2017;67:93-9.
33. Seashore-Ludlow B, Rees MG, Cheah JH, et al. Harnessing connectivity in a large-scale small-molecule sensitivity dataset. Cancer Discov. 2015;5:1210-23.
34. Reinhold WC, Sunshine M, Liu H, et al. CellMiner: a web-based suite of genomic and pharmacologic tools to explore transcript and drug patterns in the NCI-60 cell line set. Cancer Res. 2012;72:3499-511.
35. Zhu Z, Shen H, Xu J, et al. GATA3 mediates doxorubicin resistance by inhibiting CYB5R2-catalyzed iron reduction in breast cancer cells. Drug Resist Updat. 2023;69:100974.
36. Malumbres M, Barbacid M. Cell cycle, CDKs and cancer: a changing paradigm. Nat Rev Cancer. 2009;9:153-66.
37. Li J, Stanger BZ. Cell cycle regulation meets tumor immunosuppression. Trends Immunol. 2020;41:859-63.
38. Rao L, Wu L, Liu Z, et al. Hybrid cellular membrane nanovesicles amplify macrophage immune responses against cancer recurrence and metastasis. Nat Commun. 2020;11:4909.
39. Pollard JW. Tumour-educated macrophages promote tumour progression and metastasis. Nat Rev Cancer. 2004;4:71-8.
40. Mantovani A, Sozzani S, Locati M, Allavena P, Sica A. Macrophage polarization: tumor-associated macrophages as a paradigm for polarized M2 mononuclear phagocytes. Trends Immunol. 2002;23:549-55.
41. Hempel Sullivan H, Maynard JP, Heaphy CM, et al. Differential mast cell phenotypes in benign versus cancer tissues and prostate cancer oncologic outcomes. J Pathol. 2021;253:415-26.
42. Noto CN, Hoft SG, DiPaolo RJ. Mast cells as important regulators in autoimmunity and cancer development. Front Cell Dev Biol. 2021;9:752350.
43. Sfanos KS. Immune cell infiltrates and prognosis in localized prostate cancer. J Pathol. 2022;256:135-8.
44. Erlandsson A, Carlsson J, Lundholm M, et al. M2 macrophages and regulatory T cells in lethal prostate cancer. Prostate. 2019;79:363-9.
Cite This Article
How to Cite
Download Citation
Export Citation File:
Type of Import
Tips on Downloading Citation
Citation Manager File Format
Type of Import
Direct Import: When the Direct Import option is selected (the default state), a dialogue box will give you the option to Save or Open the downloaded citation data. Choosing Open will either launch your citation manager or give you a choice of applications with which to use the metadata. The Save option saves the file locally for later use.
Indirect Import: When the Indirect Import option is selected, the metadata is displayed and may be copied and pasted as needed.
About This Article
Copyright

Data & Comments
Data
0


Comments
Comments must be written in English. Spam, offensive content, impersonation, and private information will not be permitted. If any comment is reported and identified as inappropriate content by OAE staff, the comment will be removed without notice. If you have any queries or need any help, please contact us at support@oaepublish.com.