


fig1
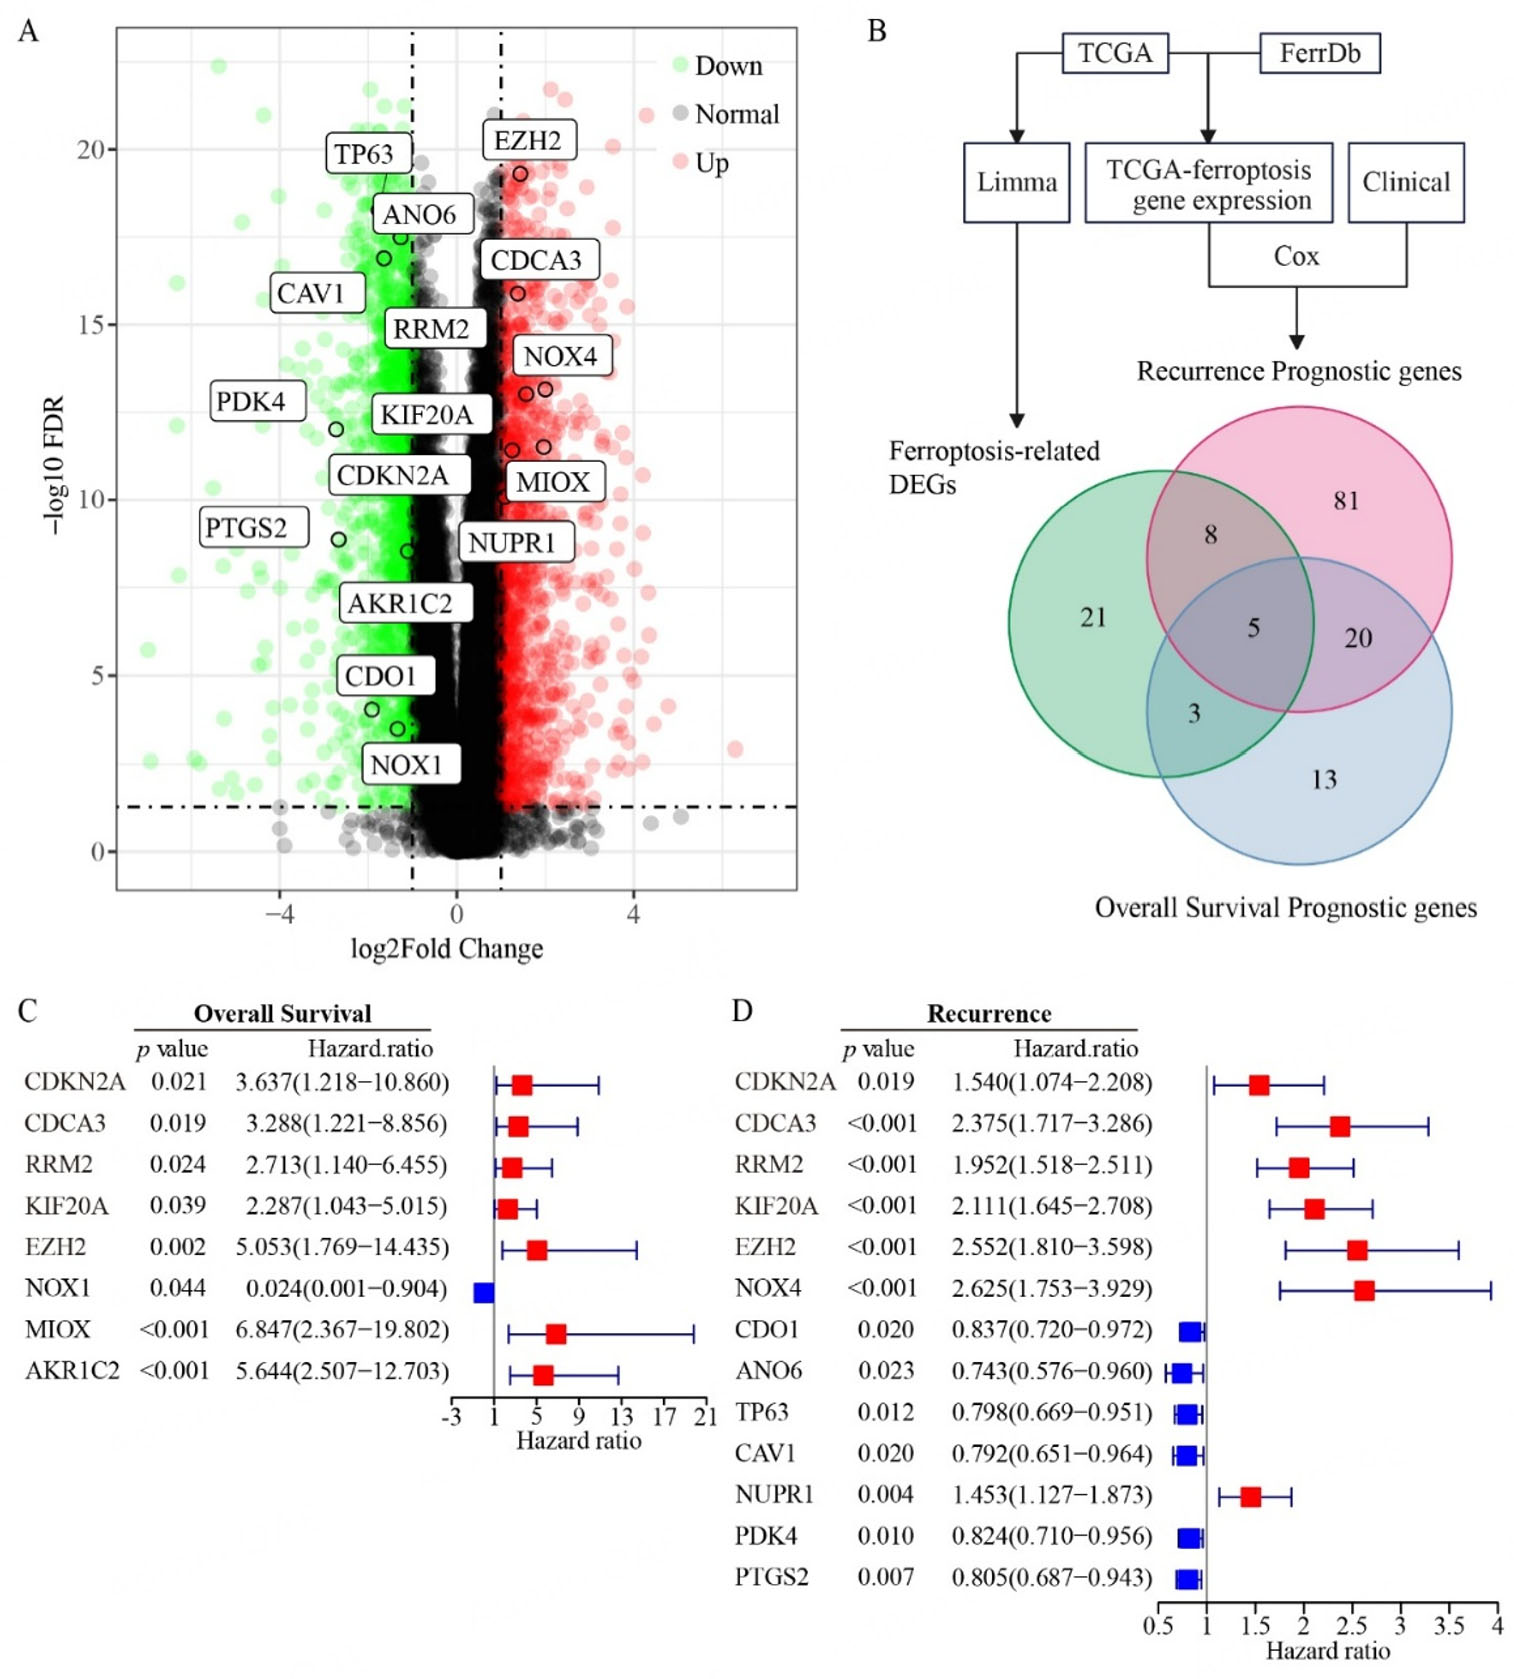
Figure 1. Identification of FRG prognostic genes in prostate cancer. (A) Volcano plot showing differentially expressed genes (DEGs) between prostate tumor and normal tissues from the TCGA dataset. (B) Venn diagram showing the overlap between DEGs of FRGs and prognostic genes for recurrence/overall survival. (C and D) Univariate Cox regression analysis of FRGs associated with overall survival (C) and recurrence (D) in prostate cancer. Sample sizes: normal tissues (n = 51); prostate tumors (n = 492).


