


fig2
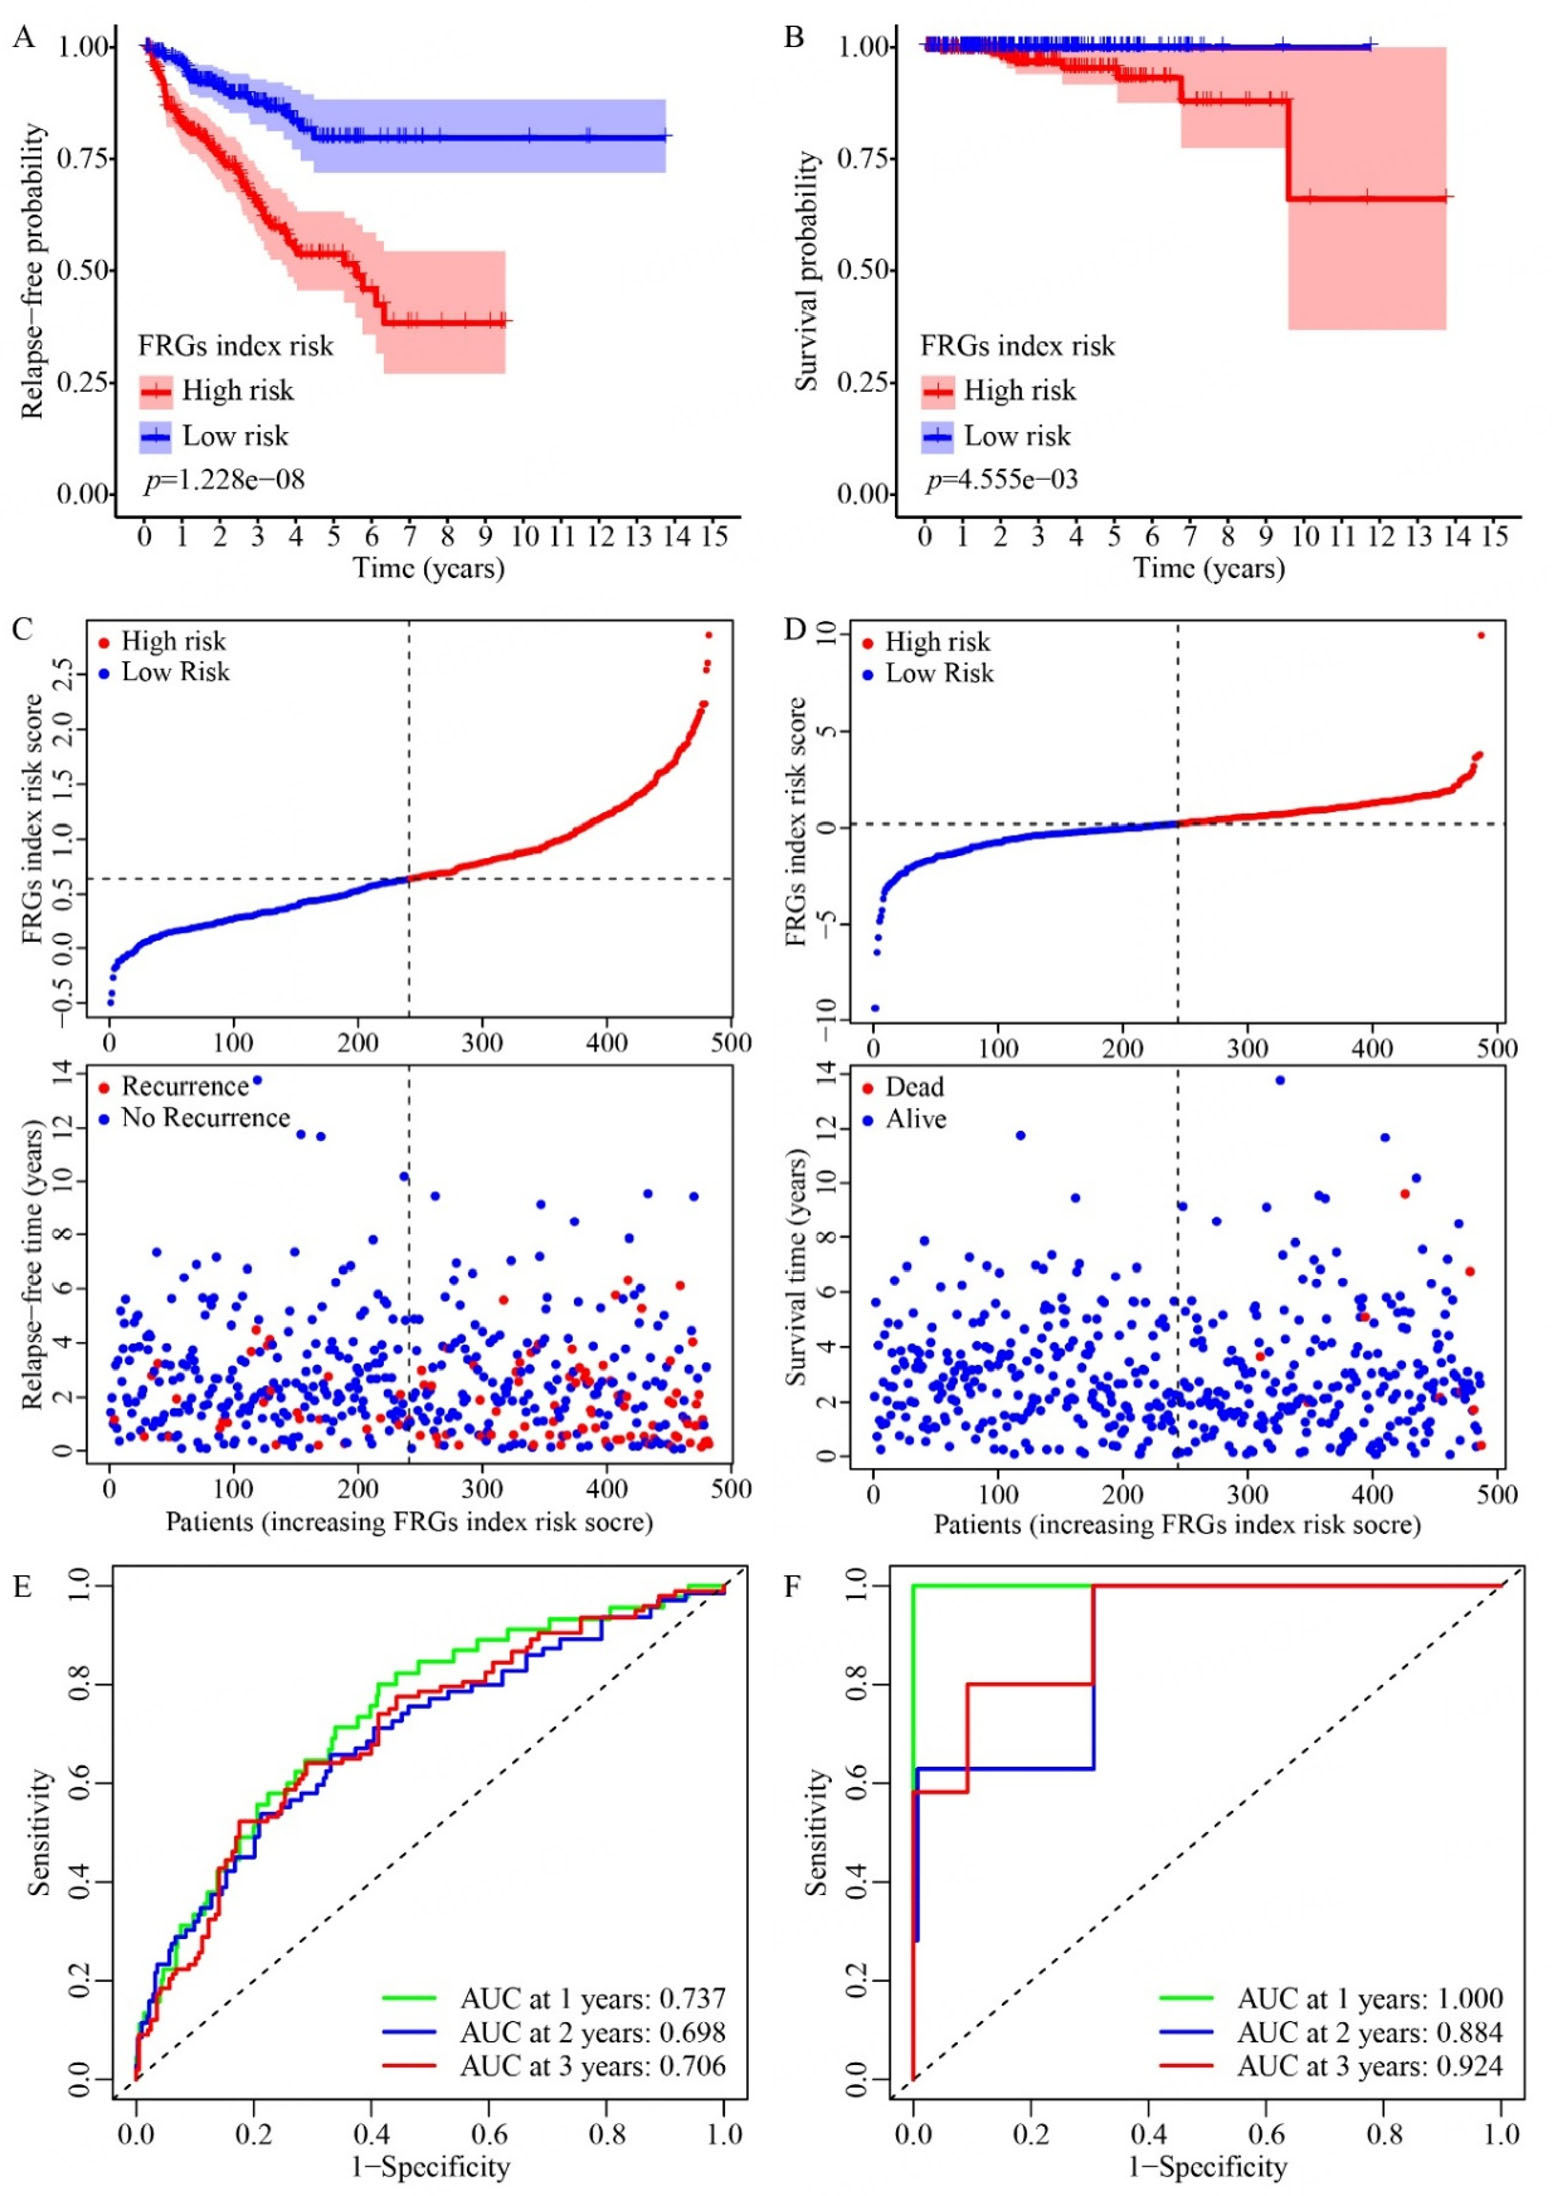
Figure 2. Analysis of relapse and survival patterns in TCGA prostate cancer patients based on the FRG prognostic index. (A and B) Kaplan-Meier curves show relapse-free probability (A) and overall survival (B) in high- and low-risk groups, classified according to the FRG prognostic model derived from LASSO Cox regression analysis. (C and D) Risk distribution plots visualize the risk scores and corresponding recurrence status (C) or survival status (D) of TCGA prostate cancer patients. (E and F) ROC curves illustrate the predictive performance of the FRG prognostic index for recurrence (E) and survival (F) at 1-, 2-, and 3-year intervals. n = 482.


