


fig4
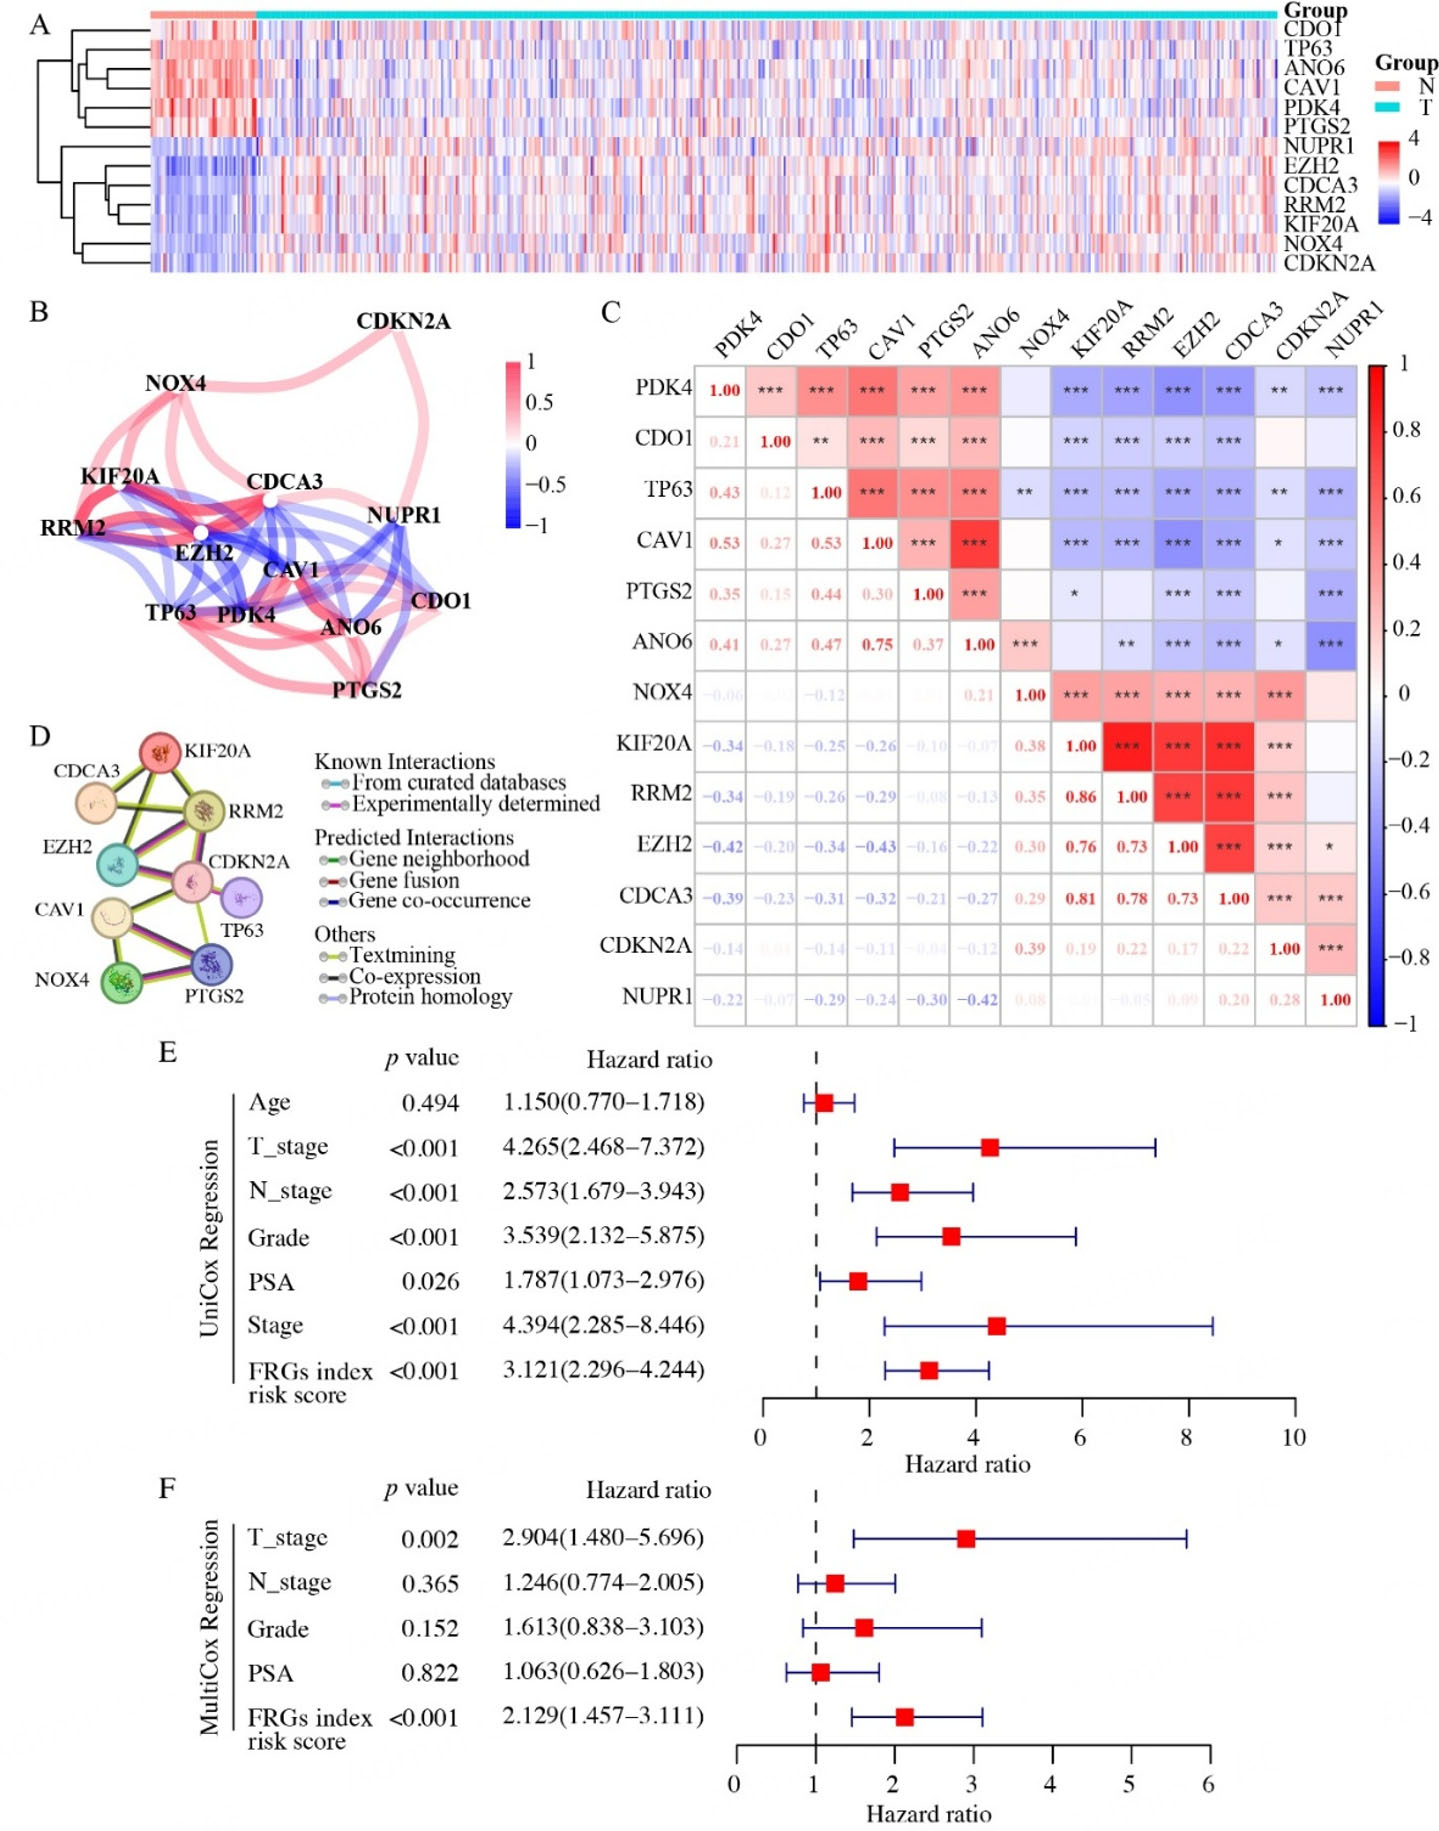
Figure 4. Expression patterns and prognostic value of the FRG recurrence index in TCGA prostate cancer. (A) Heatmap showing the expression profiles of 13 relapse-associated FRGs in TCGA prostate cancer samples. (B) Spearman correlation network of the selected FRGs. (C) Lower left panel: Pearson correlation coefficients between the selected relapse-associated FRGs. Upper right panel: results of statistical significance tests, with asterisks indicating significance levels (*P < 0.05, **P < 0.01, ***P < 0.001). (D) Interaction network of the selected FRGs retrieved from the STRING database. (E and F) Univariate (E) and multivariate (F) analyses of the prognostic value of the FRG recurrence risk score in TCGA prostate cancer patients, along with clinicopathological parameters. N: Normal tissue. T: tumor tissue. n (Normal) = 51, n (Prostate tumor) = 492.


