


The lnc-MAPKAPK5-AS1 promotes colon cancer-derived liver metastasis via modulating the tumor microenvironment: an in silico study and immunohistochemistry validation
 0
0 Abstract
Background: This study aimed to investigate the expression of lnc-MAPKAPK5-AS1 in colon cancer and its clinical implications for prognosis, liver metastasis, and tumor microenvironment (TME) regulation.
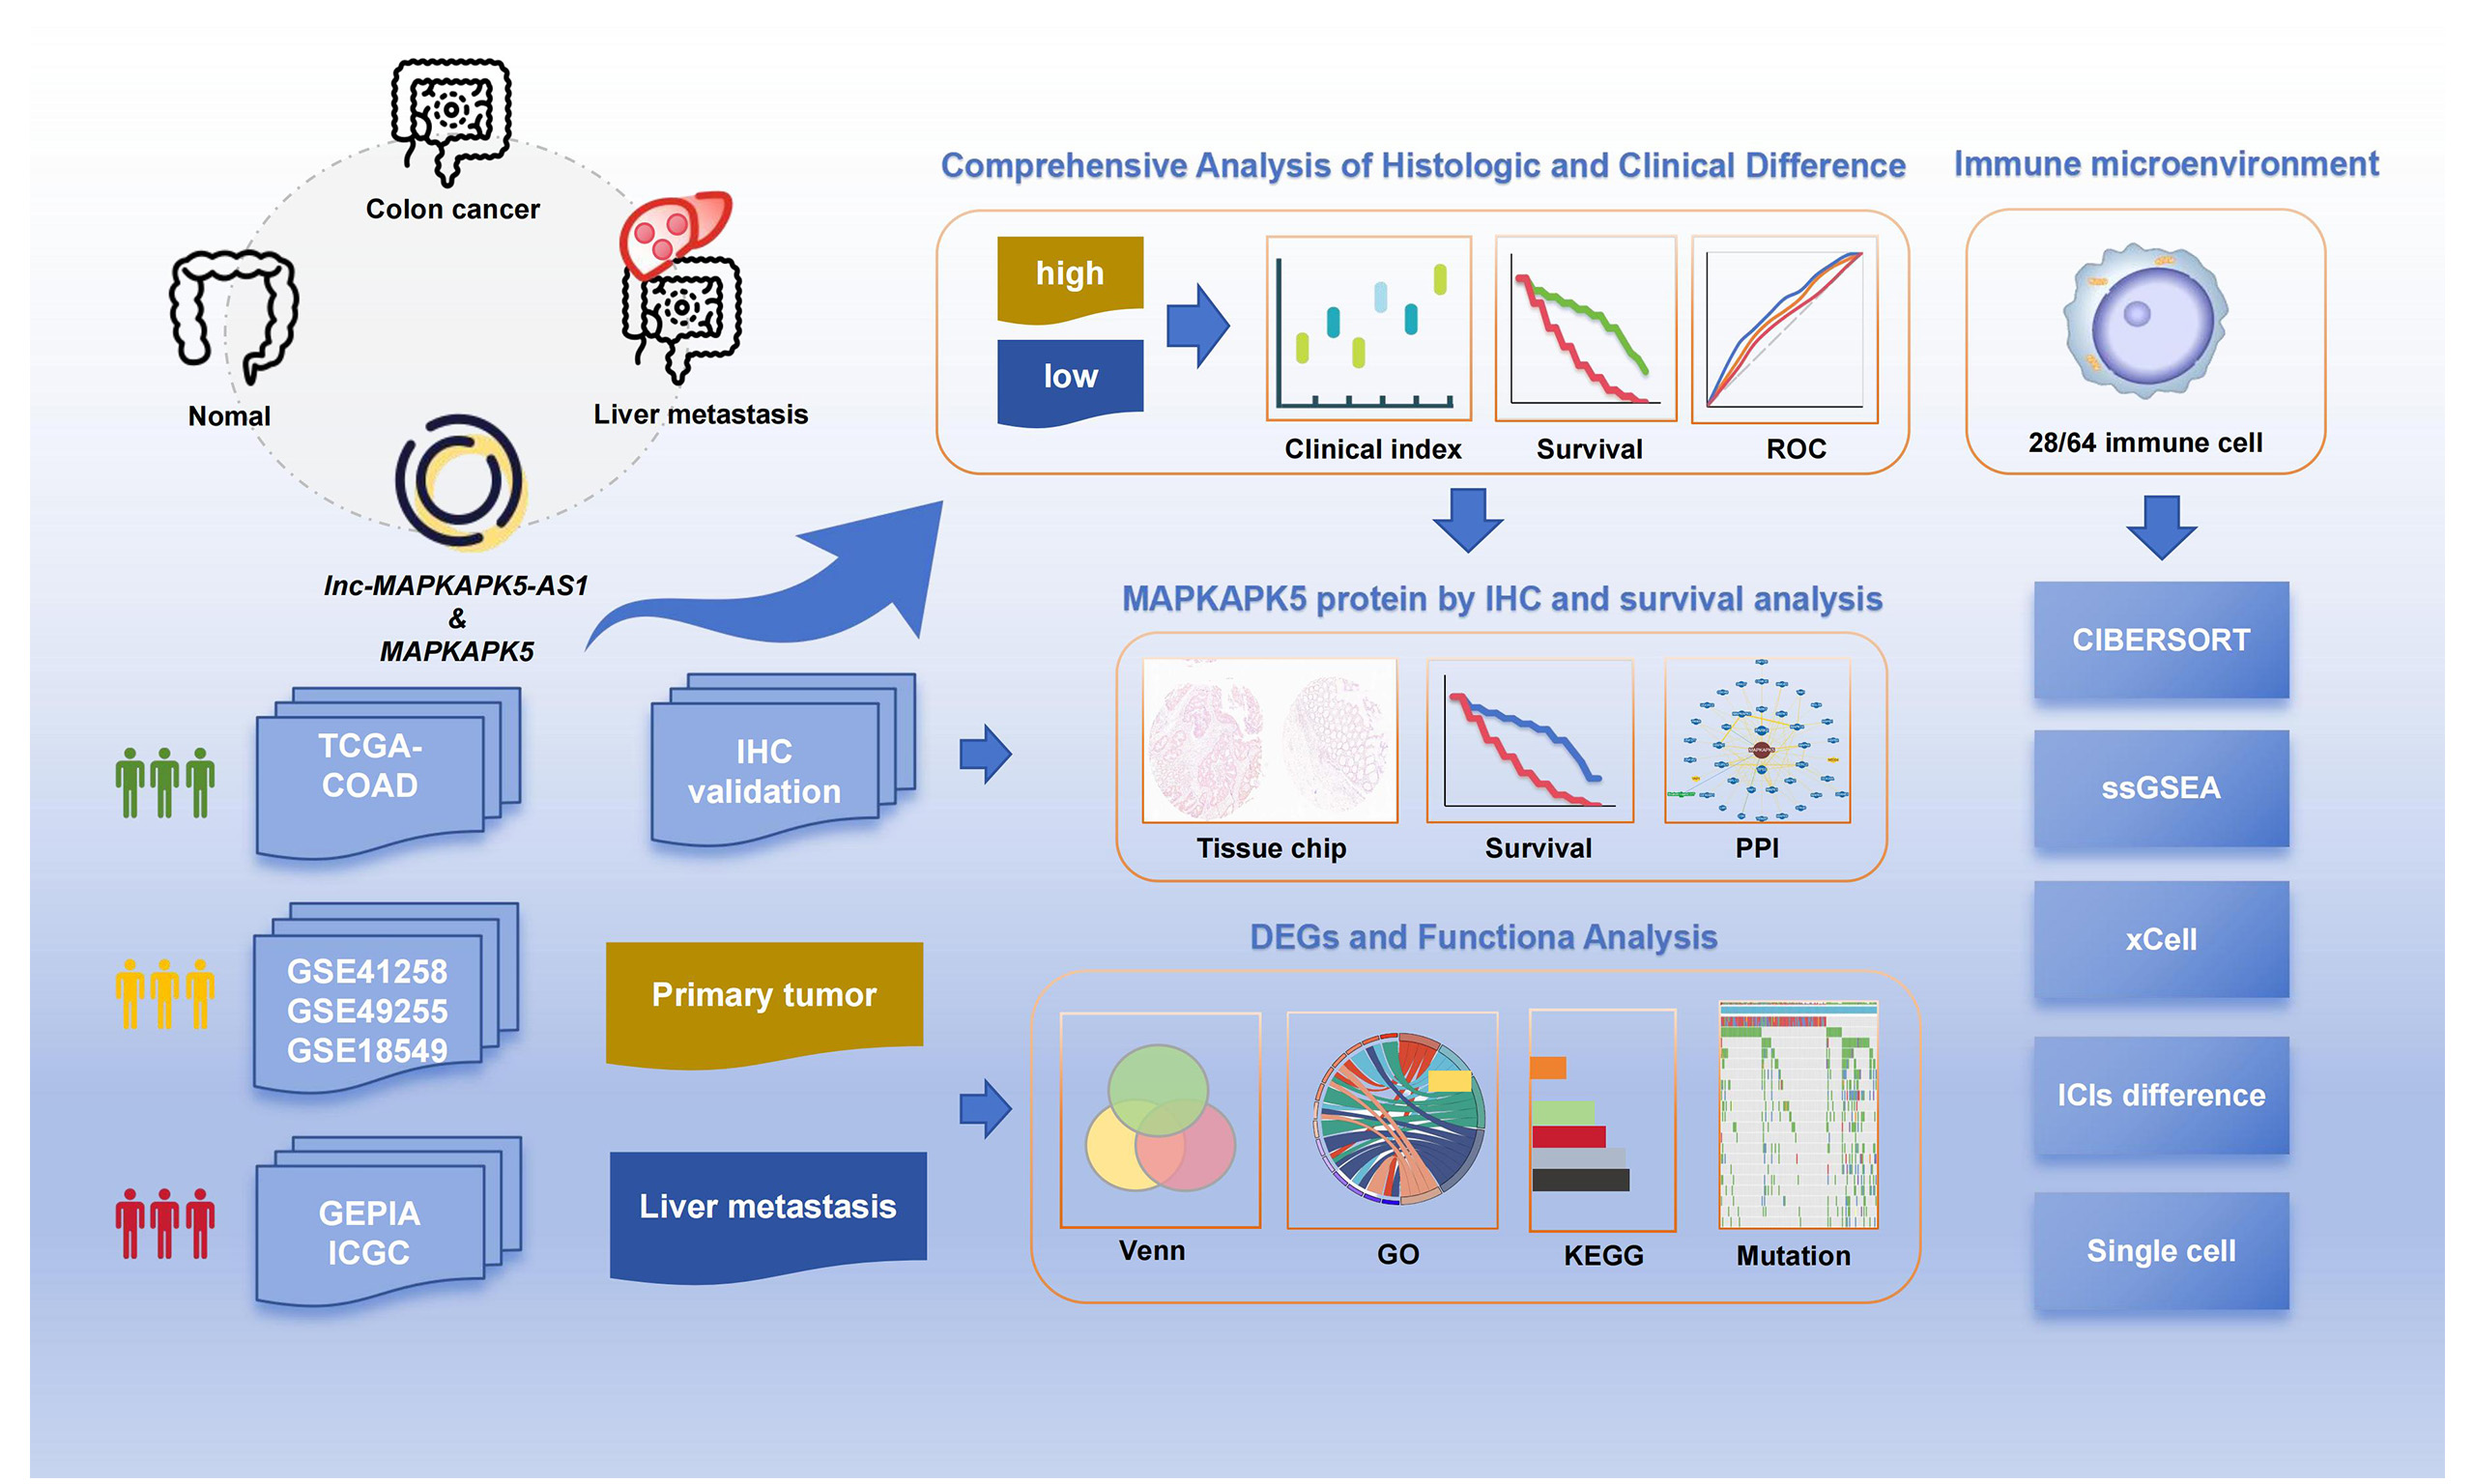
Methods: Through integrative analysis of public databases (TCGA, GEO, cBioPortal, David, BioGRID, etc.), we systematically evaluated the roles of lnc-MAPKAPK5-AS1 and MAPKAPK5 in colon cancer development, liver metastasis, immune microenvironment modulation, and associated biological pathways. Immune infiltration patterns were assessed using ESTIMATE, CIBERSORT, and xCell algorithms. MAPKAPK5 protein expression was further validated by immunohistochemistry.
Results: Lnc-MAPKAPK5-AS1 was upregulated in colon cancer tissues and correlated with poor clinical outcomes. Immunohistochemistry confirmed that MAPKAPK5 protein was strongly or moderately expressed in colon cancer tissues. Furthermore, compared with the colon cancer tissues in situ, patients with liver metastasis also showed elevated expression of lnc-MAPKAPK5-AS1. Functional enrichment analysis revealed that differentially expressed genes (DEGs) were primarily involved in amino acid and lipid metabolism pathways. In addition, immune infiltration analysis indicated that lnc-MAPKAPK5-AS1 expression was associated with multiple immune checkpoint inhibitors. The group with high gene expression showed increased infiltration abundance of regulatory T cells, gamma-delta T cells, and CD8+ naive T cells.
Conclusions: Lnc-MAPKAPK5-AS1 may serve as a potential oncogenic biomarker in colon cancer. Our findings indicate that its upregulation could contribute to tumor progression and liver metastasis, possibly by remodeling the TME via immune cell modulation, including potential alterations in the proliferation, differentiation, and functional states of key lymphocyte subsets.
Keywords
INTRODUCTION
Colorectal cancer is a highly prevalent and deadly malignant tumor worldwide. According to the International Agency for Research on Cancer (IARC), it ranks third in incidence among all cancers[1]. It is the most common gastrointestinal malignancy in China, with colon cancer accounting for ~40% of cases[2]. Furthermore, the incidence and mortality rates of colorectal cancer have been increasing over the past decade. Liver metastasis is the most common site of colorectal cancer metastasis and the leading cause of death. Current therapeutic interventions, including systemic therapy and liver resection, have been demonstrated to enhance the five-year survival rate of patients, but only ~25% of patients exhibit indications for surgical resection[3]. A survey indicates that 83% of colorectal cancer patients in China are already in the middle or late stages at the time of diagnosis, and 44% of those patients have developed distant metastases[4], indicating a significant challenge in effectively managing the disease. The liver, lungs, bones, and lymph nodes are frequently affected by metastasis in all malignancies. However, from another perspective, when evaluated in comparison with other malignant neoplasms, the prognosis of liver metastases from colorectal cancer is comparatively favorable. Recent advances in clinical research have enabled the widespread use of molecular biomarkers for the early diagnosis and prognosis assessment of colon cancer.
Long non-coding RNAs (lncRNAs) are a class of non-coding RNAs whose transcripts are more than 200 nucleotides in length. LncRNAs are involved in the process of regulation of gene expression in organisms, mainly through interactions with DNA, RNA or proteins. Antisense lncRNA refers to a class of RNA molecules that are transcribed by antisense chains of protein-coding genes and have partial sequences that overlap with their mRNA[5]. It is imperative to note that antisense lncRNAs frequently demonstrate a correlation with the expression of their sense genes. These molecules hold considerable potential to serve as novel biomarkers and therapeutic targets for neoplasms, as evidenced in recent studies[6]. For example, lnc-SLCO4A1-AS1 acted as an oncogene in colon cancer and affected tumor stemness properties by positively regulating SLCO4A1[7]. Chen et al. confirmed that lnc-GAS6-AS1 promoted TRIM14-mediated cell proliferation, migration, invasion, and epithelial-mesenchymal transition (EMT) in colorectal cancer through a ceRNA network and in a FUS-dependent manner[8].
Lnc-MAPKAPK5-AS1 (hereinafter MK5-AS1) is a natural antisense transcript originating from the opposite strand of the MAPKAPK5 (hereinafter MK5) gene locus. This cis-regulation configuration suggests potential functional interplay. It has been found to be dysregulated in a variety of diseases. A body of research has previously indicated the significance of the function of MK5-AS1 in the development and progression of colon[9,10]. However, comparatively limited research has been conducted on its role in the metastasis of colorectal cancer to the liver primary colon cancer tissues. The utilization of bioinformatics facilitates the acquisition of prognostic indicators through the efficient mining and analysis of data, drawing upon prior research findings. At present, liver metastasis is the predominant cause of mortality from colon cancer, so it is necessary to conduct targeted research. To elucidate the clinical and prognostic relevance of MK5-AS1 in colon cancer progression and metastasis, we performed an integrative bioinformatics analysis of multiple public databases and validated its expression patterns via immunohistochemistry. Our findings further revealed a critical role of MK5-AS1 in remodeling the TME. Collectively, these results suggest that upregulation of MK5-AS1 may facilitate colon cancer liver metastasis through immune-mediated mechanisms and inflammatory pathway activation.
MATERIAL AND METHODS
Data acquisition and processing
A total of 466 colon cancer samples were included in our research, including 427 colon cancer tissues and 39 normal tissues. The inclusion criteria for the study are as follows: (i) “TCGA-COAD” or “TCGA-READ” project; (II) Patients have complete clinical data (including age, gender, tumor size, lymph node status, distant metastasis, and treatment history, etc.). Exclusion criteria: (i) Non-colorectal cancer patients; (II) Serious lack of clinical data; (III) Patients who have received special treatment or suffer from other serious diseases. All transcriptomic sequencing data and corresponding clinical information were downloaded from the TCGA database (https://portal.gdc.cancer.gov/v1, accessed on 15 March 2023)[11].
Lnc-MAPKAPK5-AS1 expression was markedly increased in liver metastases relative to primary colon cancer tissues
To investigate the role of the target gene in promoting liver metastasis in colon cancer, the GSE41258 dataset was obtained from the GEO database (https://www.ncbi.nlm.nih.gov/geo/, accessed on 17 March 2023)[12]. Additionally, the transcriptome data from two additional microarray datasets, GSE49355 and GSE18549, were obtained on 18 March 2023, which both included pertinent information concerning primary colon cancer tissues and colon cancer liver metastases. According to the median expression levels of MK5-AS1 and MK5, the patients were divided into high and low expression groups. Additionally, the MK5-AS1 expression was extracted in different tissue types. Subsequently, we conducted a differential analysis of three datasets, comparing liver metastasis tissues and primary cancer tissues to identify a list of up- and downregulated genes. We then screened the intersection for additional GO and KEGG analysis, with the objective of gaining insight into the potential biological role of MK5-AS1 in colon cancer liver metastasis.
Batch effect correction and validation
Raw expression matrices were log2-transformed, and low-expressed genes (mean expression < 1) were filtered to enhance data quality. Common genes across all datasets were identified and merged into a combined expression matrix. To account for technical variability between datasets, we applied the ComBat algorithm (sva package), which utilizes parametric empirical Bayes frameworks to adjust for batch effects while preserving biological signals. The batch variable was defined based on the original GEO accession numbers. To evaluate the effectiveness of batch correction, we performed Principal Component Analysis (PCA) before and after adjustment and generated sample correlation heatmaps (pheatmap package) to assess inter-sample relationships post-normalization.
Immunohistochemistry for evaluation of MAPKAPK5 protein expression
To further verify the expression pattern and prognostic significance of MK5 at the protein level, a commercial colon cancer tissue chip (lot NO. HColA180su13; Shanghai, China) was procured. The microarray chip comprises 90 paired samples of colon adenocarcinoma tissues and their matched adjacent normal tissues collected from surgical patients between January and October 2009. These patients were subsequently followed up for an average of 5.7-6.5 years, during which their survival, recurrence, and metastasis statuses were meticulously documented. The IHC experiment was also conducted by the Shanghai Outdo Biotech Co., Ltd. The protocol was approved by the ethics committee of the aforementioned company (The approval code of the ethics committee is SHYJS-CP-1901001).
Construction of PPI network
BioGRID (https://thebiogrid.org)[13] is a publicly accessible database that archives and disseminates genetic and protein interaction data from model organisms and humans. Furthermore, it encompasses post-translational modifications of proteins and interactions with bioactive small molecules, derived from extant literature, including seminal low-throughput studies and substantial high-throughput datasets. We retrieved MK5 interacting proteins and utilized the PPI network to visualize the data. For each protein, detailed evidence is available online.
Functional enrichment analysis
The David database (https://david.ncifcrf.gov, accessed on 2 April 2023)[14] is a valuable resource for obtaining comprehensive biological function annotation information for large-scale gene or protein lists. To investigate the potential biological processes associated with MK5-AS1, the top 200 genes that are closely linked to MK5-AS1 expression were retrieved from the GEPIA database (http://gepia2.cancer-pku.cn/#index, accessed on 2 April 2023)[15]. These genes were subsequently imported into the David database for GO and KEGG analysis.
Gene mutation analysis
The cBioPortal database (https://www.cbioportal.org/)[16] is a powerful TCGA reanalysis platform that provides a user-friendly visual interface to display gene mutation profiles, changes in DNA copy number, DNA methylation status, and protein expression (accessed on 4 April 2023). Furthermore, somatic mutation data for colon adenocarcinoma patients were obtained from TCGA-COAD. Patients were stratified into high- and low-expression groups based on median expression levels of both MK5-AS1 and MK5. Additionally, the patients’ age annotations were added. Finally, we investigated the mutation disparities among the different groups and waterfall plots in Sangerbox
Immune infiltration analysis
To characterize the TME of colon cancer patients, we employed the “ESTIMATE” R package to compute stromal, immune, and combined ESTIMATE scores for each patient. The ImmuneScore and StromalScore quantify the relative abundance of immune and stromal components within the TME, respectively, while the ESTIMATE Score represents their cumulative measure.
For immune cell profiling, we performed deconvolution analysis of the gene expression matrix to estimate the infiltration levels of 22 distinct immune cell subtypes in each sample. Additionally, we applied xCell[18], a single-sample gene set enrichment analysis (ssGSEA) algorithm, to determine the relative abundance of 64 cell types spanning five major categories: adaptive immune cells, innate immune cells, hematopoietic progenitor cells, epithelial cells, and extracellular matrix components.
Statistical analysis
Statistical analysis and result visualization were performed using R-4.2.1 and GraphPad Prism 8.0. The differences between the groups were compared using two-sided Student’s t test or Mann-Whitney U test. A Chi-square test was applied to assess the association between gene expression and clinicopathological features. Survival analysis was implemented using the log-rank test to evaluate the difference in prognosis among different groups. To analyze the predictive power of gene expression on the prognosis of patients with colon cancer, ROC curves were developed and visualized by the “pROC” package. To minimize the impact of potential confounding factors, stratified prognostic analyses were further carried out. Univariate and multivariate Cox regressions were employed to calculate hazard ratios (HR) and 95% confidence intervals (CI), thereby identifying independent risk factors for colon cancer. HR values were used to assess the effect of different prognostic factors on cancer progression; if HR > 1, it means that the prognostic factors increase the risk of death of the patient, and vice versa, it decreases the risk of death.
In the analysis of IHC validation, a curve plot between statistical power and sample size was created using the “Tests for Two Survival Curves Using Cox’s Proportional Hazards Model” module of PASS software. In our study, the probabilities of an event were set as Pev1 = 0.25 for the MK5 low expression group and
RESULTS
Gene expression analysis
By downloading the transcriptome data from public databases, we investigated the expression patterns of MK5-AS1 and MK5 in colon cancer patients and normal tissues. As indicated by the results of the TCGA, the expression levels of the two aforementioned genes were found to be elevated in colon cancer tissues (Figure 1A, P < 0.001). The results were then verified using the GSE41258 dataset and the online prediction tool GEPIA 2.0 (Figure 1B and C; both P < 0.05). Furthermore, significant positive correlations were observed between the two genes in TCGA-COAD and GEO datasets (R = 0.33, P = 1.7 × 10⁻⁷; R = 0.45,
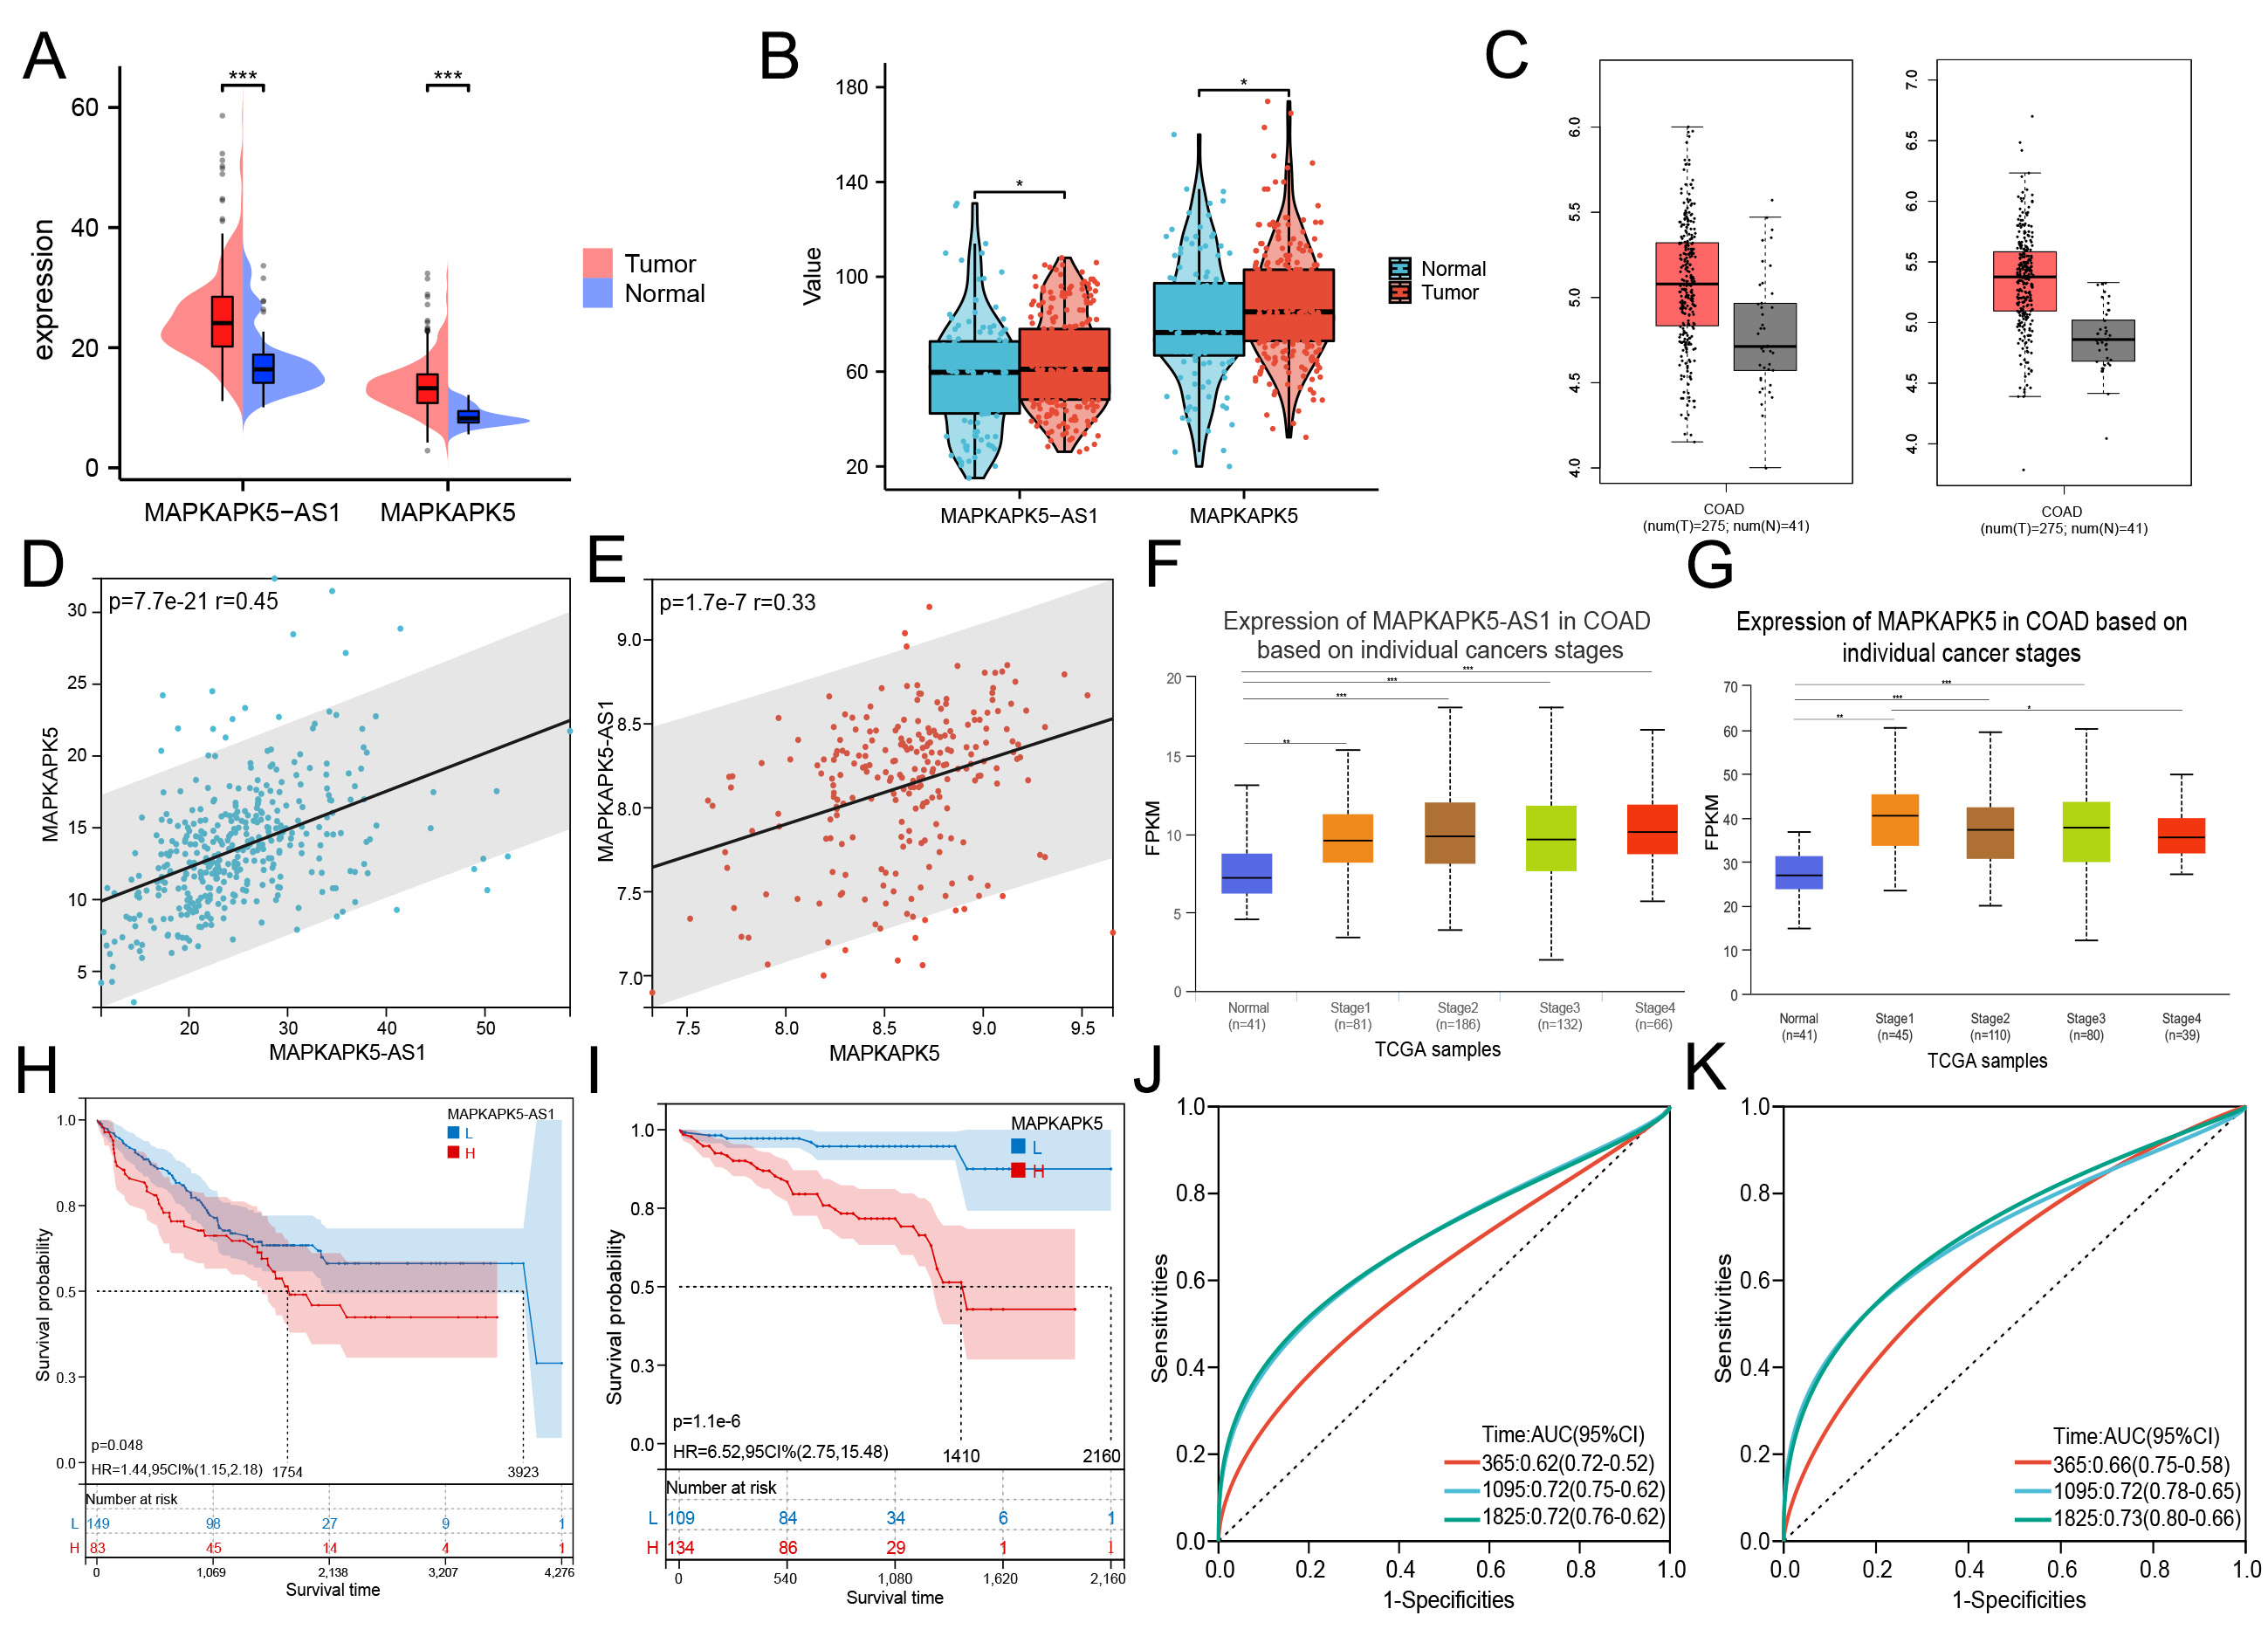
Figure 1. Differential expression of MK5-AS1 and MK5 in colon cancer compared to normal tissues and clinical prognosis analysis. (A-C) Comparison of MK5-AS1 and MK5 expression in colon cancer tissues and normal tissues based on TCGA-COAD, GSE41258, and GEPIA 2.0. (D and E) Significant positive correlations were observed between MK5-AS1 and MK5 expression in TCGA-COAD patients and GSE41258. (F and G) Expression status of MK5-AS1 and MK5 in patients with different clinical stages based on the UALCAN database. (H-K) Prognostic analysis of MK5-AS1, MK5 and ROC curves of corresponding 1, 3, and 5-year survival rates. *P < 0.05, **P < 0.01, ***P < 0.001.
Batch effect assessment and correction validation
The pre-correction PCA plot [Supplementary Figure 1A] revealed clear separation of samples by their dataset origin (GSE18549, GSE41258, and GSE49355) along principal components, with distinct clustering patterns indicating substantial technical variation between platforms. After ComBat adjustment
Correlation between gene expression and clinicopathologic features
Using the online website UALCAN (https://ualcan.path.uab.edu/, accessed on 5 April 2023)[19], we employed the expression levels of MK5-AS1 and MK5 in colon cancer patients with varying clinical stages. As illustrated by the box plots, elevated levels of MK5-AS1 and MK5 were found to be associated with more advanced clinical stages [Figure 1F and G]. As shown in Table 1, cases in which the expression level of MK5-AS1 was higher than the average of normal tissues were considered the gene overexpressed group, and vice versa, the low expression group. The MK5-AS1 high expression group showed a higher proportion of females (P = 0.047), Caucasians (P = 0.045), and patients with synchronous colon cancer (P = 0.037) compared to the low expression group. At the same time, the higher gene expression was associated with higher levels of BMI (P = 0.049), N stage (P = 0.047), and lymphatic invasion (P = 0.028), which also means that these patients have a higher risk of developing stage III or stage IV (P = 0.024). In addition, MK5-AS1 expression varied across anatomic neoplasm subtypes (P = 0.026). For its encoded protein MK5, as shown in Table 2, the high expression group included a higher proportion of male patients (P = 0.023), cases classified as adenocarcinoma (P = 0.011), and patients with higher N stage (P = 0.039). In addition, the composition of anatomical tumor subdivisions was also different in the high and low expression groups (P = 0.001).
Association between lnc-MAPKAPK5-AS1 expression and clinicopathological parameters in TCGA-COAD samples
| Characteristics | n | Lnc-MAPKAPK5-AS1 expression | χ2 | P-value | |
| High (n = 364) | Low (n = 63) | ||||
| Sex | 3.938 | 0.047 | |||
| Male | 200 | 164(82.0) | 36(18.0) | ||
| Female | 223 | 198(88.8) | 25(11.2) | ||
| Age | 1.868 | 0.172 | |||
| Age ≤ 60 | 125 | 102(81.6) | 23(18.4) | ||
| Age > 60 | 302 | 262(86.8) | 40(13.2) | ||
| Race | 6.218 | 0.045 | |||
| Black | 58 | 53(91.4) | 5(8.6) | ||
| White | 206 | 165(80.1) | 41(19.9) | ||
| Asian | 10 | 10(100.0) | 0(0) | ||
| Missing | 153 | 136(88.9) | 17(11.1) | ||
| Histological type | 0.015 | 0.904 | |||
| Colon adenocarcinoma | 378 | 323(85.4) | 55(14.6) | ||
| Colon mucinous adenocarcinoma | 46 | 39(84.8) | 7(15.2) | ||
| Missing | 3 | 2(66.7) | 1(33.3) | ||
| Clinical stage | 5.121 | 0.024 | |||
| I, II | 258 | 213(82.6) | 45(17.4) | ||
| III, IV | 159 | 144(90.6) | 15(9.4) | ||
| Missing | 10 | 6(60.0) | 4(40.0) | ||
| T | 0.304 | 0.581 | |||
| T1, T2 | 84 | 70(83.3) | 14(16.7) | ||
| T3, T4 | 343 | 294(85.7) | 49(14.3) | ||
| N | 3.963 | 0.047 | |||
| N0 | 243 | 201(82.7) | 42(17.3) | ||
| N1 | 166 | 149(89.8) | 17(10.2) | ||
| Missing | 18 | 14(77.8) | 4(22.2) | ||
| M | 2.455 | 0.117 | |||
| M0 | 305 | 257(84.3) | 48(15.7) | ||
| M1 | 62 | 57(91.9) | 5(8.1) | ||
| Missing | 60 | 50(83.3) | 10(16.7) | ||
| BMI | 3.880 | 0.049 | |||
| 18.5-23.9 | 55 | 41(74.5) | 14(25.5) | ||
| Abnormal value | 171 | 147(86.0) | 24(14.0) | ||
| Missing | 201 | 176(87.6) | 25(12.4) | ||
| Residual tumor | 2.914 | 0.088 | |||
| R0 | 310 | 259(83.5) | 51(16.5) | ||
| R1, R2 | 26 | 25(96.2) | 1(3.8) | ||
| Missing | 90 | 80(88.9) | 11(11.1) | ||
| Anatomic neoplasm subdivision | 9.294 | 0.026 | |||
| Ascending colon | 1 | 0(0) | 1(100.0) | ||
| Cecum | 105 | 84(80.0) | 21(20.0) | ||
| Sigmoid colon | 141 | 124(87.9) | 17(12.1) | ||
| Others | 154 | 134(87) | 20(13.0) | ||
| Missing | 26 | 22(84.6) | 4(15.4) | ||
| Lymph node examined count | 0.277 | 0.599 | |||
| ≤ 10 | 32 | 26(81.2) | 6(18.8) | ||
| > 10 | 374 | 317(84.8) | 57(15.2) | ||
| Missing | 21 | 21(100.0) | 0(0) | ||
| Venous invasion | 3.575 | 0.059 | |||
| Yes | 284 | 235(82.7) | 49(17.3) | ||
| No | 89 | 81(91.0) | 8(9.0) | ||
| Missing | 54 | 48(88.9) | 6(11.1) | ||
| Lymphatic invasion | 4.843 | 0.028 | |||
| Yes | 240 | 191(81.3) | 49(17.3) | ||
| No | 145 | 137(94.5) | 8(5.5) | ||
| Missing | 39 | 36(92.3) | 3(7.7) | ||
| Synchronous colon cancer present | 4.339 | 0.037 | |||
| Yes | 362 | 304(84.0) | 58(16.0) | ||
| No | 23 | 23(100.0) | 0(0) | ||
| Missing | 42 | 37(88.1) | 5(11.9) | ||
| History of colon polyps | 0.824 | 0.364 | |||
| Yes | 235 | 201(85.5) | 34(14.5) | ||
| No | 127 | 104(81.9) | 23(18.1) | ||
| Missing | 65 | 59(90.8) | 6(9.2) | ||
| Colon polyps present | 0.007 | 0.931 | |||
| Yes | 136 | 113(83.1) | 23(16.9) | ||
| No | 79 | 66(83.5) | 13(16.5) | ||
| Missing | 212 | 185(87.3) | 27(12.7) | ||
| Loss of mismatch repair protein expression by IHC | 0.666 | 0.415 | |||
| Yes | 55 | 45(81.8) | 10(18.2) | ||
| No | 266 | 229(86.1) | 37(13.9) | ||
| Missing | 106 | 90(84.9) | 16(15.1) | ||
| Number of first-degree relatives with cancer diagnosis | 0.233 | 0.629 | |||
| ≤ 1 | 358 | 306(85.5) | 52(14.5) | ||
| > 1 | 10 | 8(80.0) | 2(20.0) | ||
| Missing | 59 | 50(84.7) | 9(15.3) | ||
Relationship between MAPKAPK5 expression and clinicopathological parameters of COAD samples in TCGA
| Characteristics | n | MAPKAPK5 expression | χ2 | P-value | |
| High (n = 375) | Low (n = 52) | ||||
| Sex | 5.139 | 0.023 | |||
| Male | 227 | 207(91.2) | 20(8.8) | ||
| Female | 200 | 168(84.0) | 32(16.0) | ||
| Age | 0.334 | 0.563 | |||
| Age ≤ 60 | 125 | 108(86.4) | 17(13.6) | ||
| Age > 60 | 302 | 267(88.4) | 35(11.6) | ||
| Race | 1.179 | 0.555 | |||
| Asian | 10 | 10(100.0) | 0(0) | ||
| Black | 58 | 54(93.1) | 4(6.9) | ||
| White | 201 | 183(91.0) | 18(9.0) | ||
| Missing | 158 | 128(81.0) | 30(19.0) | ||
| Histological type | 6.507 | 0.011 | |||
| Colon adenocarcinoma | 378 | 337(89.2) | 41(10.8) | ||
| Colon mucinous adenocarcinoma | 46 | 35(76.1) | 11(23.9) | ||
| Missing | 3 | 3(100.0) | 0(0) | ||
| Clinical stage | 0.064 | 0.801 | |||
| I, II | 258 | 225(87.2) | 33(12.8) | ||
| III, IV | 159 | 140(88.1) | 19(11.9) | ||
| Missing | 10 | 10(100.0) | 0(0) | ||
| T | 2.479 | 0.115 | |||
| T1, T2 | 84 | 78(92.9) | 6(7.1) | ||
| T3, T4 | 343 | 297(86.6) | 46(13.4) | ||
| N | 4.244 | 0.039 | |||
| N0, N1 | 337 | 301(89.3) | 36(10.7) | ||
| N2 | 72 | 58(80.6) | 14(19.4) | ||
| Missing | 18 | 16(88.9) | 2(11.1) | ||
| M | 0.105 | 0.746 | |||
| M0 | 305 | 266(87.2) | 39(12.8) | ||
| M1 | 62 | 55(88.7) | 7(11.3) | ||
| Missing | 60 | 54(90.0) | 6(10.0) | ||
| BMI | 1.039 | 0.308 | |||
| 18.5~23.9 | 55 | 52(94.5) | 3(5.5) | ||
| Abnormal value | 171 | 154(90.1) | 17(9.9) | ||
| Missing | 201 | 169(84.1) | 32(15.9) | ||
| Residual tumor | 0.928 | 0.335 | |||
| R0, R1 | 320 | 265(85.5) | 45(14.5) | ||
| R2 | 26 | 24(92.3) | 2(7.7) | ||
| Missing | 89 | 86(96.7) | 3(3.3) | ||
| Anatomic neoplasm subdivision | 17.657 | 0.001 | |||
| Cecum | 105 | 87(82.9) | 18(17.1) | ||
| Ascending colon | 1 | 1(100.0) | 0(0) | ||
| Sigmoid colon | 141 | 129(98.5) | 12(1.5) | ||
| Others | 154 | 134(87.0) | 20(13.0) | ||
| Missing | 26 | 24(92.3) | 2(7.7) | ||
| Lymph node examined count | 1.338 | 0.247 | |||
| ≤ 10 | 32 | 30(93.8) | 2(6.2) | ||
| > 10 | 374 | 324(86.6) | 50(13.4) | ||
| Missing | 21 | 21(100.0) | 0(0) | ||
| Venous invasion | 0.010 | 0.922 | |||
| Yes | 89 | 78(87.6) | 11(12.4) | ||
| No | 284 | 250(88.0) | 34(12.0) | ||
| Missing | 54 | 47(87.0) | 7(13.0) | ||
| Lymphatic invasion | 2.140 | 0.143 | |||
| Yes | 235 | 210(89.4) | 25(10.6) | ||
| No | 153 | 129(84.3) | 24(15.7) | ||
| Missing | 39 | 36(92.3) | 3(7.7) | ||
| Synchronous colon cancer present | 3.735 | 0.053 | |||
| Yes | 23 | 23(100.0) | 0(0) | ||
| No | 362 | 311(85.9) | 51(14.1) | ||
| Missing | 42 | 41(97.6) | 1(2.4) | ||
| History of colon polyps | 2.614 | 0.106 | |||
| Yes | 127 | 104(81.9) | 23(18.1) | ||
| No | 235 | 207(88.1) | 28(11.9) | ||
| Missing | 65 | 64(98.5) | 1(1.5) | ||
| Colon polyps present | 2.660 | 0.103 | |||
| Yes | 79 | 75(94.9) | 4(5.1) | ||
| No | 136 | 120(88.2) | 16(11.8) | ||
| Missing | 212 | 180(84.9) | 32(15.1) | ||
| Loss of mismatch repair protein expression by IHC | 0.076 | 0.783 | |||
| Yes | 55 | 47(85.5) | 8(14.5) | ||
| No | 266 | 231(86.8) | 35(13.2) | ||
| Missing | 106 | 97(91.5) | 9(8.5) | ||
| Number of first-degree relatives with cancer diagnosis | 1.579 | 0.209 | |||
| ≤ 1 | 358 | 309(86.3) | 49(13.7) | ||
| > 1 | 10 | 10(100.0) | 0(0) | ||
| Missing | 59 | 56(94.9) | 3(5.1) | ||
The effects of overexpressed lnc-MAPKAPK5-AS1 and MAPKAPK5 on the prognostic significance of colon cancer patients
We systematically examined the association between transcriptional profiles and clinical outcomes in colon cancer patients. As shown in Figure 1H, it was found that the median survival time of patients with upregulated MK5-AS1 was 1,754 days, which was significantly shorter than that of patients with low gene expression (3,923 days, Plog rank = 0.048). The results of MK5 exhibited the same trend; patients with low gene expression had better survival outcome (Plog rank = 1.1 × 10⁻⁶, Figure 1I). The “pROC” R package was used to draw time-dependent ROC curves based on the patients’ follow-up time and the expression levels of the two genes to obtain different AUC values. The results showed that MK5-AS1 had the highest relative AUC of 0.72 for 3-year and 5-year survival rates, while the 5-year survival rate of MK5 had the highest AUC of 0.73
In addition, we compared the survival outcomes of colon cancer patients grouped according to several key clinical characteristics. Finally, four clinicopathologic parameters were identified as statistically significant. As shown in Figure 2A-D, those classified as colon mucinous adenocarcinoma, lymphatic invasion, venous invasion, and colon without loss of mismatch repair protein expression had a worse prognosis.
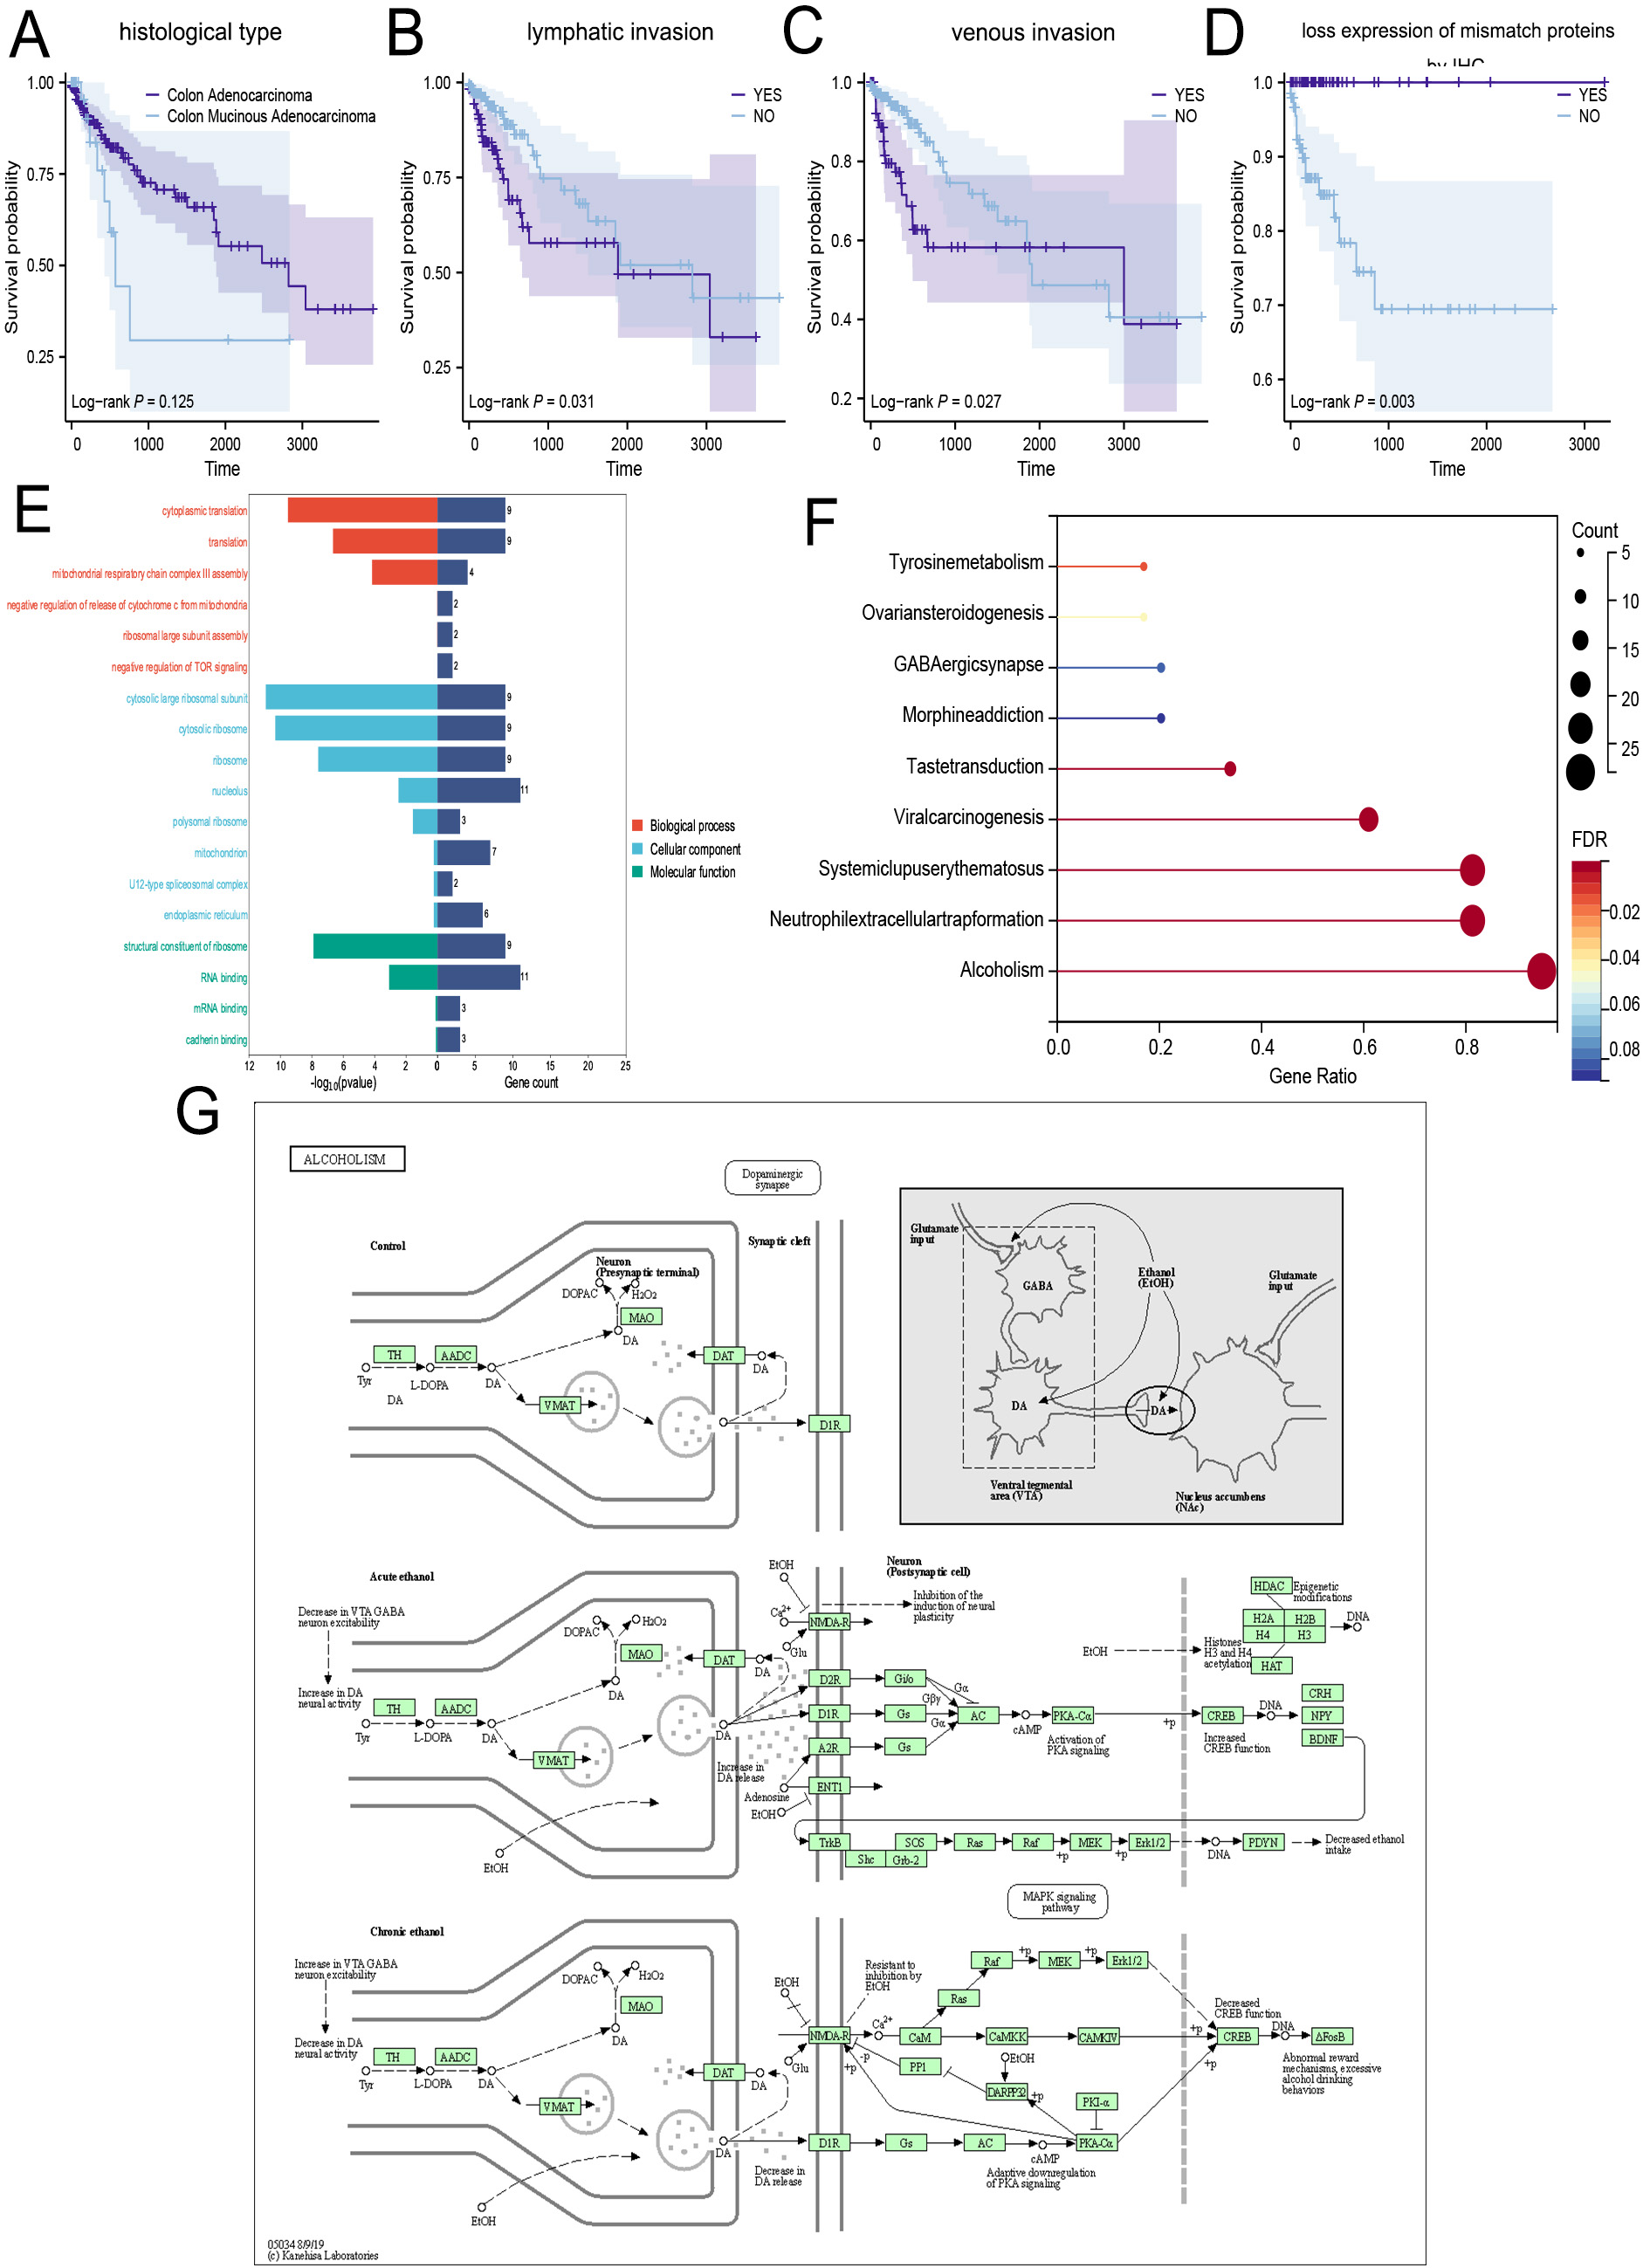
Figure 2. Potential biological processes involved in MK5-AS1 co-expression genes. (A-D) Survival analysis based on main clinical features. (E and F) GO and KEGG analysis. (G) KEGG pathway: Alcoholism.
Stratified analysis of the relationship between lnc-MAPKAPK5-AS1 expression and prognosis of colon cancer patients
To control for potential confounding factors, we also performed a stratified analysis of MK5-AS1 expression and prognosis of colon cancer patients. The results showed that in the two variable groups of N0 and M0 stages, MK5-AS1 high expression vs. low expression has a significant impact on the survival of colon cancer patients (HRN0 = 1.56, 95%CI = 1.32-3.51; HRM0 = 1.19, 95%CI = 1.38-3.69), and the adjusted HR is detailed in Table 3. However, in our clinical samples, the results of MK5 did not show statistically significant clinical variables [Table 4].
Stratified analysis of the relationship between lnc-MAPKAPK5-AS1 expression and prognosis of colon cancer
| Variables | MAPKAPK5-AS1 low | MAPKAPK5-AS1 high | Adjusted HR (high vs. low) | ||
| Cases (N) | Deaths (%) | Cases (N) | Deaths (%) | ||
| Sex | |||||
| Male | 36 | 3(8.30) | 200 | 27(13.5) | 0.96(0.28-3.24) |
| Female | 27 | 2(7.41) | 164 | 21(12.8) | 1.75(0.54-5.70) |
| Age | |||||
| Age ≤ 60 | 23 | 0(0) | 102 | 10(9.80) | 3.73(0.81-17.04) |
| Age > 60 | 40 | 5(12.5) | 262 | 38(14.5) | 1.81(0.29-2.23) |
| Race | |||||
| Asian | 0 | 0(0) | 10 | 0(0) | - |
| White | 36 | 5(13.9) | 165 | 28(16.9) | 1.09(0.41-2.9) |
| Others | 5 | 0(0) | 53 | 9(17.0) | 3.93(0.62-24.85) |
| Missing | 22 | 0(0) | 136 | 11(8.09) | - |
| Histological type | |||||
| Colon adenocarcinoma | 56 | 4(7.14) | 323 | 40(12.4) | 1.90(0.76-4.74) |
| Colon mucinous adenocarcinoma | 7 | 1(24.3) | 39 | 7(17.9) | 1.67(0.29-9.67) |
| Missing | 0 | 0(0) | 2 | 1(50.0) | - |
| Clinical stage | |||||
| I, II | 45 | 3(6.67) | 213 | 19(8.92) | 1.25(0.40-3.89) |
| III, IV | 15 | 2(13.3) | 144 | 28(19.4) | 1.34(0.38-4.79) |
| Missing | 3 | 0(0) | 7 | 1(14.3) | - |
| T | |||||
| T1, T2 | 14 | 1(7.14) | 70 | 6(8.57) | 1.19(0.12-11.56) |
| T3, T4 | 49 | 4(8.16) | 294 | 42(14.3) | 1.57(0.66-3.73) |
| N | |||||
| N0 | 42 | 3(7.14) | 201 | 20(9.95) | 1.56(1.32-3.51) |
| N1, N2 | 17 | 2(11.76) | 149 | 25(16.8) | 1.50(0.44-5.12) |
| Missing | 4 | 0(0) | 14 | 3(21.4) | - |
| M | |||||
| M0 | 48 | 3(6.25) | 257 | 25(9.73) | 1.19(1.38-3.69) |
| M1 | 5 | 1(20.0) | 57 | 16(28.1) | 2.96(0.79-10.97) |
| Missing | 10 | 1(10.0) | 50 | 7(14.0) | - |
| BMI | |||||
| 18.5~23.9 | 14 | 1(7.14) | 41 | 5(12.2) | 1.50(0.27-8.20) |
| Abnormal value | 24 | 2(8.33) | 147 | 16(10.9) | 1.66(0.37-7.55) |
| Missing | 25 | 2(8.00) | 176 | 27(15.3) | - |
| Residual tumor | |||||
| R0, R1 | 51 | 2(3.92) | 261 | 17(6.51) | 1.05(0.24-4.58) |
| R2 | 1 | 0(0) | 23 | 4(17.4) | - |
| Missing | 11 | 3(27.3) | 80 | 27(33.8) | - |
| Anatomic neoplasm subdivision | |||||
| Cecum | 15 | 0(0) | 90 | 17(18.9) | 3.09(0.61-15.68) |
| Ascending colon | 14 | 2(14.3) | 64 | 8(12.5) | 1.38(0.24-7.83) |
| Sigmoid colon | 18 | 1(5.56) | 123 | 11(8.94) | 2.44(0.55-10.80) |
| Others | 12 | 0(0) | 73 | 8(10.9) | 3.03(0.23-40.36) |
| Missing | 4 | 2(50.0) | 14 | 4(28.6) | - |
| Lymph node examined count | |||||
| ≤ 10 | 6 | 1(16.7) | 26 | 7(26.9) | 3.60(0.10-133.7) |
| > 10 | 57 | 4(7.02) | 317 | 40(12.6) | 1.68(0.72-3.94) |
| Missing | 0 | 0(0) | 21 | 1(4.76) | - |
| Venous invasion | |||||
| Yes | 8 | 2(25.0) | 81 | 18(22.2) | 1.10(0.24-5.05) |
| No | 49 | 2(4.10) | 235 | 23(9.79) | 2.15(0.73-6.39) |
| Missing | 6 | 1(16.7) | 48 | 7(14.6) | - |
| Lymphatic invasion | |||||
| Yes | 16 | 2(12.5) | 137 | 22(16.1) | 1.02(0.23-4.42) |
| No | 44 | 2(4.55) | 191 | 20(10.5) | 1.87(0.59-5.93) |
| Missing | 3 | 1(33.3) | 36 | 6(16.7) | - |
| Synchronous colon cancer present | |||||
| Yes | 0 | 0(0) | 23 | 1(4.35) | - |
| No | 58 | 4(6.90) | 304 | 35(11.5) | 1.53(0.63-3.72) |
| Missing | 5 | 1(20.0) | 37 | 12(32.4) | - |
| History of colon polyps | |||||
| Yes | 23 | 2(8.70) | 104 | 6(5.77) | 1.25(0.22-7.02) |
| No | 34 | 2(5.88) | 201 | 26(12.9) | 1.87(0.60-5.79) |
| Missing | 6 | 1(16.7) | 59 | 16(27.1) | - |
| Colon polyps present | |||||
| Yes | 13 | 2(15.4) | 66 | 12(18.2) | 1.71(0.49-6.04) |
| No | 23 | 21(91.3) | 113 | 5(4.42) | 3.21(0.31-33.50) |
| Missing | 27 | 1(3.70) | 185 | 31(16.8) | - |
| Loss of mismatch repair protein expression by IHC | |||||
| Yes | 10 | 0(0) | 45 | 0(0) | - |
| No | 37 | 1(2.70) | 229 | 19(8.30) | 1.53(0.28-8.30) |
| Missing | 16 | 4(25.0) | 90 | 29(32.2) | - |
| Number of first-degree relatives with cancer diagnosis | |||||
| ≤ 1 | 52 | 4(7.69) | 267 | 32(12.0) | 1.37(0.54-3.47) |
| > 1 | 2 | 0(0) | 47 | 3(6.38) | - |
| Missing | 9 | 1(11.1) | 50 | 13(26.0) | - |
Stratified analysis of the relationship between MAPKAPK5 expression and prognosis of clinical colon cancer patients
| Characteristics | MAPKAPK5 low | MAPKAPK5 high | Adjusted HR (high vs. low) | ||
| Cases (N) | Deaths (%) | Cases (N) | Deaths (%) | ||
| Sex | |||||
| Male | 34 | 15(44.1) | 12 | 5(41.7) | 0.86(0.32-2.29) |
| Female | 32 | 11(34.3) | 10 | 4(40.0) | 1.24(0.37-4.17) |
| Age | |||||
| ≤ 44 | 0 | 0(0) | 1 | 0(0) | - |
| 45-59 | 17 | 6(35.3) | 9 | 4(44.4) | 1.97(0.59-6.51) |
| ≥ 60 | 49 | 20(40.8) | 12 | 5(41.7) | 1.15(0.44-2.96) |
| Clinical stage | |||||
| I, II | 45 | 11(24.4) | 10 | 3(33.3) | 1.29(0.32-5.12) |
| III, IV | 21 | 15(71.4) | 12 | 6(50.0) | |
| Pathology grade | |||||
| I, II | 62 | 22(35.5) | 17 | 7(41.2) | 1.19(0.49-2.91) |
| III, IV | 4 | 4(100.0) | 5 | 2(40.0) | 0.21(0.04-1.22) |
| T | |||||
| T1, T2 | 9 | 2(22.2) | 2 | 0(0) | 0.29(0.01-9.89) |
| T3, T4 | 57 | 24(42.1) | 20 | 9(45.0) | 1.05(0.48-2.29) |
| N | |||||
| N0 | 62 | 24(38.7) | 13 | 5(38.5) | 1.04(0.40-2.70) |
| N1, N2 | 4 | 2(50.0) | 9 | 4(44.4) | 0.90(0.16-5.06) |
| M | |||||
| M0 | 63 | 23(36.5) | 22 | 9(40.9) | 1.12(0.51-2.48) |
| M1 | 3 | 3(100.0) | 0 | 0(0) | - |
| Total lymph nodes | |||||
| ≤ 10 | 52 | 22(42.3) | 15 | 6(40.0) | 0.87(0.36-2.08) |
| > 10 | 14 | 4(28.6) | 7 | 3(42.9) | 1.68(0.34-8.27) |
| Tumor location | |||||
| Left hemicolon | 31 | 14(45.2) | 8 | 5(62.5) | 2.43(0.75-7.81) |
| Transverse colon | 10 | 5(50.0) | 6 | 1(16.7) | 0.31(0.06-1.57) |
| Right hemicolon | 25 | 7(28.0) | 8 | 3(37.5) | 1.18(0.28-4.93) |
| Classification | |||||
| Invasive lesions | 17 | 5(29.4) | 5 | 2(70.6) | 1.33(0.22-8.10) |
| Protuberant lesions | 18 | 5(27.8) | 2 | 0(0) | 0.31(0.02-5.36) |
| Missing | 31 | 16(51.6) | 15 | 7(48.4) | - |
Cox regression model analysis of parameters associated with OS
We have carefully collated relevant clinical data from TCGA-COAD to investigate the potential risk factors affecting survival in colon cancer patients. Univariate Cox regression analysis revealed statistically significant correlations between clinical stage (HR = 2.294, P = 0.004), M stage (HR = 3.554, P < 0.001), residual tumor (HR = 9.644, P < 0.001), number of examined lymph nodes (HR = 0.468, P = 0.049), venous invasion (HR = 2.528, P = 0.003), loss of mismatch repair protein expressin by IHC
Cox regression analyses of clinicopathologic characteristics associated with OS in TCGA samples
| Variable | Univariable | |||
| HR | 95%CI | P | ||
| A. | ||||
| Gender | 0.713 | 0.407-1.247 | 0.236 | |
| Age | 1.892 | 0.947-3.782 | 0.061 | |
| BMI | 1.019 | 0.369-2.393 | 0.896 | |
| Race | 1 | Reference | ||
| 2 | 1.196 | 0.431-1.726 | 0.675 | |
| 3 | 8.361 | 0.647-13.361 | 0.996 | |
| Clinical stage | 2.294 | 1.294-4.067 | 0.004 | |
| T | 1.133 | 0.479-2.684 | 0.800 | |
| N | 1.835 | 0.969-3.473 | 0.062 | |
| M | 3.554 | 1.904-6.635 | < 0.001 | |
| Residual tumor | 9.644 | 3.368-27.61 | < 0.001 | |
| Histological type | 1.796 | 0.840-3.842 | 0.131 | |
| Lymph node examined count | 0.468 | 0.219-0.999 | 0.049 | |
| Venous invasion | 2.528 | 1.382-4.624 | 0.003 | |
| Lymphatic invasion | 2.460 | 1.349-4.485 | 0.003 | |
| Synchronous colon cancer present | 2.086 | 0.066-3.502 | 0.469 | |
| History of colon polyps | 0.863 | 0.372-2.001 | 0.731 | |
| Colon polyps present | 1.519 | 0.577-4.546 | 0.397 | |
| Loss of mismatch repair protein expression by IHC | 2.9×10⁻⁹ | 0-Inf | 0.003 | |
| Number of first-degree relatives with cancer diagnosis | 1.120 | 0.152-8.228 | 0.912 | |
| MAPKAPK5-AS1 | 1.106 | 1.024-1.064 | 0.043 | |
| MAPKAPK5 | 1.091 | 1.076-1.257 | 0.038 | |
| B. | ||||
| Clinical stage | 7.052 | 1.117-14.249 | 0.037 | |
| M | 1.349 | 0.301-6.033 | 0.696 | |
| Residual tumor | 7.667 | 1.591-36.945 | 0.011 | |
| Lymph node examined count | 4.228 | 0.035-5.126 | 0.499 | |
| Venous invasion | 1.286 | 0.210-7.875 | 0.785 | |
| Lymphatic invasion | 1.649 | 0.259-10.515 | 0.597 | |
| Loss expression of mismatch repair proteins by IHC | 4.700 | 0-Inf | 0.998 | |
| Lnc-MAPKAPK5-AS1 | 1.064 | 1.029-1.144 | 0.046 | |
| MAPKAPK5 | 1.904 | 1.771-3.084 | 0.029 | |
GO and KEGG analysis
We enriched the co-expressed genes of MK5-AS1 to explore its biological function. For GO “Biological Processes”, the above genes were mainly involved in cytoplasmic translation, mitochondrial respiratory chain complex III assembly, negative regulation of release of cytochrome from mitochondria, and negative regulation of mTOR signaling. In “Cellular Component”, the cytosolic large ribosomal subunit, cytosolic ribosome, polysomal ribosome, mitochondrion, U12-type spliceosomal complex, and endoplasmic reticulum were significantly co-regulated. The signal pathways enriched in “Molecular Functions” included structural constituents of the ribosome, RNA binding, and cadherin binding [Figure 2E]. The lollipop and path diagrams detailed in Figure 2F and G displayed the pathways enriched by KEGG analysis, including alcoholism, neutrophil extracellular trap formation, systemic lupus erythematosus, GABAergic synapse, viral carcinogenesis, morphine addiction, and tyrosine metabolism, which were associated with metabolic and immune-related diseases.
Validation of the expression pattern of MAPKAPK5 protein by IHC and clinical correlation analysis
Our study included 90 matched pairs of colon adenocarcinoma tissues and adjacent non-tumor tissues. As demonstrated in Figure 3A, MK5 protein expression was analyzed in three representative tissue pairs. Positive immunostaining was mainly located in the nucleus. After the evaluation of the IHC score, high expression of MK5 protein was detected in 60.0% (54/90) of most colon cancer sections and 10% (9/90) of tumor-adjacent tissues [Figure 3B]; the significant upregulation trend was consistent with the results of our previous bioinformatic analysis. Simultaneously, for clinical correlation analysis, MK5 expression was significantly positively correlated with the pathological grade (χ2 = 44.992, P = 0.025) and N stage
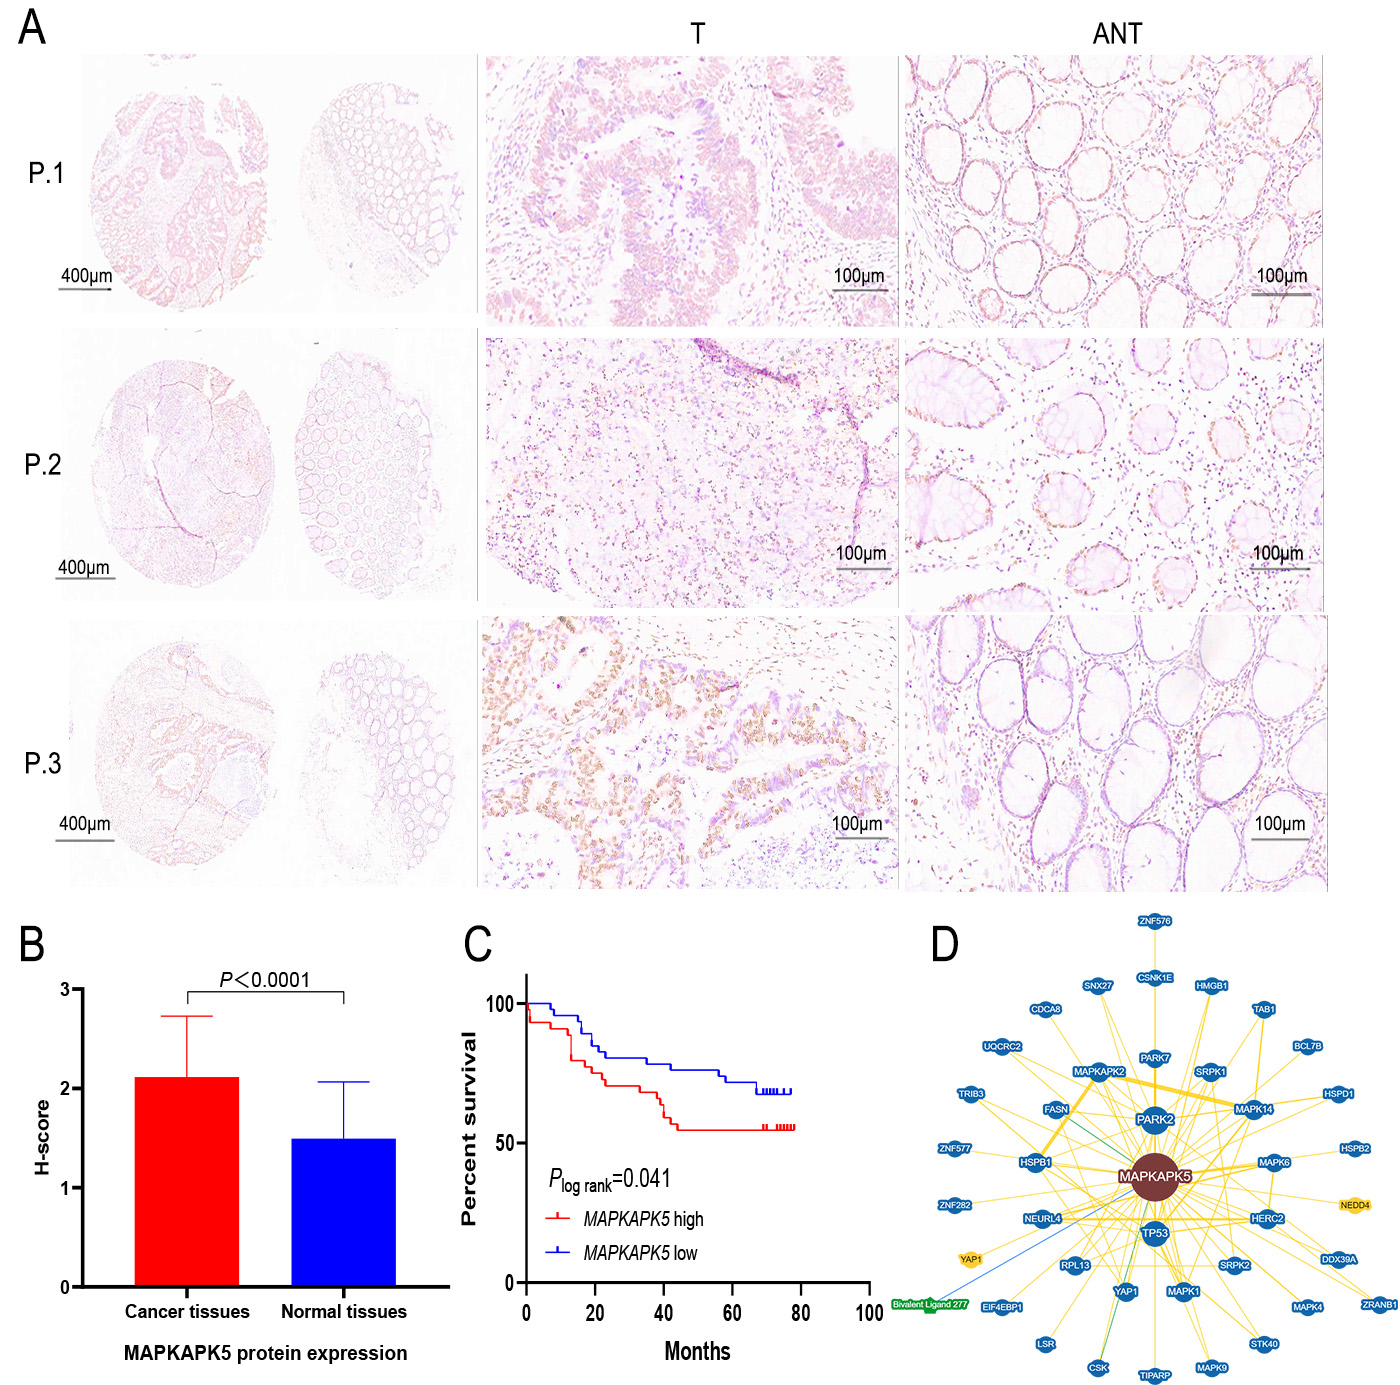
Figure 3. Validation of MAPKAPK5 protein expression by IHC and survival analysis. (A) Expression of MK5 protein in three representative pairs of colon cancer tissues (T) and adjacent non-cancerous tissues (ANT). (B) The MK5 protein expression score is higher in colon cancer tissues compared to para-carcinoma tissues. (C) The relationship between MK5 expression and OS in colon cancer patients. (D) PPI network of MK5 protein based on the BioGRID database.
Relationship between clinicopathological characteristics and expression of MAPKAPK5 protein in HCC patients
| Characteristics | n | MAPKAPK5 expression | χ2 | P-value | |
| High (n = 22) | Low (n = 66) | ||||
| Sex | 0.061 | 0.805 | |||
| Male | 46 | 12(26.1) | 34(73.9) | ||
| Female | 42 | 10(23.8) | 32(76.2) | ||
| Age | 5.206 | 0.074 | |||
| ≤ 44 | 1 | 1(100) | 0(0) | ||
| 45~59 | 26 | 9(34.6) | 17(65.4) | ||
| ≥ 60 | 61 | 12(19.7) | 49(80.3) | ||
| Clinical stage | 3.636 | 0.057 | |||
| I, II | 55 | 10(18.2) | 45(81.8) | ||
| III, IV | 33 | 12(36.4) | 21(63.6) | ||
| Pathology grade | 4.992 | 0.025 | |||
| I, II | 79 | 17(21.5) | 62(78.5) | ||
| III, IV | 9 | 5(55.6) | 4(44.4) | ||
| T | 0.312 | 0.577 | |||
| T1, T2 | 11 | 2(18.2) | 9(72.3) | ||
| T3, T4 | 77 | 20(26.0) | 57(74.0) | ||
| N | 15.915 | < 0.001 | |||
| N0 | 75 | 13(17.3) | 62(82.7) | ||
| N1, N2 | 13 | 9(69.2) | 4(30.8) | ||
| M | 1.035 | 0.309 | |||
| M0 | 85 | 22(25.9) | 63(74.1) | ||
| M1 | 3 | 0(0) | 3(100.0) | ||
| Total lymph nodes | 16.475 | < 0.001 | |||
| ≤ 10 | 29 | 15(51.7) | 14(48.3) | ||
| > 10 | 59 | 7(11.9) | 52(88.1) | ||
| Tumor location | 1.762 | 0.414 | |||
| Left hemicolon | 39 | 8(20.5) | 31(79.5) | ||
| Transverse colon | 16 | 6(37.5) | 10(62.5) | ||
| Right hemicolon | 33 | 8(24.2) | 25(75.8) | ||
| Classification | 3.881 | 0.144 | |||
| Invasive lesions | 23 | 5(22.7) | 18(77.3) | ||
| Protuberant lesions | 19 | 2(10.5) | 17(89.5) | ||
| Missing | 46 | 15(32.6) | 31(67.4) | ||
PPI network of MAPKAPK5
As shown in Figure 3D, proteins named MAPK6, PARK7, HSPB1, MAPK4, MAPKAPK2, NEDD4, BCL7B, CDCA8, and CSNK1E remarkably interact with MK5. MAPK6 has been reported as the target gene of miRNAs related to colon adenoma carcinogenesis, not only for the early diagnosis of CRC, but also to provide evidence for its carcinogenic mechanism[20]. Jin proposed that PARK is involved in the activation of various intracellular signaling pathways involved in tumor progression, affecting tumor proliferation, metastasis, recurrence, and drug resistance[21]. In addition, the translation of MAPK4 mRNA is inhibited by IGF2BP1, which further inhibits its phosphorylation by MK5, leading to increased cell adhesion and thus promoting cancer cell migration. The above evidence indirectly suggests that MK5 may influence cell cycle regulation and biological signaling in specific physiological states through these interactions.
Gene mutation analysis
As shown in Figure 4A and B, the columns represent samples, while the icons and colors reflect different types of genetic mutations. The mutation frequencies of MK5-AS1 and MK5 in the colon cancer dataset named “CPTAC-2 Prospective (n = 110)” were 9% and 8%, respectively. Most of the mutations were deep deletions. Furthermore, the Chi-square test was employed to assess the frequency of gene mutation between high and low gene expression groups. The waterfall maps showed 20 genes with significant differences between the two groups, of which 288 samples were tested for mutation, 271 of which were mapped samples (94.1%). The mutation frequency of APC and KRAS was higher in the MK5-AS1 high expression group than in the low expression group, while BRAF, RYR3, VWF, and ZNF469 accounted for a greater proportion of mutations in the MK5-AS1 low expression group [Figure 4C]. For MK5, APC also showed a higher mutation frequency in the high expression group, whereas ZFHX4, MUC5B, BRAF, NEB, and KMT2B displayed the opposite mutation trends [Figure 4D]. To comprehensively characterize the genomic landscape associated with MK5-AS1 expression, we analyzed TP53 mutation patterns across MK5-AS1 expression subgroups. Despite observable trends, no statistically significant difference was observed between the MK5-AS1 high expression group and low expression group (P > 0.05). This suggests that TP53 mutational status alone may not directly explain the divergent clinical or molecular phenotypes observed between MK5-AS1 subgroups. Nevertheless, potential regulatory interactions between TP53 and MK5-AS1 at transcriptional or post-transcriptional levels warrant further investigation, given the well-documented context-dependent oncogenic effects of TP53 mutations in colorectal carcinogenesis.
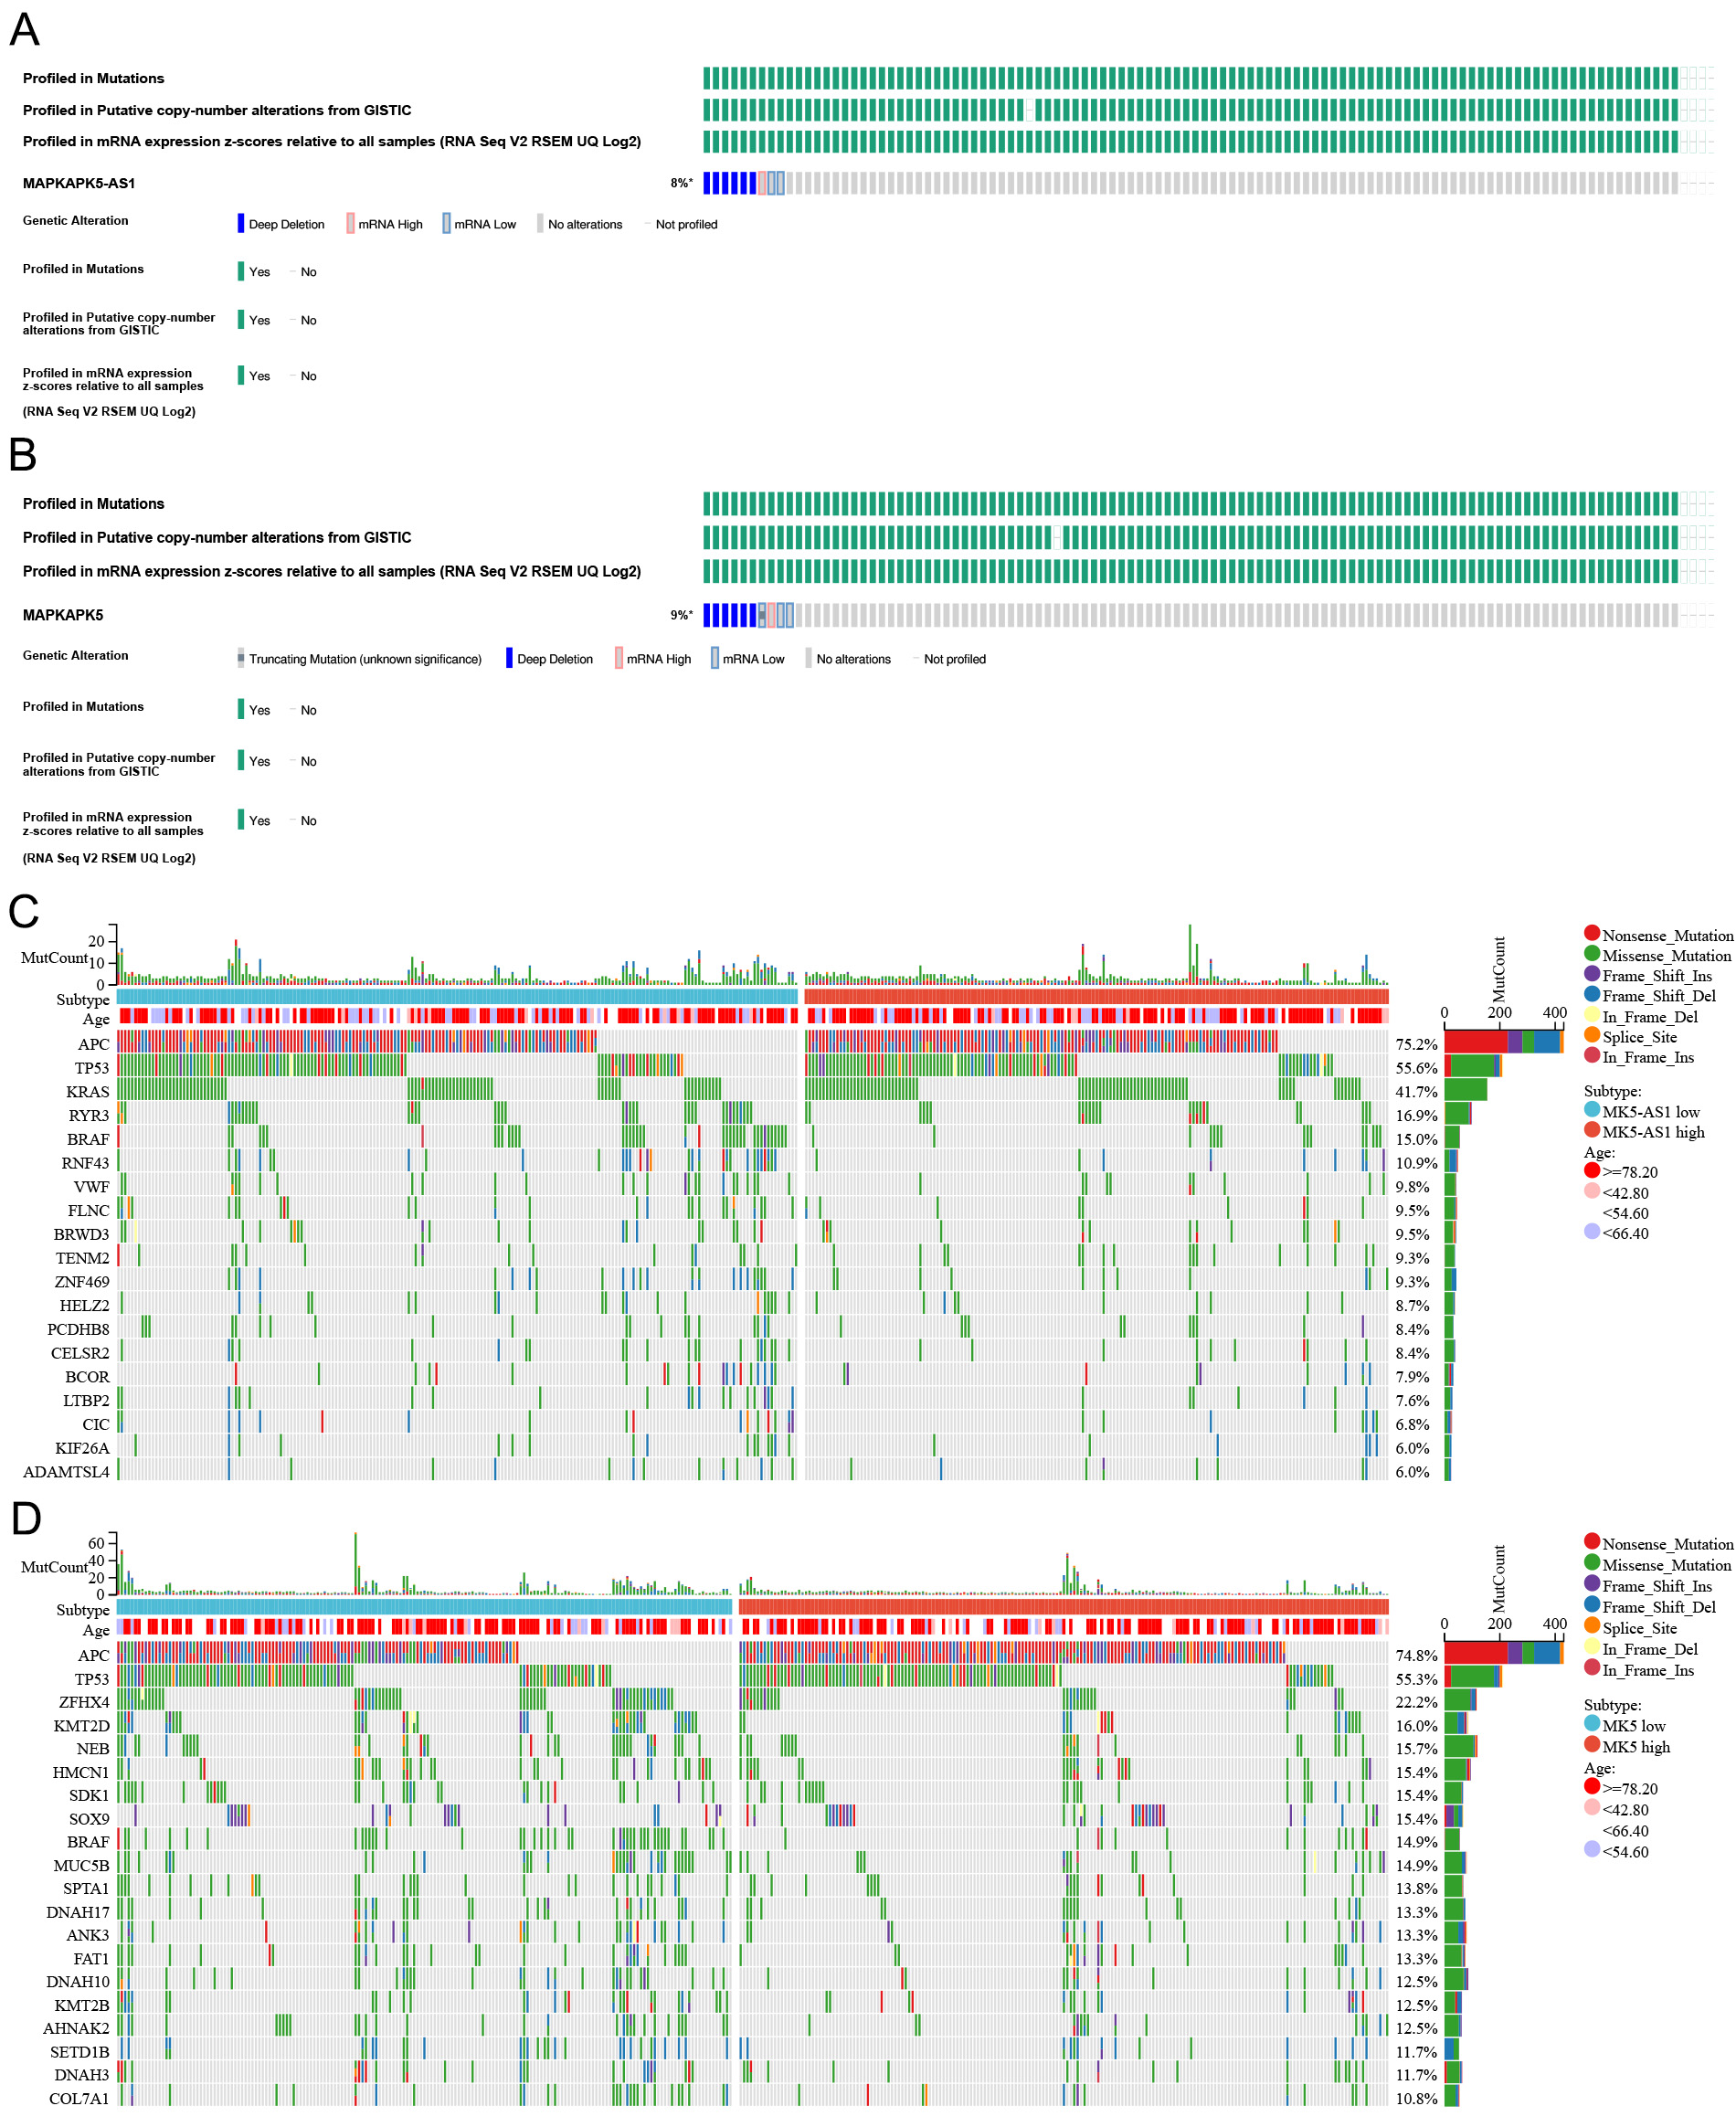
Figure 4. Gene mutation analysis. (A and B) Oncoprint plots of MK5-AS1 and MK5 in the ciBioPortal database. (C and D) The top 20 genes with the highest mutation frequency in the high and low expression groups of MK5-AS1 and MK5.
Lnc-MAPKAPK5-AS1 is overexpressed in colorectal liver metastases and co-regulated with immune and metabolic pathways
In addition to discussing the role of MK5-AS1 in colon cancer development and clinical prognosis, we also intended to investigate its potential effect on colon cancer liver metastasis. After normalization with the expression profile of the GEO datasets, we found that both MK5-AS1 and MK5 were significantly upregulated in liver metastatic tissues compared to normal colon cancer tissues (P < 0.001,
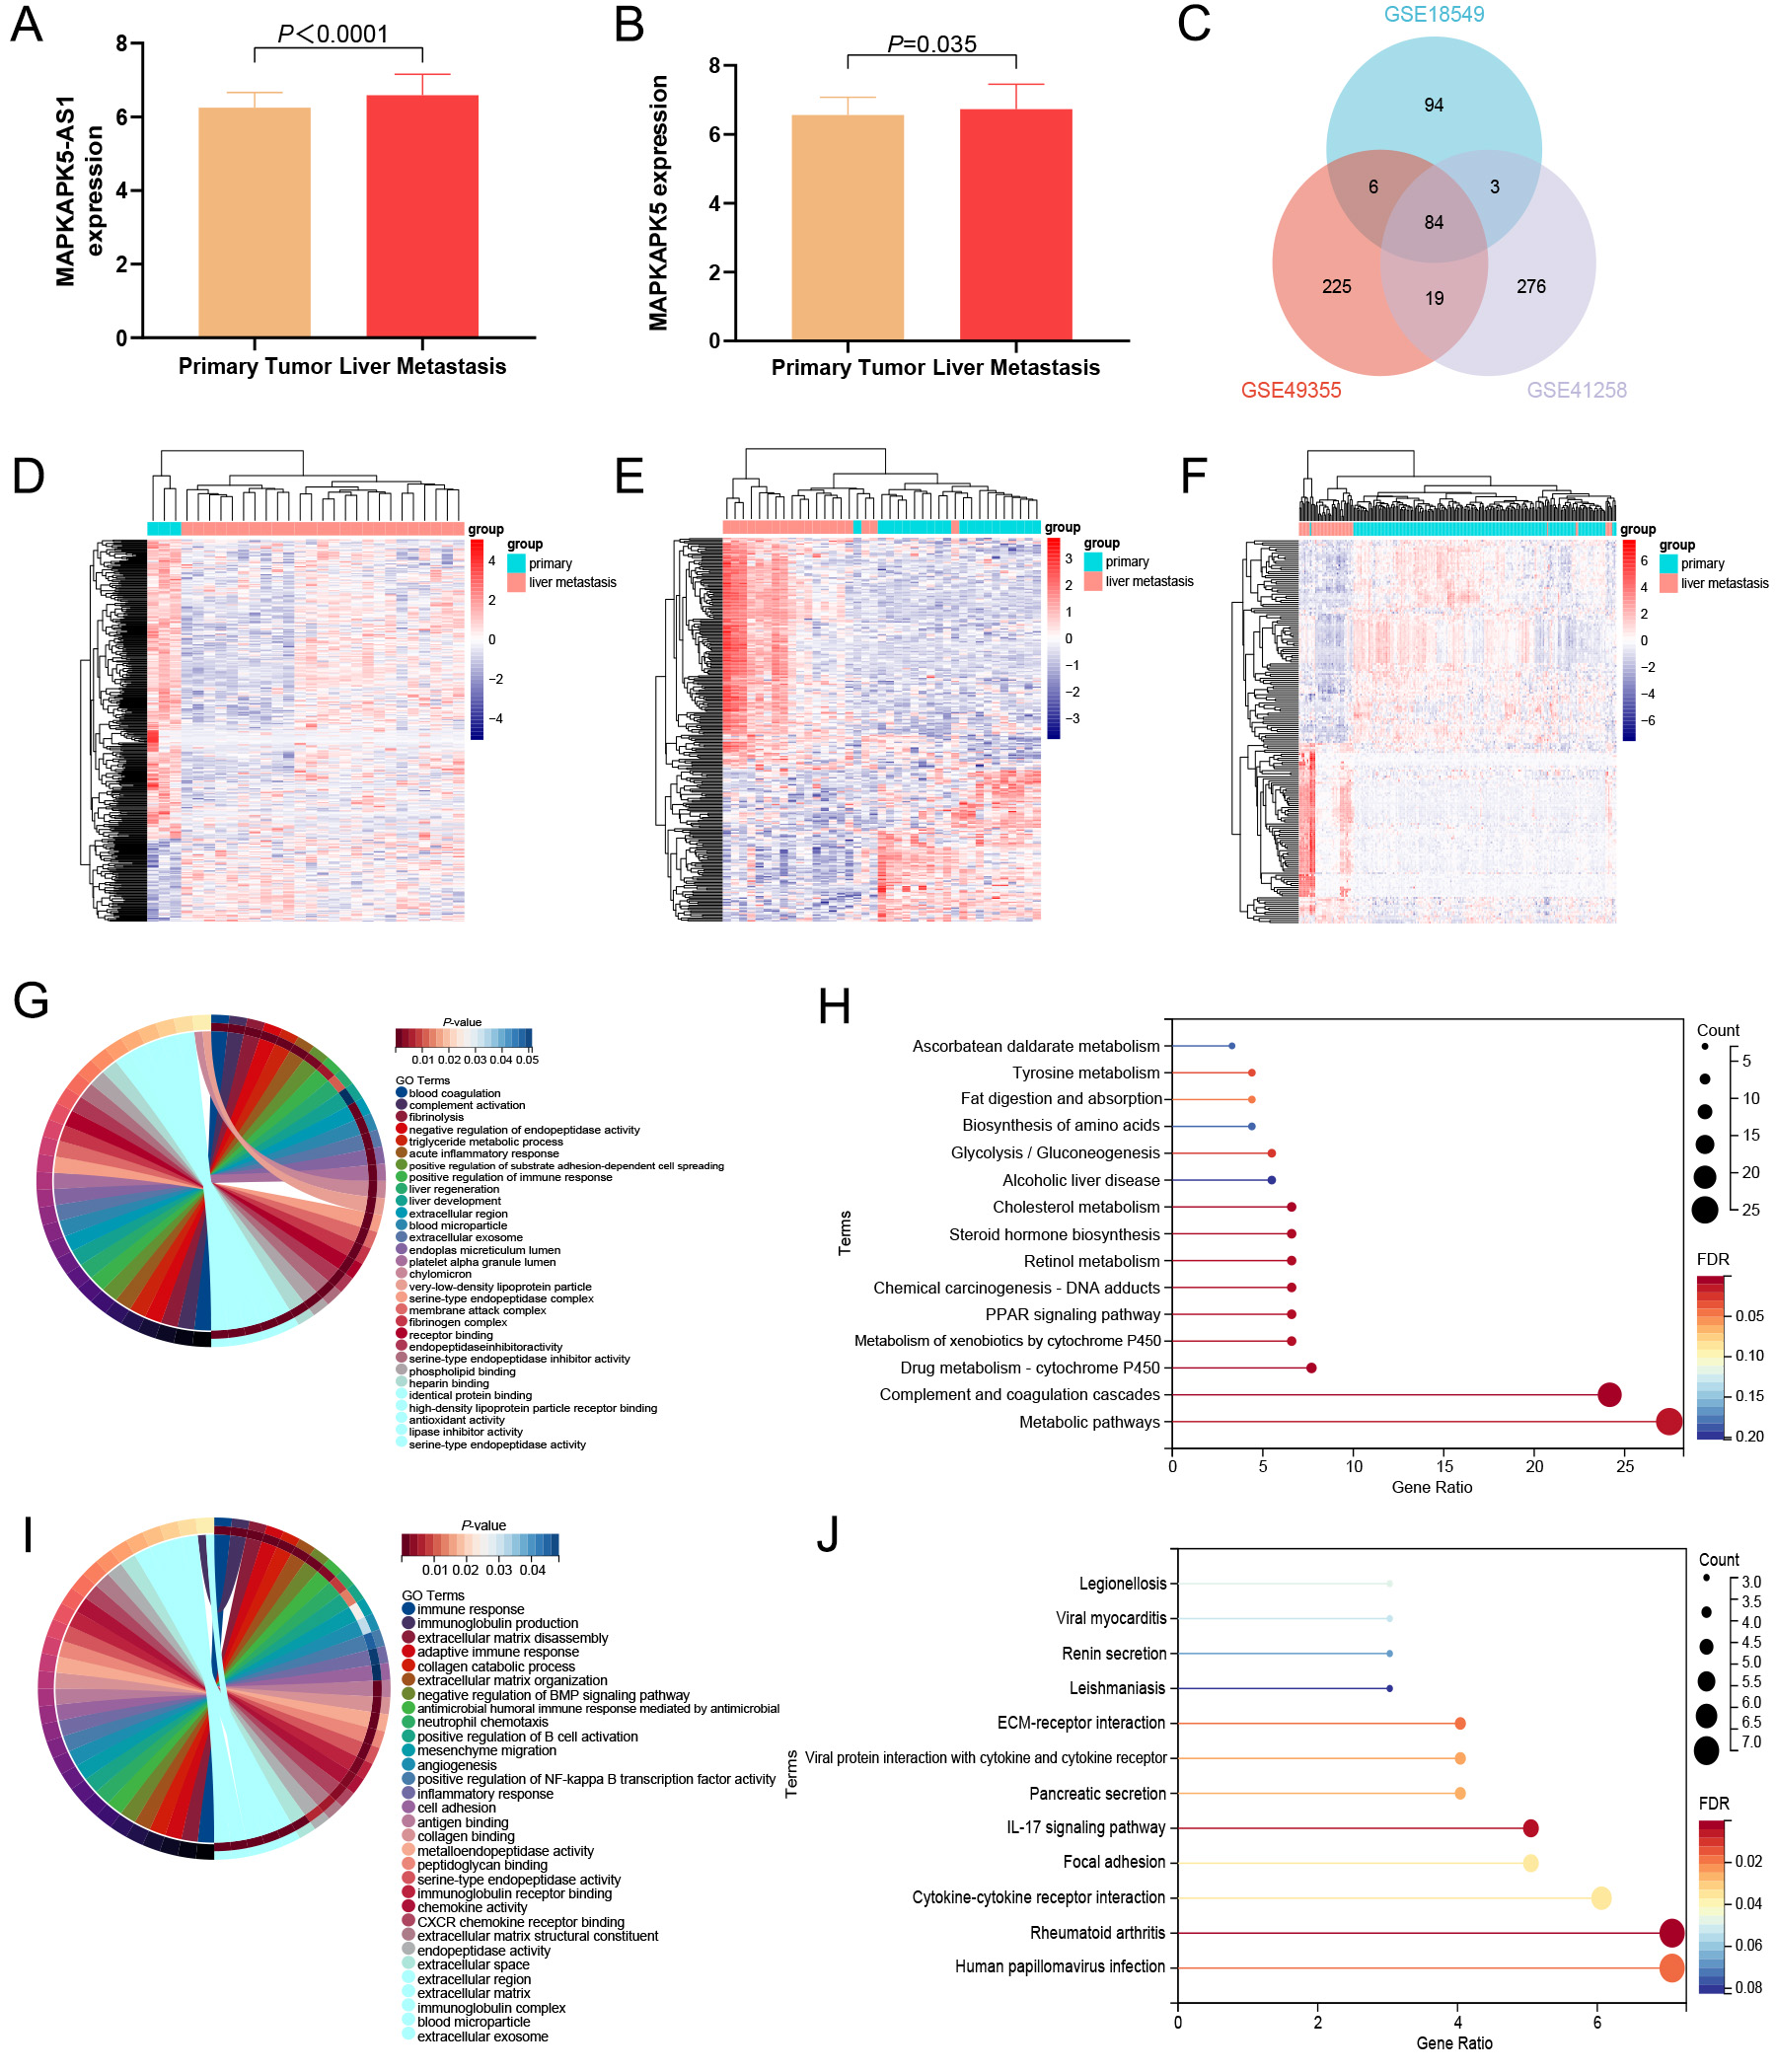
Figure 5. Expression status and functional enrichment analysis of MK5-AS1 and MK5 in liver metastasis and colon cancer tissues. (A and B) MK5-AS1 and MK5 were significantly upregulated in liver metastasis. (C) Venn diagram showing the intersection of DEGs in three GEO datasets. (D-F) Heat maps of DEGs expression (GSE49355, GSE41258, and GSE18549) in colon cancer and liver metastases. (G and H) GO and KEGG analysis of upregulated genes. (I and J) GO and KEGG analysis of downregulated genes.
We discovered that the genes co-expressed with MK5-AS1 are involved in immune, inflammatory, and metabolic pathways, suggesting that it may have some effect on colon cancer invasion and metastasis to a certain extent. In GO analysis, upregulated DEGs were mainly involved in blood coagulation, complement activation, fibrinolysis, liver development, acute inflammatory response, positive regulation of immune response, very-low-density lipoprotein particle assembly, negative regulation of very-low-density lipoprotein particle clearance, cholesterol metabolic process, and hemoglobin metabolic process [Figure 5G]. In KEGG analysis, upregulated DEGs were mainly involved in metabolic pathways, complement and coagulation cascades, drug metabolism-cytochrome P450, metabolism of xenobiotics by cytochrome P450, PPAR signaling pathway, chemical carcinogenesis-DNA adducts, cholesterol metabolism, and alcoholic liver disease [Figure 5H]. As for downregulated DEGs, significant roles were also identified in GO analysis, which were related to immune response, positive regulation of NF-kappa B transcription factor activity, inflammatory response, cell adhesion, neutrophil chemotaxis, angiogenesis, positive regulation of B cell activation, collagen catabolic process, negative regulation of BMP signaling pathway, extracellular exosome, and blood microparticle [Figure 5I]. In KEGG analysis, downregulated DEGs were associated with human papillomavirus infection, rheumatoid arthritis, cytokine-cytokine receptor interaction, focal adhesion, IL-17 signaling pathway, and viral protein interaction with cytokine and cytokine receptors [Figure 5J].
Correlation of gene expression with the proportion of tumor-infiltrating cells
Given our above findings that colon cancer tissues with high MK5-AS1 expression are enriched in inflammatory immune-related activities, we hypothesized that this might be related to the tumor immune microenvironment. As shown in Figure 6A-C, significant negative correlations were observed between MK5-AS1 expression and three immune-related scores. Figure 6D and E shows the proportions of 22 various immune cell types in primary colon cancer tissues and liver metastases, with each column representing a different patient. Furthermore, we found that the expression patterns of eight common immune checkpoint genes (CD274, CTLA4, PDCD1, HAVCR2, LAG3, PDCD1LG2, SIGLEC15, and TIGIT) differed statistically between the MK5-AS1 high and low expression groups [Figure 6F]. In addition, using two algorithms, “CIBERSORT” and “xCell”, we examined the differences in the abundance of 22 and 64 immune cells between MK5-AS1 high and low expression groups, respectively [Figure 6G and H]. The results indicated that the proportions of CD4 naive T cells, macrophages M2, dendritic cells, neutrophils, aDC, basophils, cDC, HSC, hepatocytes, MSC, fibroblasts, preadipocytes, and microenvironment score were higher in the low MK5-AS1 expression group than in the high expression group. On the contrary, regulatory T cells (Tregs), gamma delta T cells, macrophages M0, activated eosinophils, CD8 naive T cells, epithelial cells, osteoblasts, plasma cells, and platelets were higher in the MK5-AS1 high expression group.
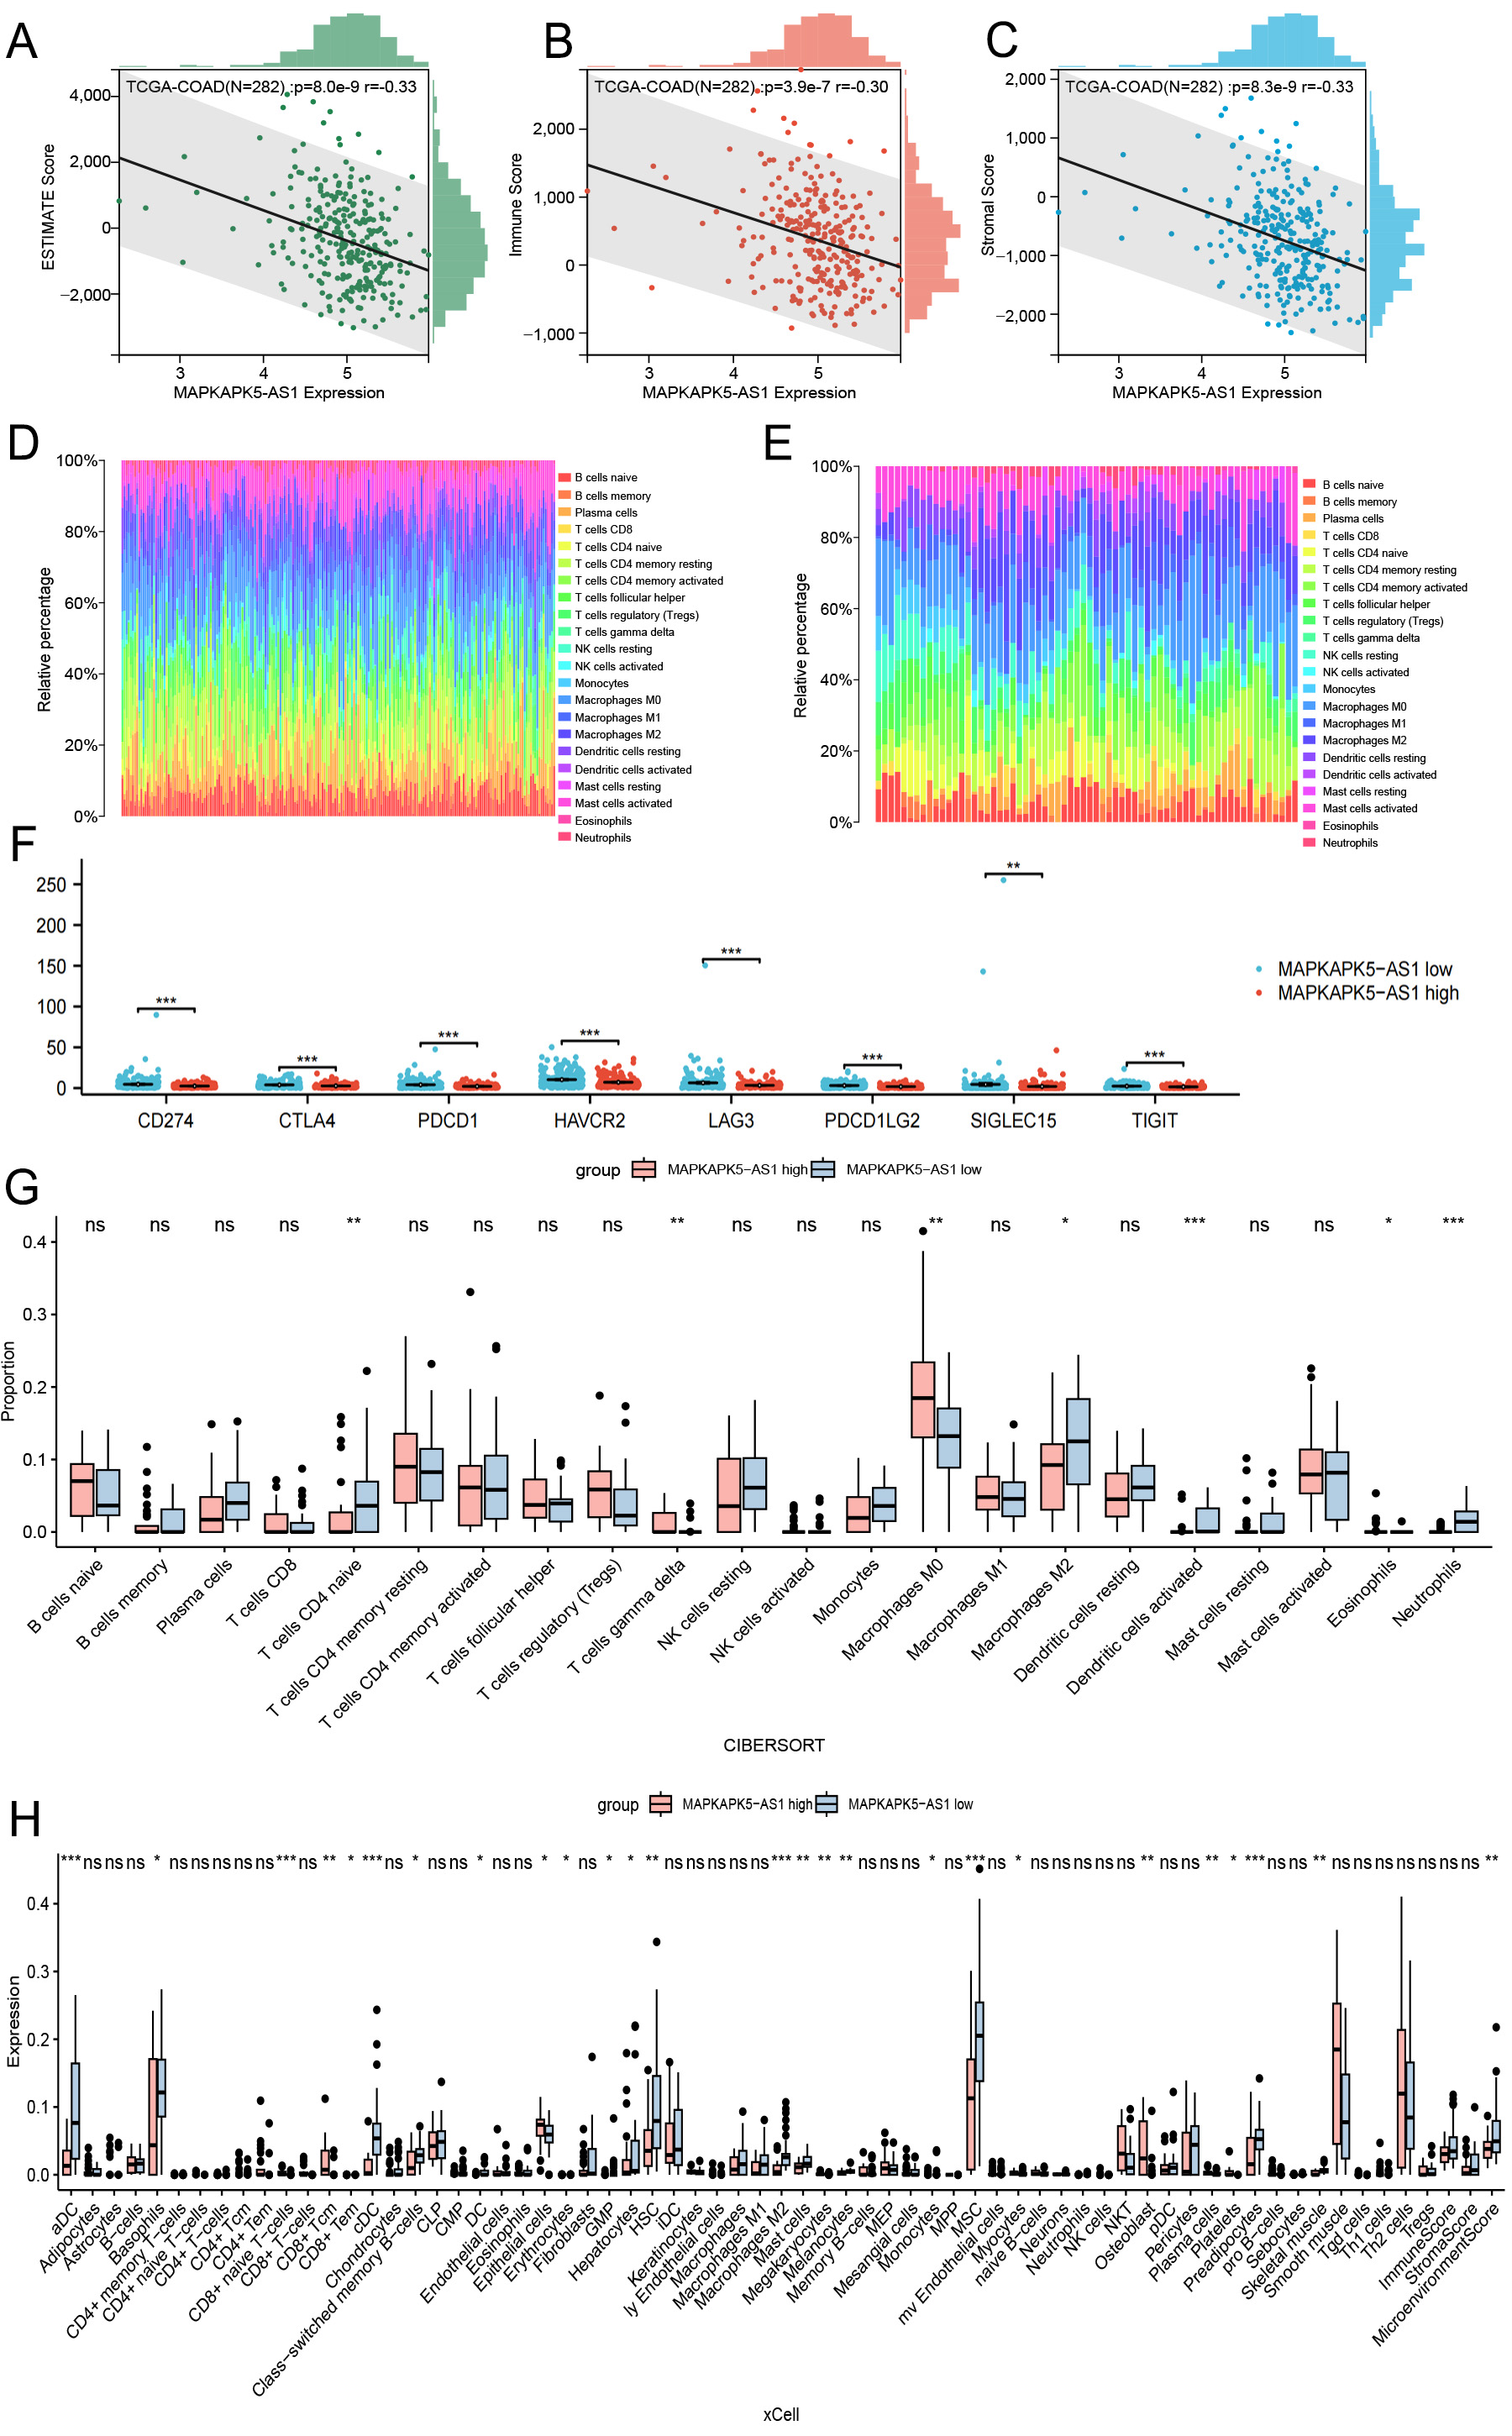
Figure 6. Correlation analysis between MK5-AS1 and immune microenvironment. (A-C) The relationships between MK5-AS1 and ESTIMATE score, Immune score, and Stromal score. (D and E) The proportions of 22 types of immune cells in colon cancer tissues and liver metastasis. (F) Expression patterns of eight immune checkpoint genes between the MK5-AS1 high expression group and the low expression group. (G) The expression characteristics of 22 immune cell phenotypes were calculated based on the “CIBERSORT” algorithm. (H) The expression of 64 types of immune cells extracted based on the “xCell” algorithm was shown in different groups. Statistical significance is indicated as follows: *P < 0.05, **P < 0.01, ***P < 0.001; ns: not significant (P ≥ 0.05).
DISCUSSION
The incidence of colon cancer is increasing year by year and tends to be younger, which is closely linked to factors such as genetics, diet, underlying intestinal diseases, and living habits[22-24]. The prognosis of colon cancer mainly depends on tumor stage and early intervention, while colonoscopy is still difficult to promote in the population. Currently, molecular markers for the diagnosis of colon cancer include carbohydrate antigen (CA), carcinoembryonic antigen (CEA), carbohydrate antigen (CA19-9), etc.[25,26]. Although these markers can help detect colon cancer, their sensitivity and specificity are low. With the rapid development of molecular genomics, the identification of new regulatory factors from tumors as biomarkers for disease diagnosis and prognosis may provide a solid basis for improving traditional diagnosis and treatment. LncRNAs exert a regulatory role in various biological processes such as embryonic development and gene expression[27,28]. In recent years, the mechanism of lncRNAs in colon cancer has been widely explored[29]. For example, compelling studies have constructed promising ferroptosis[30], cuproptosis[31], or immune-related[32] lncRNA signatures to predict the prognosis and response to treatment of colon cancer. While a limited number of lncRNAs have been confirmed to be associated with colorectal cancer metastasis, further exploration is necessary to determine their clinical applications, such as in tumor diagnosis and treatment. Colorectal cancer-associated transcripts (CCATs) have been identified as factors associated with colorectal cancer metastasis and are categorized into two distinct types: CCAT1 and CCAT2. Aberrant expression of CCAT1 has been detected during the progression of colorectal cancer, including the development of lymph node and liver metastases. Increased expression of CCAT2 has been observed in microsatellite-stabilized colorectal cancers, where it activates the Wnt signalling pathway through its interaction with transcription factors. Consequently, this has led to an elevated risk of hepatic metastasis and an increased number of metastatic nodules.
Although significant progress has been achieved in lncRNA research related to colorectal cancer hepatic metastasis, the functional characterization and mechanistic underpinnings of the majority of lncRNAs in this pathological process remain poorly understood. There is limited evidence that the positive feedback loop between lnc-CYTOR and the Wnt/β-catenin signaling pathway promotes colon cancer metastasis[33], and lnc-AFAP1-AS1 promotes the invasion and metastasis of colon cancer cells by participating in epithelial-mesenchymal processes that affect cell adhesion[34]. In addition, carcinoma-associated fibroblasts (CAFs) promoted the transfer of the common oncogene H19 in exosomes, leading to the activation of the β-catenin pathway to promote colorectal cancer development, metastasis and drug resistance[35]. Cheng et al. demonstrated that lnc-C00662 facilitates tumor growth and metastatic spread through a competitive endogenous RNA (ceRNA) mechanism, wherein it sequesters miR-340-5p to modulate CLDN8/IL22 co-expression and subsequently activates the ERK signaling pathway[36]. Furthermore, overexpression of SNHG7 significantly enhanced the tumorigenesis and liver metastasis of SW480 cells in vivo[37]. As an innovative lncRNA, MK5-AS1 has been reported to be associated with a variety of tumor-related characteristics such as hypoxia, immune infiltration, ceRNA axes, and the regulation of expression of other proteins, especially in liver cancer[38-40].
Through integrative analysis of TCGA and GEO datasets, we identified significantly elevated expression levels of both MK5-AS1 and MK5 in colon cancer tissues compared to normal controls. Interestingly, these two molecules demonstrated strong positive co-expression. In addition, clinical correlation analysis showed that MK5-AS1 expression affected the histological type, clinical stage, N stage, lymphatic invasion, and BMI of colon cancer patients. Our own clinical samples also demonstrated that the staining score of MK5 was significantly higher in cancer tissues than in adjacent normal tissues, and that gene expression was negatively regulated with clinical stage and N stage. Furthermore, multivariate Cox regression analysis showed that M stage, residual tumor, MK5-AS1, and MK5 were independent risk factors for colon cancer. The discovery of prognostic factors is helpful for clinical decision making: our results found that high expression of MK5-AS1 is associated with shorter OS and may be a predictor of poor prognosis of colon cancer. To control for confounding factors, we performed a stratified prognostic analysis based on clinical features and found that in the N0 and M0 subgroups, MK5-AS1 high vs. low expression significantly affected the survival outcome of patients.
Furthermore, to elucidate the potential biological functions of MK5-AS1, we conducted comprehensive functional annotation and pathway enrichment analyses of its co-expressed genes. The results suggested that the molecular functions of DEGs were mainly enriched in mitochondria-associated metabolic pathways, negative regulation of mTOR signaling, GABAergic synapse, viral carcinogenesis, and tyrosine metabolism. The mTOR protein signaling pathway is an important therapeutic target for various tumors. As a key regulator of the Akt signaling pathway, mTOR regulates translation and transcription by phosphorylating a variety of downstream proteins, thereby affecting tumourigenesis and metastasis of tumors[41-43]. While our enrichment analysis suggests a potential role of MK5-AS1 in lipid/amino acid metabolism, these findings require further experimental validation. Future studies should employ metabolomics and functional assays to directly assess MK5-AS1’s metabolic impact and identify underlying mechanisms.
Based on 110 colon cancer samples collected online from the cBioPortal database, we found that 9 (8%) of all samples had a deep deletion of MK5-AS1, and 9% of the mutation frequency was present in MK5. We also found that there were some differences in mutations between the MK5-AS1 and MK5 expression groups. In the high expression group, there was a higher frequency of mutations in genes such as APC, KRAS, etc., which was consistent with the results of genome-wide analysis by Nakayama[44]. In primary colon cancer, mutations in the proto-oncogene KRAS are most commonly identified, and a significant increase in neutrophils in the blood of patients with KRAS-mutated tumors has been found, leading to the recruitment of CLM sites[45]. Meanwhile, the frequency of the BRAF mutation was higher in the low expression group. Kakar et al. found that a mutation in this gene was closely associated with high chromosomal instability and resistance to cetuximab and panitumumab in colon cancer[46]. The lack of a statistically significant difference in TP53 mutation frequency between MK5-AS1 subgroups suggests that it may influence TP53-independent pathways or cooperate with other high-mutation genes (e.g., APC, KRAS) to drive tumor progression. Future studies could investigate whether MK5-AS1 modulates TP53 downstream targets or interacts with mutant TP53 to alter its oncogenic gain-of-function effects.
From an anatomical point of view, the blood from the colon flows directly into the liver, mainly through the portal vein, which means that the liver is the first stop for colon cancer cells. Therefore, the liver is the most common organ for blood metastasis of colon cancer[47], which is also the reason why we are paying close attention to whether MK5-AS1 is associated with liver metastasis of colon cancer. As expected, MK5-AS1 was also shown to be upregulated in liver metastases of colon cancer in three GEO datasets containing liver metastases and tumor tissue in situ in our analysis. In addition, the intersection of upregulated and downregulated differentially expressed genes in the three datasets was screened for further enrichment analysis. GO analysis revealed that the upregulated differentially expressed genes were significantly involved in inflammatory pathways, such as acute inflammatory response, complement activation, and fibrinolysis. Downregulated DEGs were mainly involved in immune response pathways and are closely related to cell adhesion, B cell activation, and neutrophil chemotaxis. In the KEGG analysis, DEGs were mainly involved in metabolic pathways, including drug metabolism, cholesterol metabolism, and the PPAR signaling pathway. Studies have shown that cancer cells that penetrate deeply into the liver alter the normal liver microenvironment and are affected by abnormal liver regeneration, inflammation, fibrosis, and other pathophysiological factors, resulting in tumor susceptibility. Changes in the substructure of normal tissue cells provide preconditions such as genetic material, energy, and proteins for the micrometastasis of the original tumor within the organ[48].
Given our identification of several immunological pathways associated with MK5-AS1 in liver metastases and primary cancer tissues, we then investigated its association with the immune microenvironment of colon cancer. Using the ESTIMATE algorithm, we computed immune scores for colon cancer patients, revealing an inverse correlation between MK5-AS1 expression levels and immune scores. Baldin et al. evaluated the clinicopathological features and immune scores of 221 patients with different preoperative treatments for CRLM and found that patients with high immune scores had the lowest risk of recurrence[49]; In the study by Wang et al., 249 patients with CRLM were included and the prognosis was stratified by combining the pathology score and the immune score, and it was also found that high immune score was associated with a better prognosis[50]. In the general trend, the degree of immune infiltration represents an important prognostic factor, and a high abundance of tumor-infiltrating lymphocytes has been shown to be associated with improved survival in patients with primary colon cancer. However, the application of immunotherapy in colon cancer is still in the preliminary stage of exploration, and the identification of tumor microenvironment characteristics of colon cancer may provide more reliable predictive markers for the precise implementation of clinical immunotherapy. Comparative analysis revealed significant differences in immune cell infiltration patterns between primary colon tumors and their matched liver metastases. The presence of more immunosuppressive cells in the liver may partly explain why immunotherapy is less effective in patients with liver metastases[51], providing new insights into the potential role of MK5-AS1 in tumor immunology to some extent.
To further investigate the association between MK5-AS1 and TME immune cell subtypes, “ssGSEA” and “xCell” algorithms were applied to determine the composition of immune cells in each sample of the MK5-AS1 high and low expression groups. The infiltration of naive B cells, NK cells, and CD8+ T cells was associated with patient prognosis[52]. It was found that the infiltration abundance of regulatory T cells, macrophages M0, gamma delta T cells, and CD8+ naive T cells was higher in the high expression group. These findings suggest MK5-AS1 might play a potential role in the recruitment, infiltration, and functional regulation of inflammatory and immune cells in the TME, further confirming the importance of exploring the interaction between tumor and immune cells. MK5-AS1 has also been demonstrated to exert an influence on the balance of the tumor immune microenvironment by modulating the proliferation, differentiation, and function of immune cells[53]. For example, it promotes the proliferation and activity of certain immunosuppressive cells, thereby suppressing anti-tumor immune responses. On the other hand, it may reduce immune surveillance and clearance in the tumor immune microenvironment by inhibiting the function of immune-activating cells such as dendritic cells. Furthermore, MK5-AS1 may also affect tumor cell growth and proliferation by regulating signaling pathways related to amino acid metabolism and lipid metabolism[54]. There is evidence that highly expressed MK5-AS1 can be transferred to HBV+HCC cells via M2 macrophage-derived exosomes, thereby promoting the proliferation of HBV+HCC cells by targeting c-Myc[39].
While our current immune infiltration analyses provide valuable preliminary insights into the tumor immune microenvironment associated with MK5-AS1 expression, we acknowledge that the mechanistic relationship between MK5-AS1 and immune cell recruitment requires more extensive investigation. Moving forward, we aim to explore potential correlations between MK5-AS1 expression patterns and key immunomodulatory molecules, including chemokines and cytokines. Subsequent validation through in vitro co-culture systems would help establish causal relationships, while spatial analyses using multiplex immunohistochemistry could reveal the dynamic interplay between MK5-AS1-expressing tumor cells and immune infiltrates within the tumor microenvironment. Such comprehensive approaches will be crucial for determining whether MK5-AS1 modulates immune cell recruitment primarily through chemokine regulation or an alternative biological pathway.
Although our study implicates MK5-AS1 in colon cancer hepatic metastasis, several limitations warrant consideration, particularly the absence of mechanistic validation through functional studies (e.g., knockout/overexpression experiments or migration/invasion assays), which limits mechanistic insight into how MK5-AS1 exerts its effects in colon cancer. Second, while bioinformatics analysis revealed correlations between MK5-AS1 and the tumor microenvironment, these results cannot establish causal relationships. Third, the sample size in immunohistochemistry validation may constrain the generalizability of the conclusions. In addition, it should be noted that the TCGA-COAD dataset, despite its breadth across disease stages, exhibits incomplete representation of certain molecular subtypes and less prevalent stages due to sample size constraints. Future studies with larger cohorts and functional experiments are needed to validate and expand upon these observations.
Our findings establish MK5-AS1 as a promising diagnostic and prognostic biomarker for colon cancer, offering distinct advantages over current methods. In clinical practice, this biomarker could be utilized in several key applications: first, standardized detection assays could enable non-invasive monitoring through liquid biopsies, facilitating early diagnosis and disease surveillance. Second, when combined with conventional clinicopathological parameters, MK5-AS1 expression levels may enhance prognostic accuracy by improving risk stratification for metastasis and treatment response. Third, the biomarker’s dynamic expression patterns could serve as a valuable tool for tracking disease progression and therapeutic efficacy in real time. These efforts will focus particularly on high-risk outcomes like liver metastasis and cancer-related mortality. By addressing these key challenges through prospective and retrospective cohort studies, we aim to optimize the clinical utility and facilitate the integration of MK5-AS1 into personalized treatment strategies for colon cancer patients. The observed correlations with liver metastasis and immune dysregulation suggest targetable pathways, but key challenges remain: the precise mechanistic role in tumor microenvironment modulation needs elucidation, RNA-based therapeutics face delivery and specificity hurdles, and current associations require validation through in vivo models to establish causality.
Conclusion
Integrative bioinformatics analysis of public colon cancer datasets identified MK5-AS1 as a putative prognostic biomarker and therapeutic target, with its elevated expression significantly correlated with both tumor microenvironment remodeling and liver metastasis. These findings warrant further experimental validation.
DECLARATIONS
Acknowledgments
The authors thank all participants involved in the IHC study of this research.
Authors’ contributions
Conceptualization and investigation: Wu D, Hu X
Methodology: Tang K, Wu D, Wang D, Chen J
Data curation: Hu X, Yan Q
Writing - review & editing: Tang K, Wu D
Availability of data and materials
The data that support the findings of this study are openly available in online databases mentioned in the manuscript, and are also available from the corresponding author upon reasonable request.
Financial support and sponsorship
This work was funded by the National Natural Science Foundation of China (81803325), Natural Science Foundation of Guangdong (2021A1515011175, 2024A1515011646), Guangzhou Science and Technology Project (202102080126), The Key Project of Medicine Discipline of Guangzhou (2025-2027-12), the Medical Science and Technology Foundation of Guangdong (A2024733), and Basic Research Project of Key Laboratory of Guangzhou (202102100001, 202206080008).
Conflicts of interest
Wu D is a Junior Editorial Board member of Journal of Cancer Metastasis and Treatment. Wu D was not involved in any steps of editorial processing, notably including reviewer selection, manuscript handling, or decision making, while the other authors have declared that they have no conflicts of interest.
Ethical approval and consent to participate
The study was conducted in accordance with the Declaration of Helsinki, and the use of IHC was approved by the ethics committee of Shanghai Outdo Biotech Co., Ltd (The approval code of the ethics committee is SHYJS-CP-1901001).
Consent for publication
Not applicable.
Copyright
© The Author(s) 2025.
Supplementary Materials
REFERENCES
1. Sung H, Ferlay J, Siegel RL, et al. Global cancer statistics 2020: GLOBOCAN estimates of incidence and mortality worldwide for 36 cancers in 185 countries. CA Cancer J Clin. 2021;71:209-49.
2. Devesa SS, Chow W. Variation in colorectal cancer incidence in the united states by subsite of origin. Cancer. 1993;71:3819-26.
3. Engstrand J, Nilsson H, Strömberg C, Jonas E, Freedman J. Colorectal cancer liver metastases - a population-based study on incidence, management and survival. BMC Cancer. 2018;18:78.
4. Xu R, Wang W, Zhu B, et al. Disease characteristics and treatment patterns of Chinese patients with metastatic colorectal cancer: a retrospective study using medical records from China. BMC Cancer. 2020;20:131.
5. Liu SJ, Dang HX, Lim DA, Feng FY, Maher CA. Long noncoding RNAs in cancer metastasis. Nat Rev Cancer. 2021;21:446-60.
6. Chen S, Shen X. Long noncoding RNAs: functions and mechanisms in colon cancer. Mol Cancer. 2020;19:167.
7. Wu K, Xu T, Song X, et al. LncRNA SLCO4A1-AS1 modulates colon cancer stem cell properties by binding to miR-150-3p and positively regulating SLCO4A1. Lab Invest. 2021;101:908-20.
8. Chen Q, Zhou L, Ma D, et al. LncRNA GAS6-AS1 facilitates tumorigenesis and metastasis of colorectal cancer by regulating TRIM14 through miR-370-3p/miR-1296-5p and FUS. J Transl Med. 2022;20:356.
9. Yang T, Chen WC, Shi PC, et al. Long noncoding RNA MAPKAPK5-AS1 promotes colorectal cancer progression by cis-regulating the nearby gene MK5 and acting as a let-7f-1-3p sponge. J Exp Clin Cancer Res. 2020;39:139.
10. Ji H, Hui B, Wang J, et al. Long noncoding RNA MAPKAPK5-AS1 promotes colorectal cancer proliferation by partly silencing p21 expression. Cancer Sci. 2019;110:72-85.
11. Gao GF, Parker JS, Reynolds SM, et al. Before and after: comparison of legacy and harmonized TCGA genomic data commons' data. Cell Syst. 2019;9:24-34.e10.
12. Barrett T, Wilhite SE, Ledoux P, et al. NCBI GEO: archive for functional genomics data sets-update. Nucleic Acids Res. 2013;41:D991-5.
13. Oughtred R, Stark C, Breitkreutz BJ, et al. The BioGRID interaction database: 2019 update. Nucleic Acids Res. 2019;47:D529-41.
14. Sherman BT, Hao M, Qiu J, et al. DAVID: a web server for functional enrichment analysis and functional annotation of gene lists (2021 update). Nucleic Acids Res. 2022;50:W216-21.
15. Tang Z, Li C, Kang B, Gao G, Li C, Zhang Z. GEPIA: a web server for cancer and normal gene expression profiling and interactive analyses. Nucleic Acids Res. 2017;45:W98-102.
16. Gao J, Aksoy BA, Dogrusoz U, et al. Integrative analysis of complex cancer genomics and clinical profiles using the cBioPortal. Sci Signal. 2013;6:pl1.
17. Shen W, Song Z, Zhong X, et al. Sangerbox: a comprehensive, interaction-friendly clinical bioinformatics analysis platform. Imeta. 2022;1:e36.
18. Aran D, Hu Z, Butte AJ. xCell: digitally portraying the tissue cellular heterogeneity landscape. Genome Biol. 2017;18:220.
19. Chandrashekar DS, Karthikeyan SK, Korla PK, et al. UALCAN: an update to the integrated cancer data analysis platform. Neoplasia. 2022;25:18-27.
20. Shi Y, Zhuang Y, Zhang J, Chen M, Wu S. Identification of tumorigenic and prognostic biomarkers in colorectal cancer based on microRNA expression profiles. Biomed Res Int. 2020;2020:7136049.
21. Jin W. Novel insights into PARK7 (DJ-1), a potential anti-cancer therapeutic target, and implications for cancer progression. J Clin Med. 2020;9:1256.
23. Hofseth LJ, Hebert JR, Chanda A, et al. Early-onset colorectal cancer: initial clues and current views. Nat Rev Gastroenterol Hepatol. 2020;17:352-64.
24. Degirolamo C, Modica S, Palasciano G, Moschetta A. Bile acids and colon cancer: solving the puzzle with nuclear receptors. Trends Mol Med. 2011;17:564-72.
25. Konishi T, Shimada Y, Hsu M, et al. Association of preoperative and postoperative serum carcinoembryonic antigen and colon cancer outcome. JAMA Oncol. 2018;4:309-15.
26. Nakamura Y, Shida D, Tanabe T, et al. Prognostic impact of preoperatively elevated and postoperatively normalized carcinoembryonic antigen levels following curative resection of stage I-III rectal cancer. Cancer Med. 2020;9:653-62.
27. Zhao H, Hu S, Qi J, et al. Increased expression of HOXA11-AS attenuates endometrial decidualization in recurrent implantation failure patients. Mol Ther. 2022;30:1706-20.
30. Wu Z, Lu Z, Li L, et al. Identification and validation of ferroptosis-related LncRNA signatures as a novel prognostic model for colon cancer. Front Immunol. 2021;12:783362.
31. Xu M, Mu J, Wang J, Zhou Q, Wang J. Construction and validation of a cuproptosis-related lncRNA signature as a novel and robust prognostic model for colon adenocarcinoma. Front Oncol. 2022;12:961213.
32. Li X, Yang L, Wang W, Rao X, Lai Y. Constructing a prognostic immune-related lncRNA model for colon cancer. Medicine. 2022;101:e30447.
33. Yue B, Liu C, Sun H, et al. A positive feed-forward loop between LncRNA-CYTOR and Wnt/β-catenin signaling promotes metastasis of colon cancer. Mol Ther. 2018;26:1287-98.
34. Bo H, Fan L, Li J, et al. High expression of lncRNA AFAP1-AS1 promotes the progression of colon cancer and predicts poor prognosis. J Cancer. 2018;9:4677-83.
35. Yang Q, Wang X, Tang C, Chen X, He J. [Retracted] H19 promotes the migration and invasion of colon cancer by sponging miR-138 to upregulate the expression of HMGA1. Int J Oncol. 2021;58:26.
36. Cheng B, Rong A, Zhou Q, Li W. LncRNA LINC00662 promotes colon cancer tumor growth and metastasis by competitively binding with miR-340-5p to regulate CLDN8/IL22 co-expression and activating ERK signaling pathway. J Exp Clin Cancer Res. 2020;39:5.
37. Shan Y, Ma J, Pan Y, Hu J, Liu B, Jia L. LncRNA SNHG7 sponges miR-216b to promote proliferation and liver metastasis of colorectal cancer through upregulating GALNT1. Cell Death Dis. 2018;9:722.
38. Wang L, Sun L, Liu R, et al. Long non-coding RNA MAPKAPK5-AS1/PLAGL2/HIF-1α signaling loop promotes hepatocellular carcinoma progression. J Exp Clin Cancer Res. 2021;40:72.
39. Tao L, Li D, Mu S, Tian G, Yan G. LncRNA MAPKAPK5_AS1 facilitates cell proliferation in hepatitis B virus -related hepatocellular carcinoma. Lab Invest. 2022;102:494-504.
40. Lv E, Sheng J, Yu C, Rao D, Huang W. Long noncoding RNA MAPKAPK5-AS1 promotes metastasis through regulation miR-376b-5p/ECT2 axis in hepatocellular carcinoma. Dig Liver Dis. 2023;55:945-54.
41. Meng S, Jian Z, Yan X, Li J, Zhang R. LncRNA SNHG6 inhibits cell proliferation and metastasis by targeting ETS1 via the PI3K/AKT/mTOR pathway in colorectal cancer. Mol Med Rep. 2019;20:2541-8.
42. Lin S, Wang H, Yang W, Wang A, Geng C. Silencing of long non-coding RNA colon cancer-associated transcript 2 inhibits the growth and metastasis of gastric cancer through blocking mTOR signaling [Retraction]. Onco Targets Ther. 2022;15:1507-8.
43. Cai Q, Zhou W, Wang W, et al. MAPK6-AKT signaling promotes tumor growth and resistance to mTOR kinase blockade. Sci Adv. 2021;7:eabi6439.
45. Polidoro MA, Milana F, Soldani C, et al. Impact of RAS mutations on the immune infiltrate of colorectal liver metastases: a preliminary study. J Leukoc Biol. 2020;108:715-21.
46. Kakar S, Deng G, Sahai V, et al. Clinicopathologic characteristics, CpG island methylator phenotype, and BRAF mutations in microsatellite-stable colorectal cancers without chromosomal instability. Arch Pathol Lab Med. 2008;132:958-64.
47. Bertocchi A, Carloni S, Ravenda PS, et al. Gut vascular barrier impairment leads to intestinal bacteria dissemination and colorectal cancer metastasis to liver. Cancer Cell. 2021;39:708-24.e11.
48. Wang H, Zhang B, Li R, et al. KIAA1199 drives immune suppression to promote colorectal cancer liver metastasis by modulating neutrophil infiltration. Hepatology. 2022;76:967-81.
49. Baldin P, Van den Eynde M, Mlecnik B, et al. Prognostic assessment of resected colorectal liver metastases integrating pathological features, RAS mutation and Immunoscore. J Pathol Clin Res. 2021;7:27-41.
50. Wang Y, Lin HC, Huang MY, et al. The immunoscore system predicts prognosis after liver metastasectomy in colorectal cancer liver metastases. Cancer Immunol Immunother. 2018;67:435-44.
51. Zhou SN, Pan WT, Pan MX, et al. Comparison of immune microenvironment between colon and liver metastatic tissue in colon cancer patients with liver metastasis. Dig Dis Sci. 2021;66:474-82.
52. Schaafsma E, Jiang C, Cheng C. B cell infiltration is highly associated with prognosis and an immune-infiltrated tumor microenvironment in neuroblastoma. J Cancer Metastasis Treat. 2021;7:34.
53. Ge J, Tao M, Zhang G, Cai J, Li D, Tao L. New HCC subtypes based on CD8 tex-related lncRNA signature could predict prognosis, immunological and drug sensitivity characteristics of hepatocellular carcinoma. J Hepatocell Carcinoma. 2024;11:1331-55.
Cite This Article
How to Cite
Download Citation
Export Citation File:
Type of Import
Tips on Downloading Citation
Citation Manager File Format
Type of Import
Direct Import: When the Direct Import option is selected (the default state), a dialogue box will give you the option to Save or Open the downloaded citation data. Choosing Open will either launch your citation manager or give you a choice of applications with which to use the metadata. The Save option saves the file locally for later use.
Indirect Import: When the Indirect Import option is selected, the metadata is displayed and may be copied and pasted as needed.
About This Article
Copyright

Data & Comments
Data
0


Comments
Comments must be written in English. Spam, offensive content, impersonation, and private information will not be permitted. If any comment is reported and identified as inappropriate content by OAE staff, the comment will be removed without notice. If you have any queries or need any help, please contact us at support@oaepublish.com.