


fig1
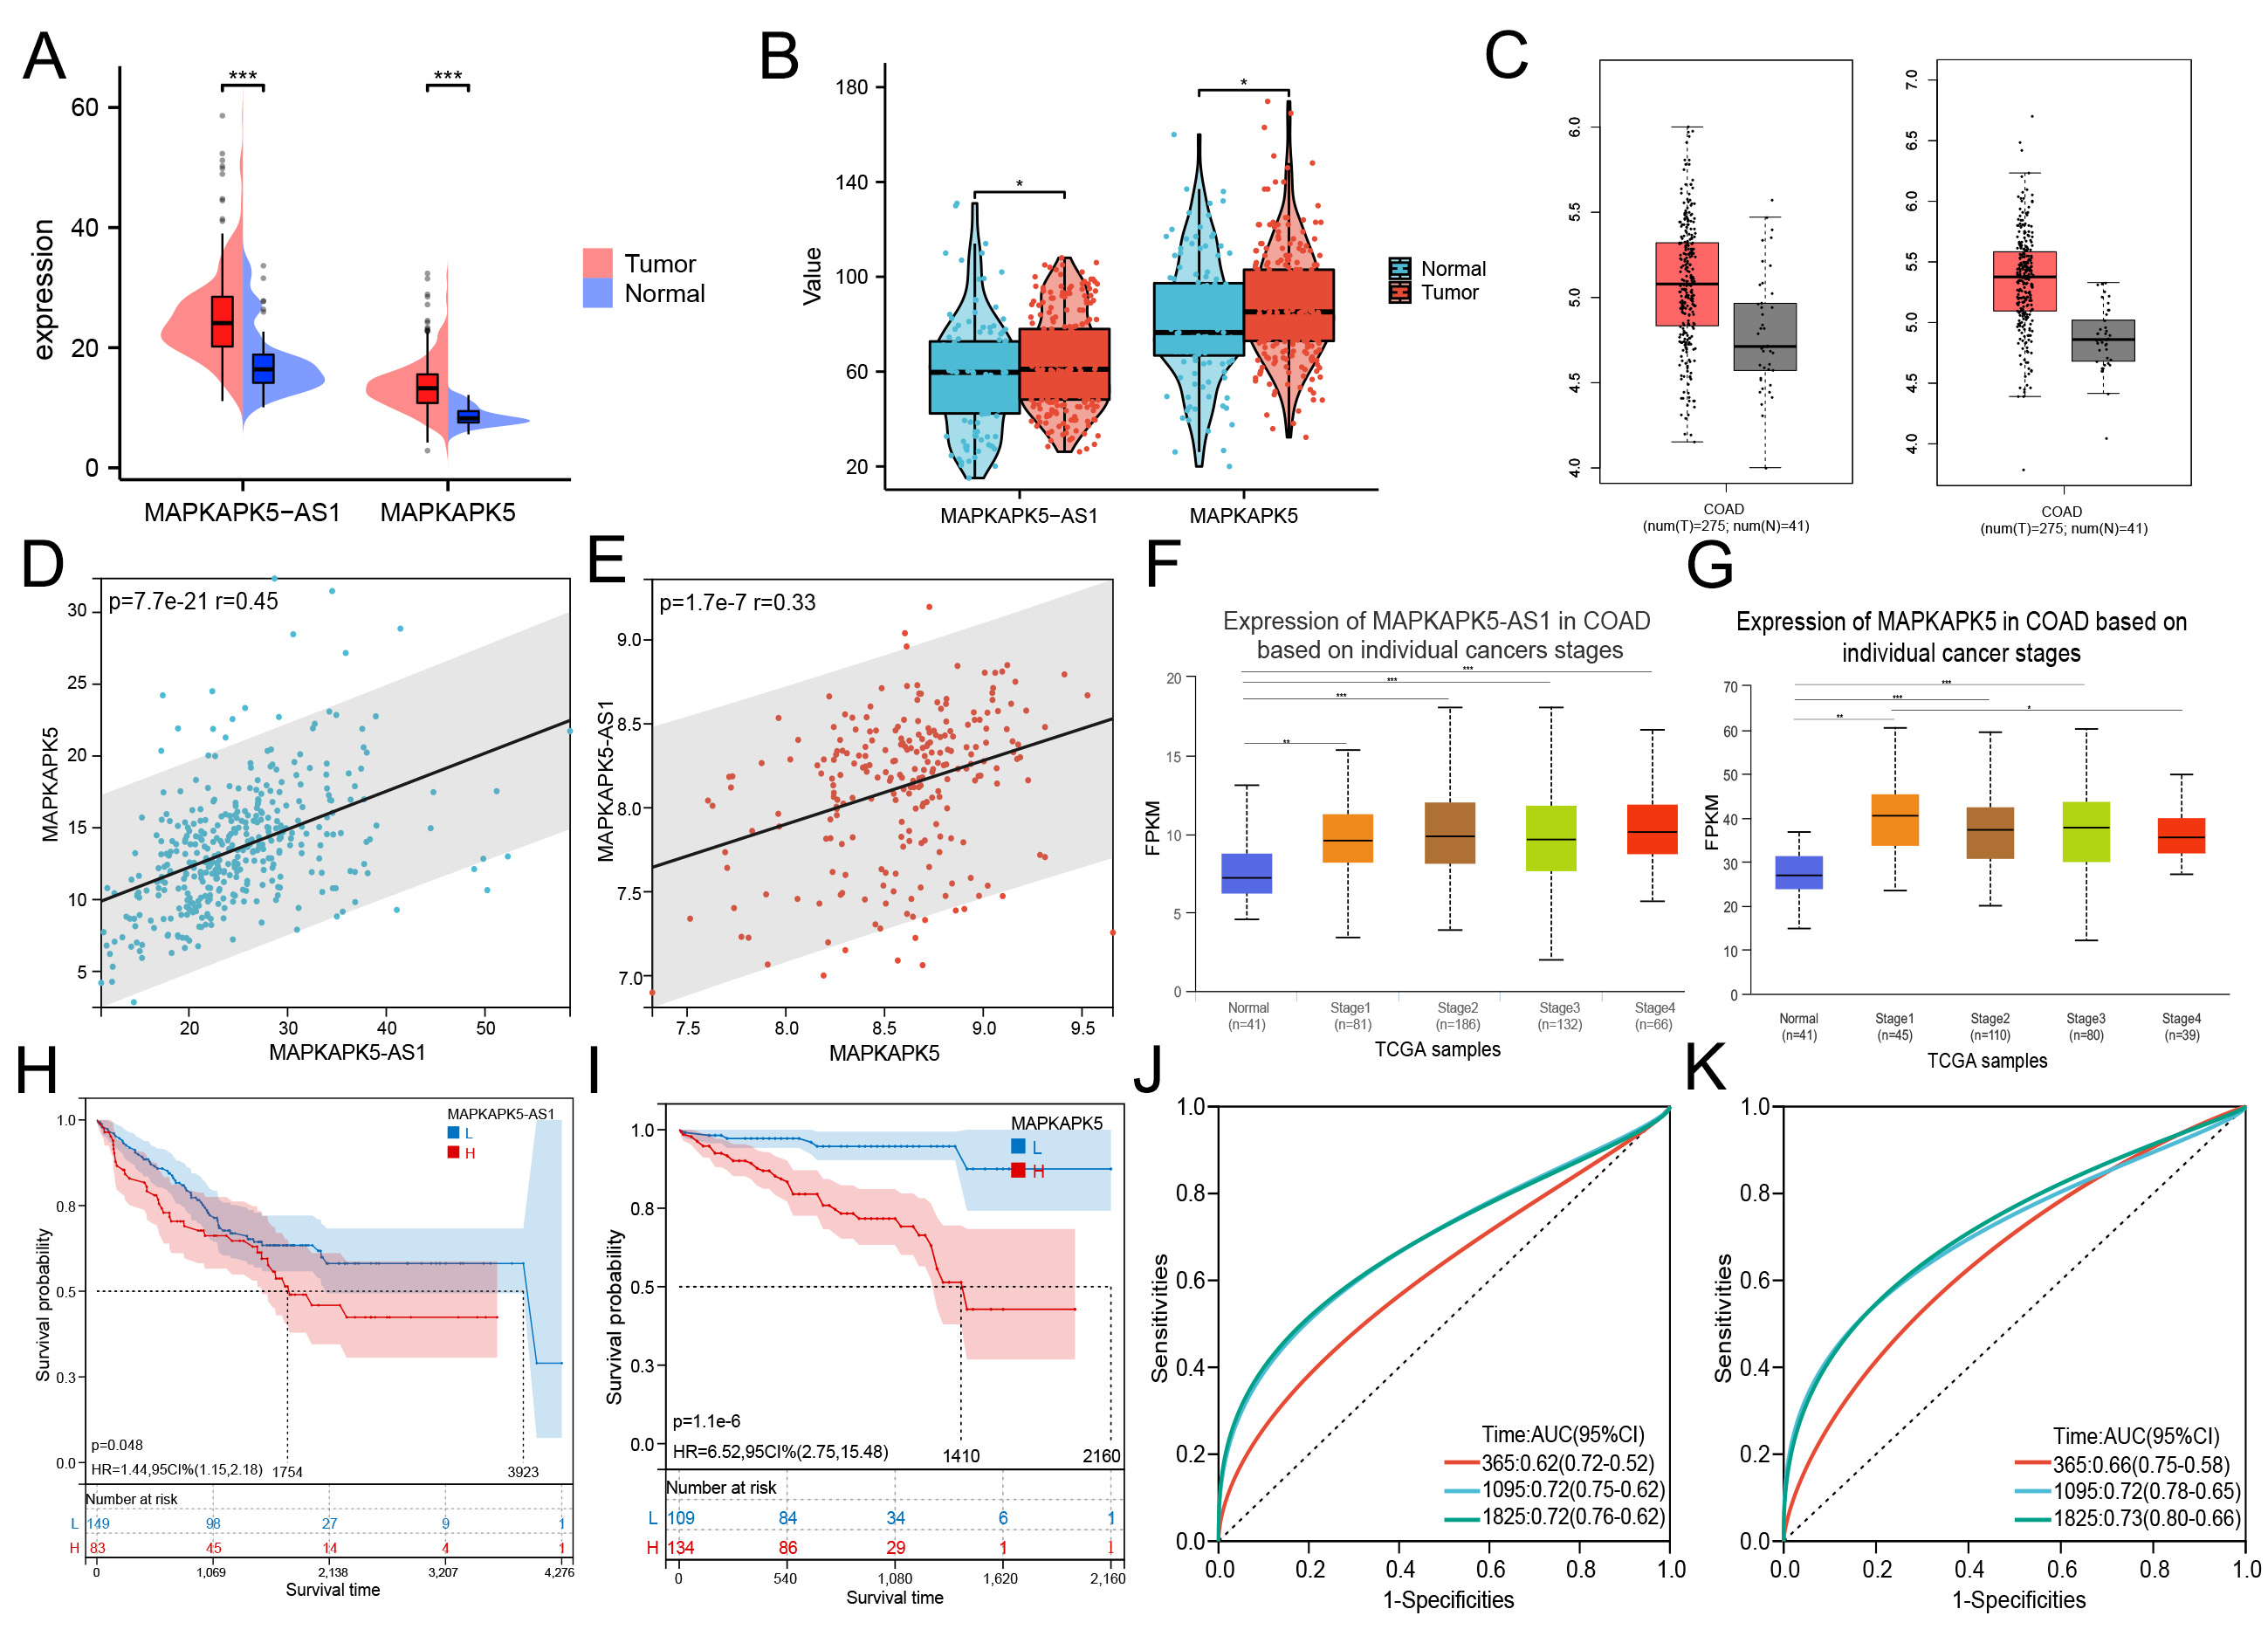
Figure 1. Differential expression of MK5-AS1 and MK5 in colon cancer compared to normal tissues and clinical prognosis analysis. (A-C) Comparison of MK5-AS1 and MK5 expression in colon cancer tissues and normal tissues based on TCGA-COAD, GSE41258, and GEPIA 2.0. (D and E) Significant positive correlations were observed between MK5-AS1 and MK5 expression in TCGA-COAD patients and GSE41258. (F and G) Expression status of MK5-AS1 and MK5 in patients with different clinical stages based on the UALCAN database. (H-K) Prognostic analysis of MK5-AS1, MK5 and ROC curves of corresponding 1, 3, and 5-year survival rates. *P < 0.05, **P < 0.01, ***P < 0.001.


