


fig4
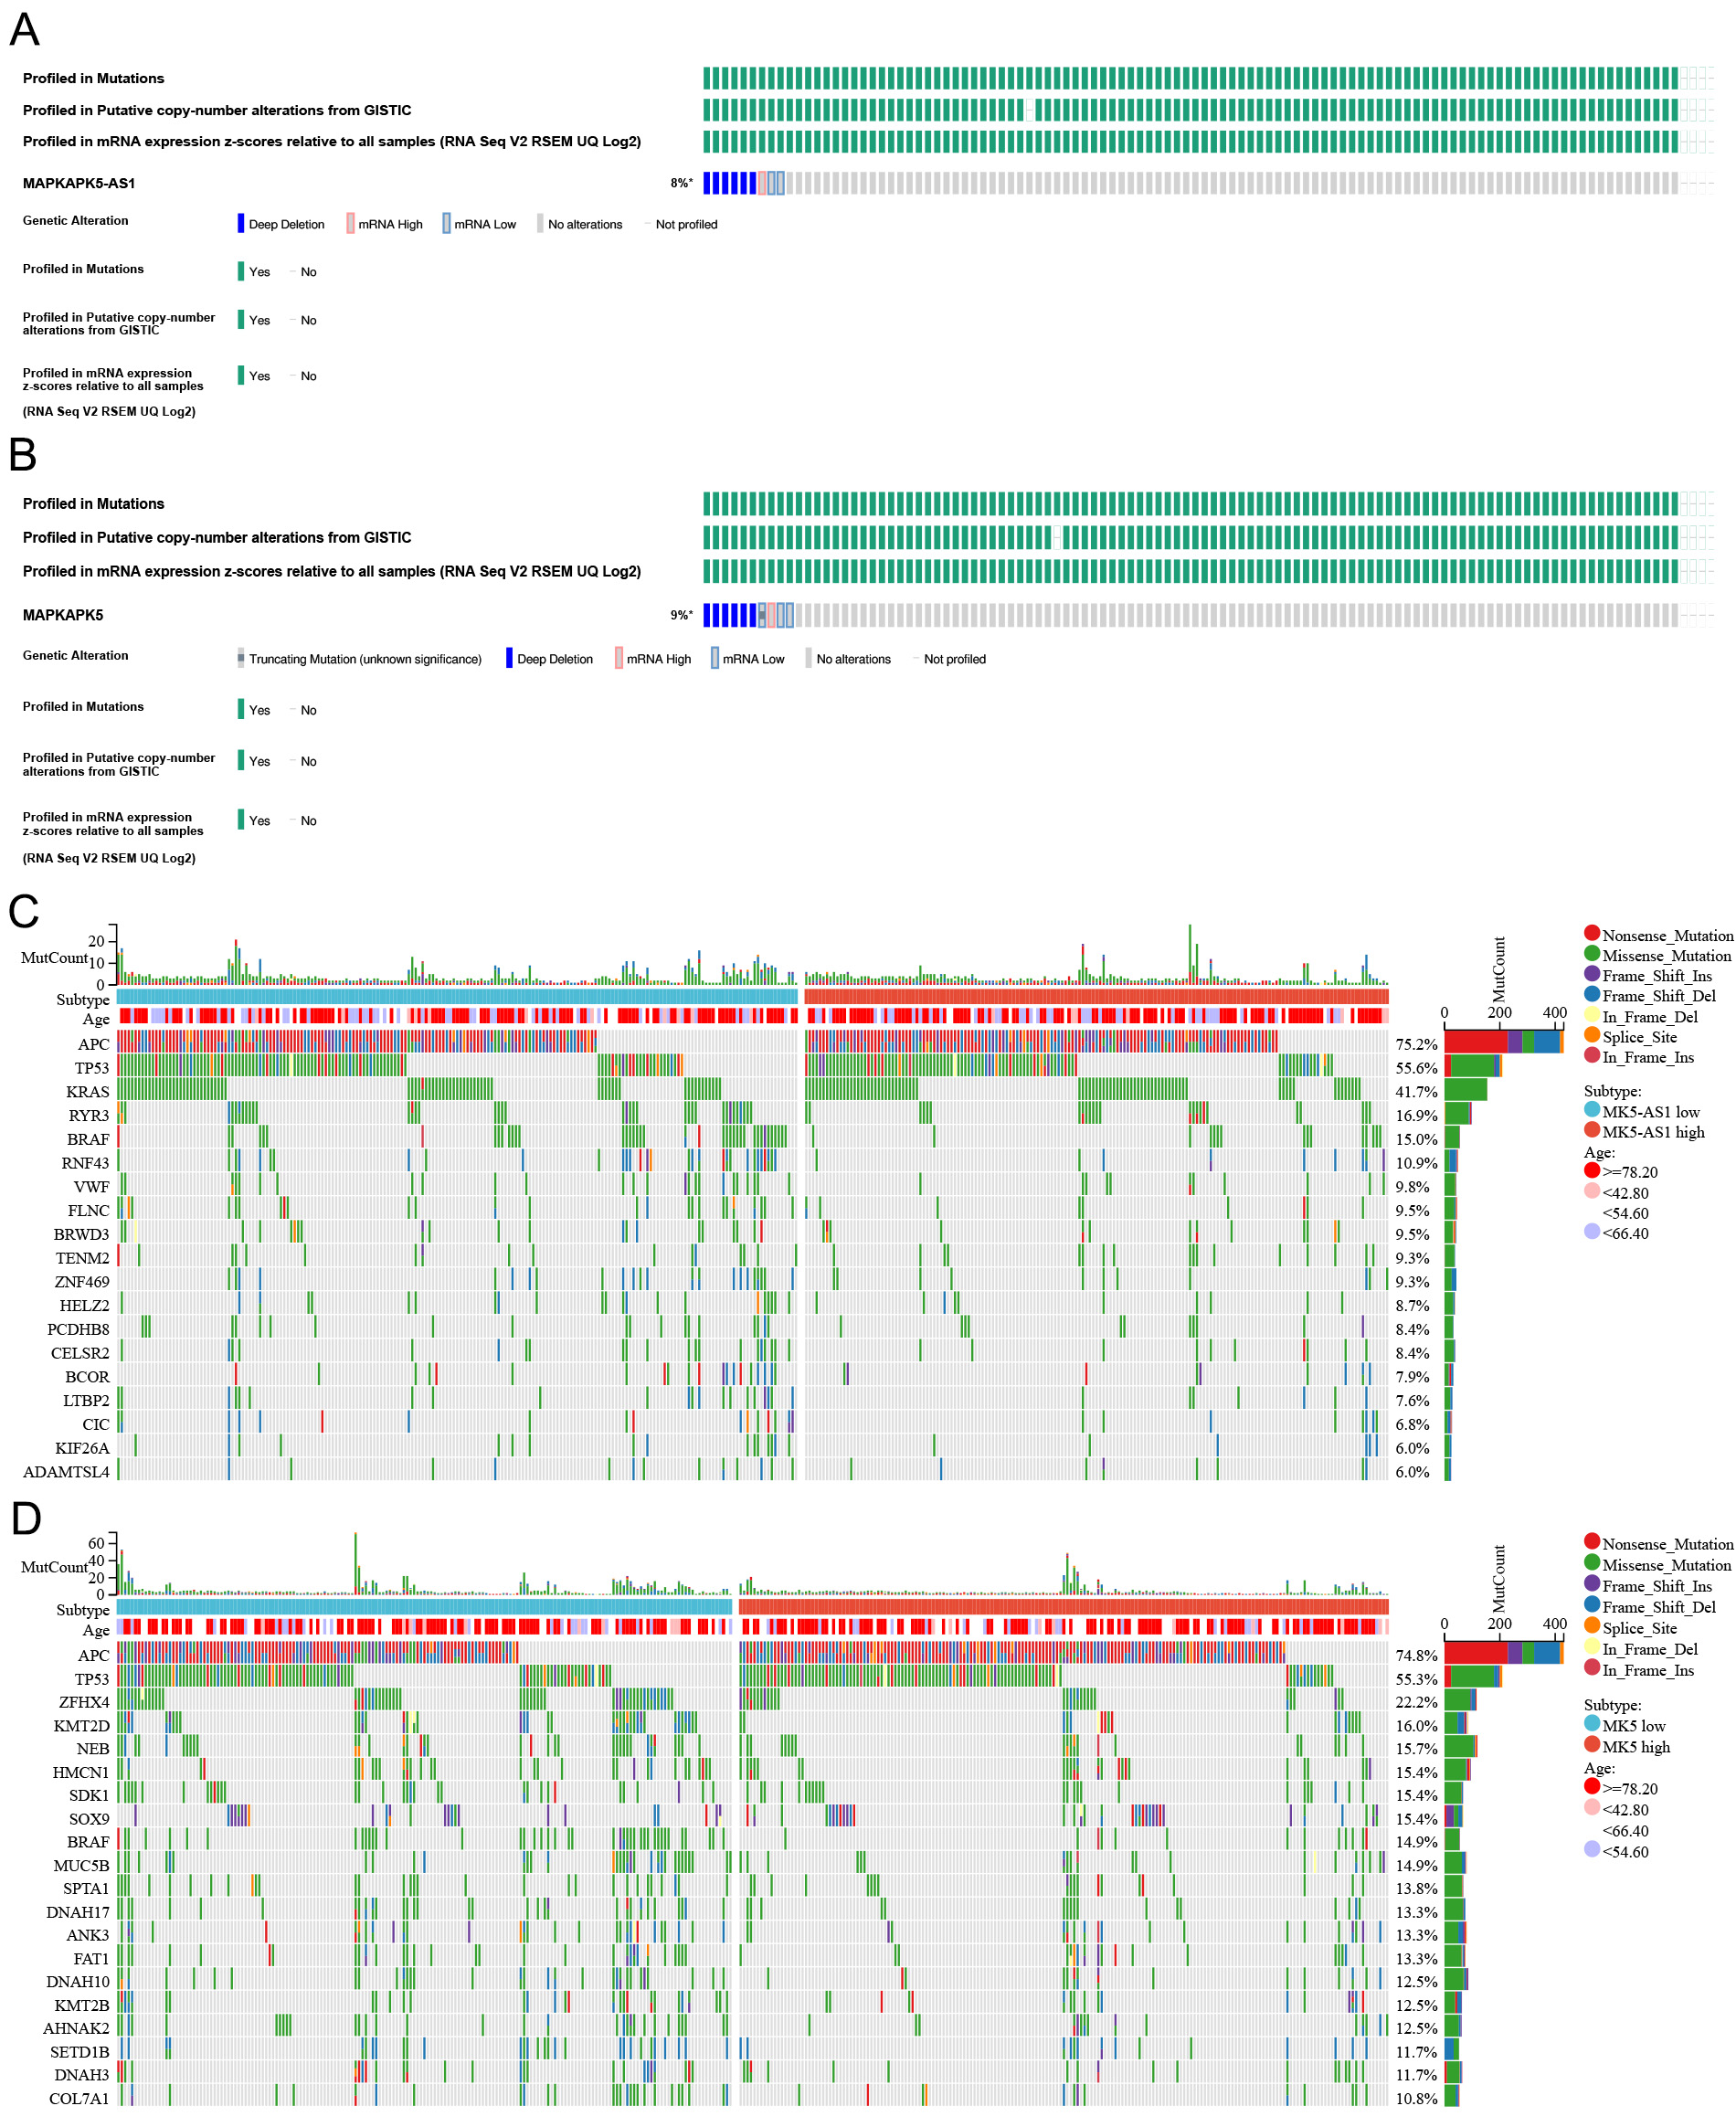
Figure 4. Gene mutation analysis. (A and B) Oncoprint plots of MK5-AS1 and MK5 in the ciBioPortal database. (C and D) The top 20 genes with the highest mutation frequency in the high and low expression groups of MK5-AS1 and MK5.
Figure 4. Gene mutation analysis. (A and B) Oncoprint plots of MK5-AS1 and MK5 in the ciBioPortal database. (C and D) The top 20 genes with the highest mutation frequency in the high and low expression groups of MK5-AS1 and MK5.


All published articles are preserved here permanently:
https://www.portico.org/publishers/oae/
