


fig5
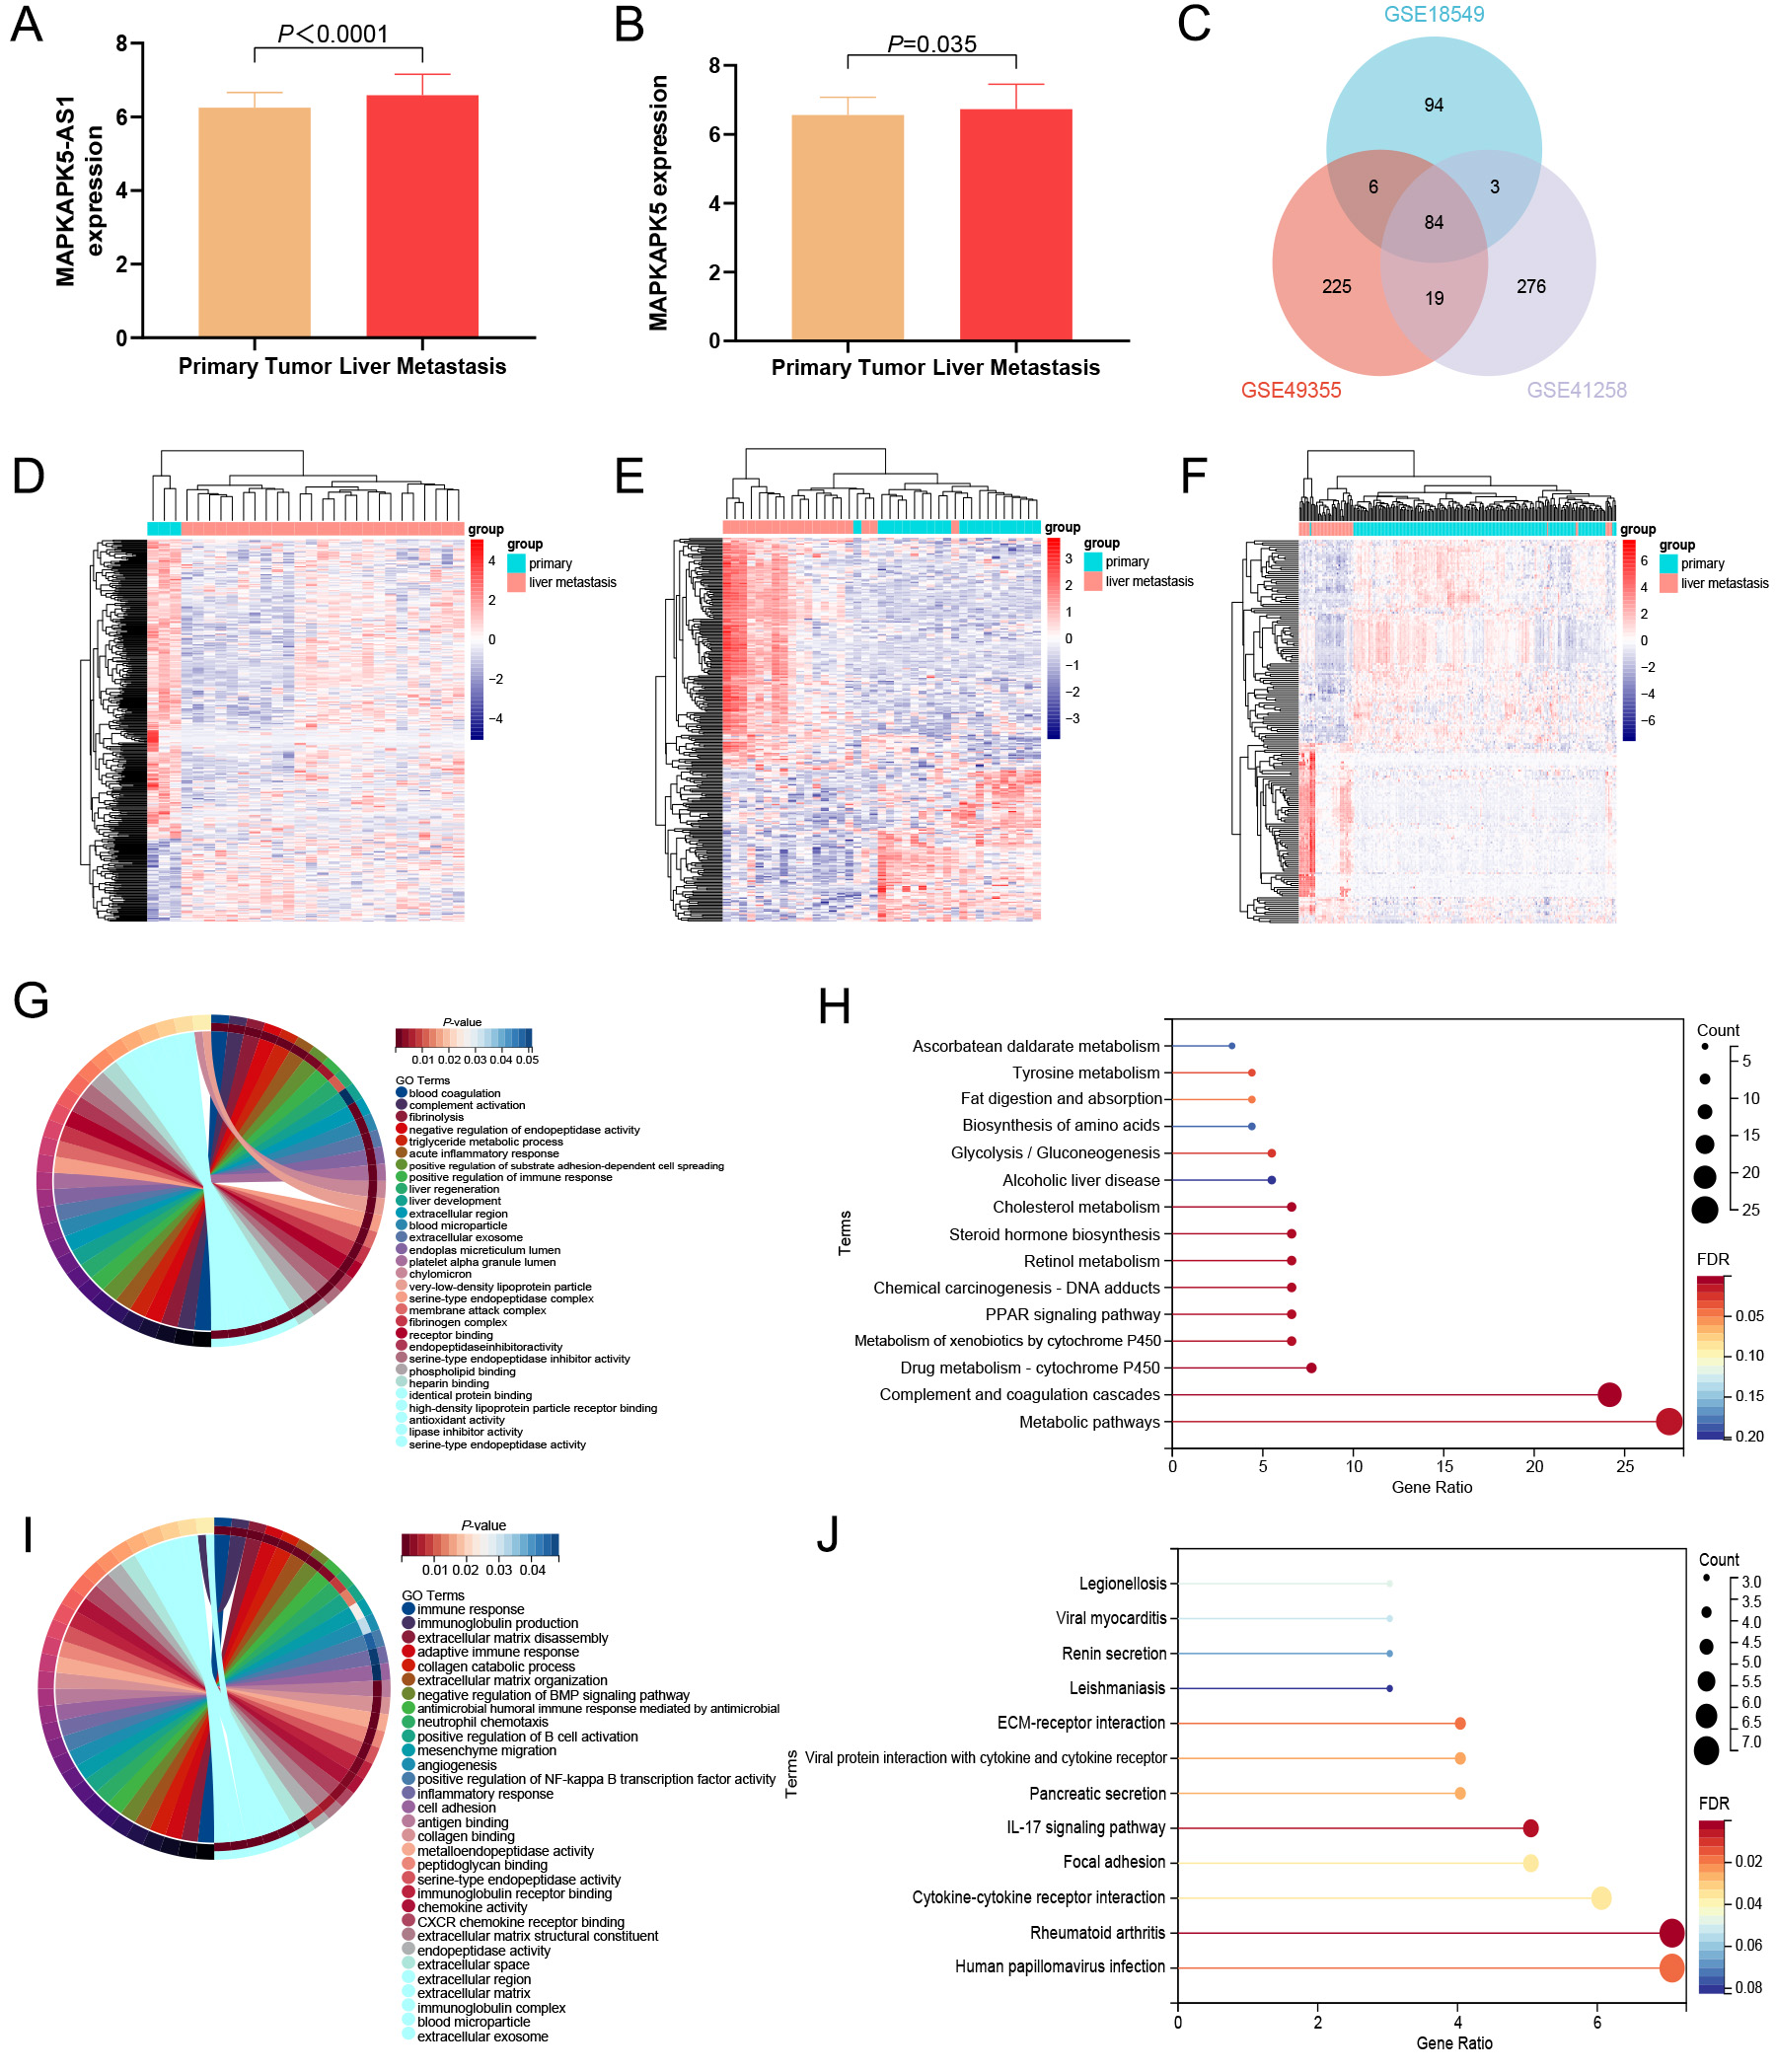
Figure 5. Expression status and functional enrichment analysis of MK5-AS1 and MK5 in liver metastasis and colon cancer tissues. (A and B) MK5-AS1 and MK5 were significantly upregulated in liver metastasis. (C) Venn diagram showing the intersection of DEGs in three GEO datasets. (D-F) Heat maps of DEGs expression (GSE49355, GSE41258, and GSE18549) in colon cancer and liver metastases. (G and H) GO and KEGG analysis of upregulated genes. (I and J) GO and KEGG analysis of downregulated genes.


