



In silico analysis of LGR6 as a tumor suppressor in prostate cancer
 0
0 Abstract
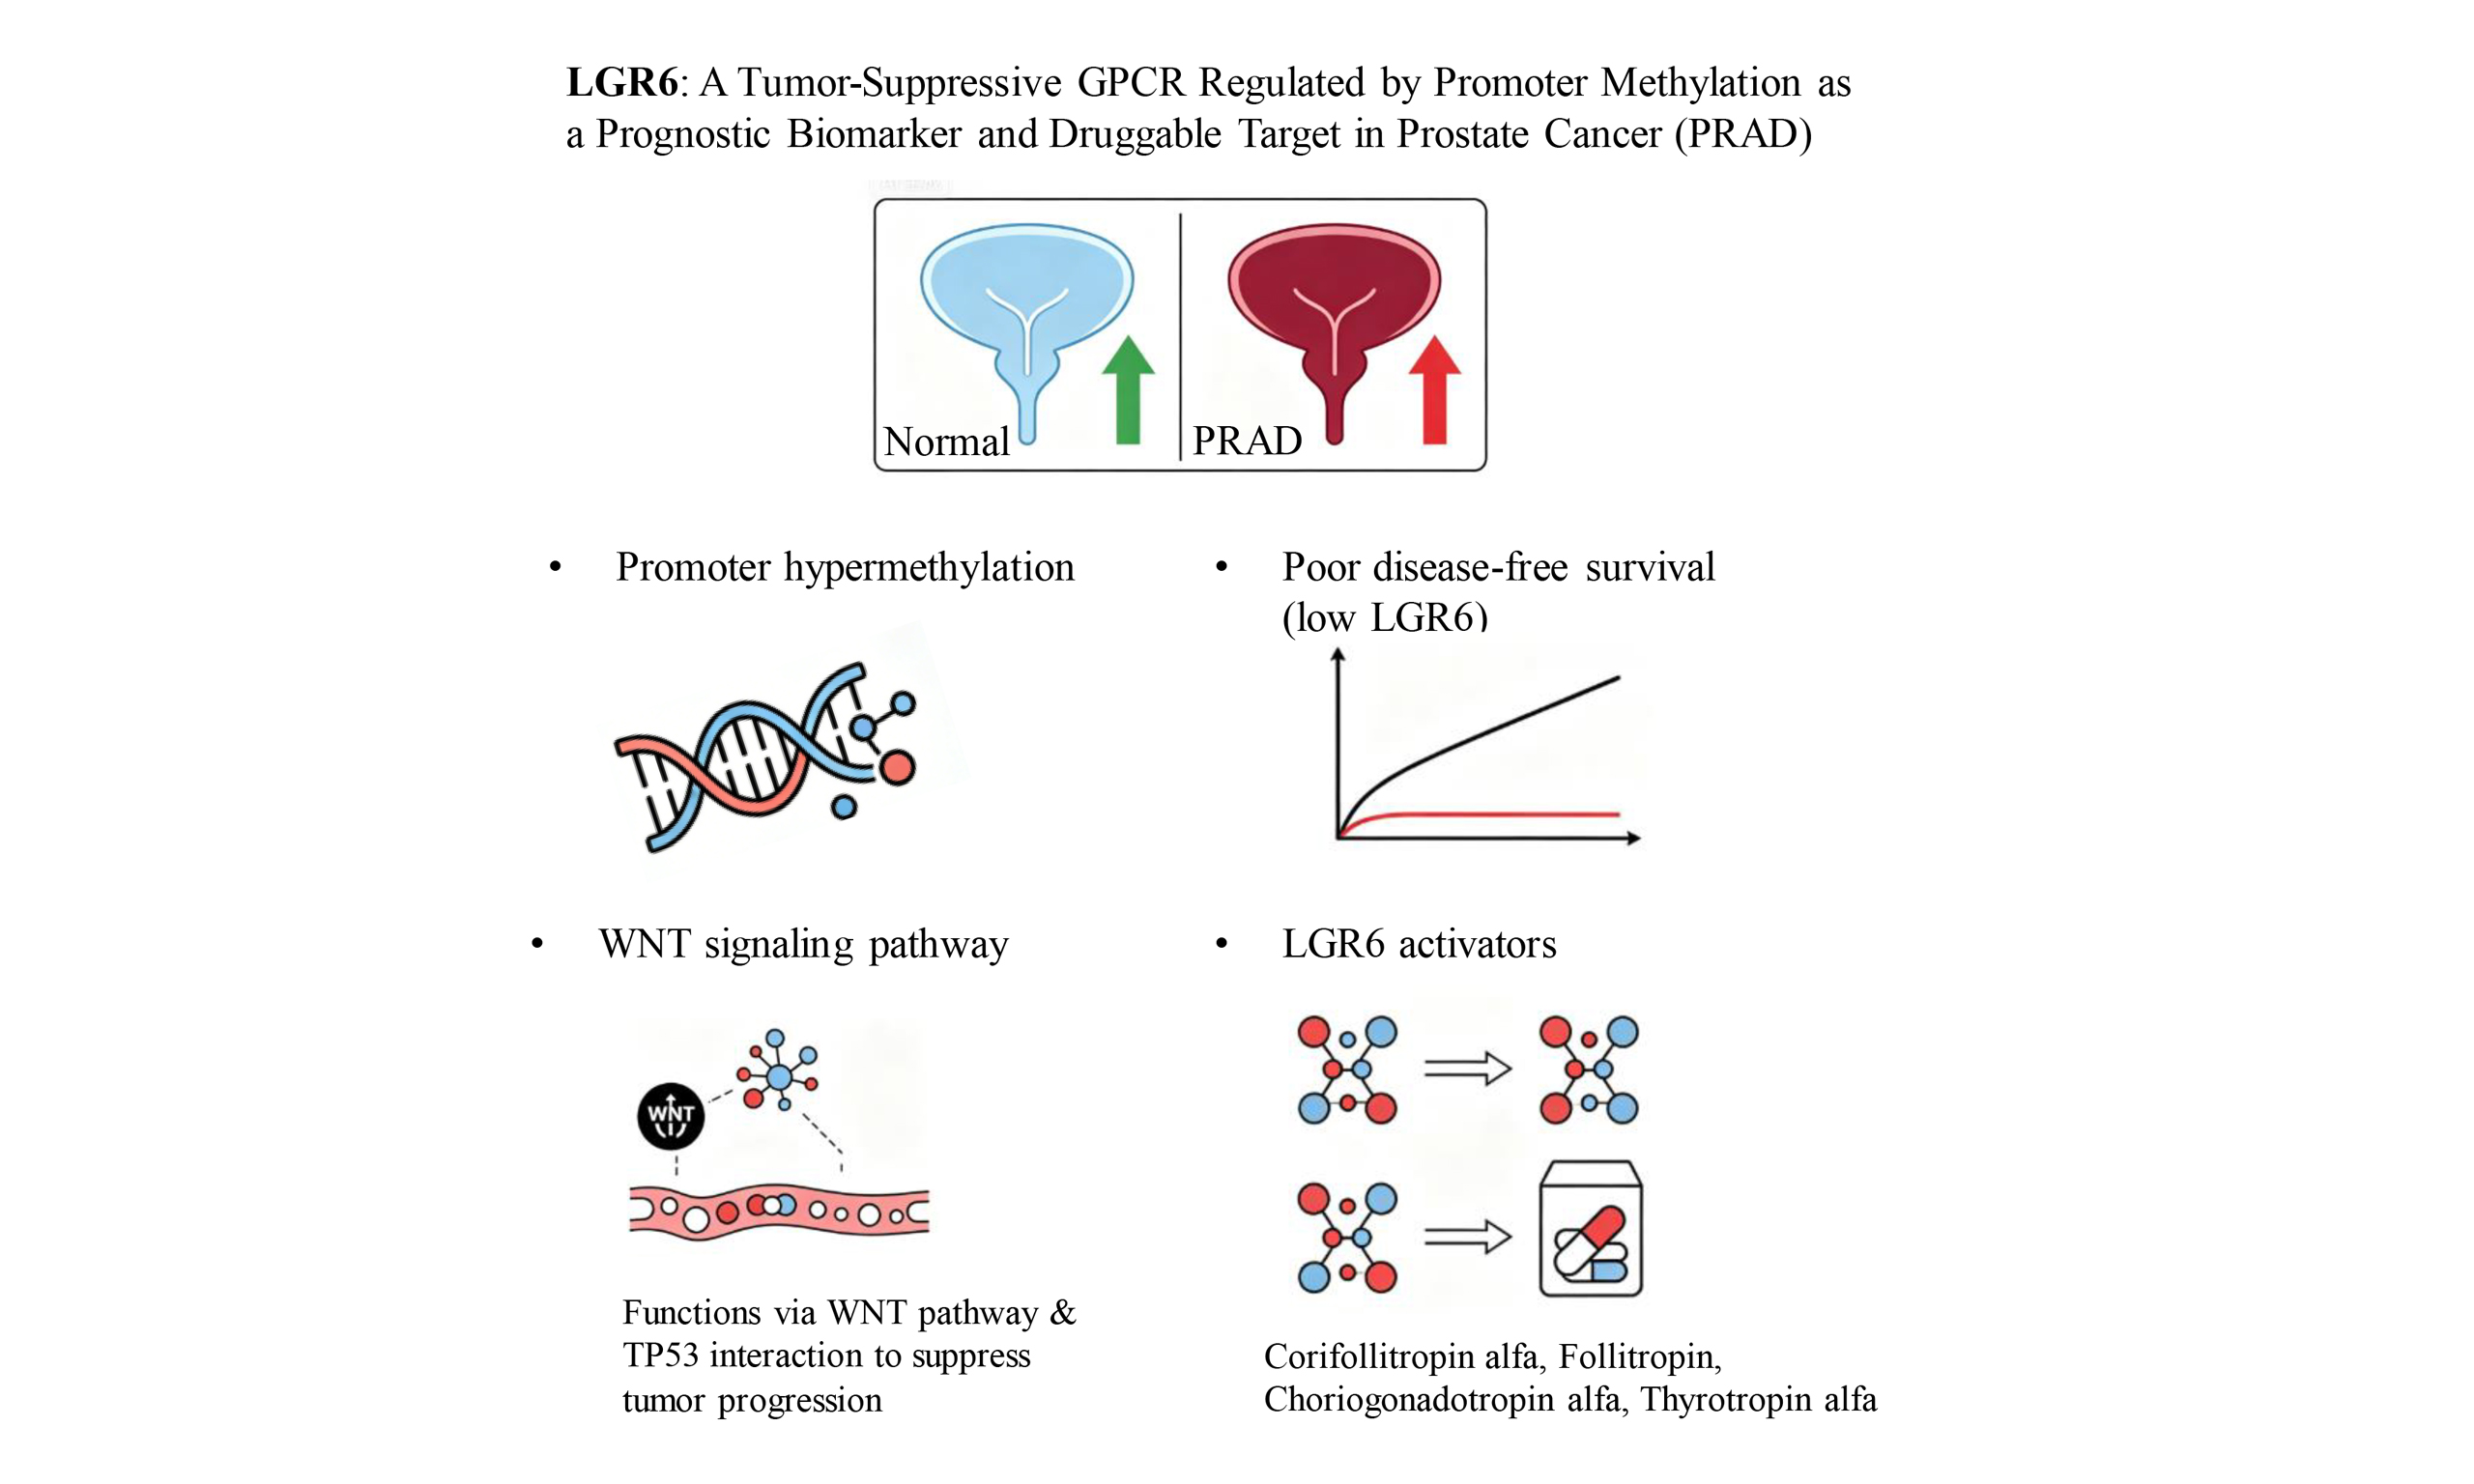
Aim: Prostate cancer (PRAD) is the second most prevalent male malignancy globally, and advanced castration-resistant PRAD lacks effective targeted therapies. As a G protein-coupled receptor (GPCR), leucine-rich repeat-containing G-protein coupled receptor 6 (LGR6) is poorly understood in PRAD. This study aimed to clarify its biological role, regulatory mechanism, prognostic value, and therapeutic potential via in silico analysis.
Methods: Multi-omics data including transcriptome, methylation, mutation, and clinical information from public databases were integrated. Differential expression, survival, and clinical correlation analyses were performed using edgeR, DESeq2, limma, and Kaplan-Meier methods. Epigenetic regulation, mutation landscape, and co-expression networks were examined. Functional enrichment, stemness index correlation, protein structure prediction, molecular docking, and drug repurposing were conducted to explore mechanisms and candidate agents.
Results: LGR6 was the most significantly down-regulated GPCR in PRAD, and its low expression predicted poor disease-free survival and advanced clinicopathological features (Gleason score, T stage, N stage). Down-regulation was caused by promoter hypermethylation, not alternative splicing or somatic mutations. LGR6 was closely associated with WNT signaling and cancer stemness, and showed a predicted association with tumor suppressor tumor suppressor protein P53 (TP53). Conserved domains and structural similarity to leucine-rich repeat-containing G-protein coupled receptor 1-3 (LGR1-3) enabled the identification of multiple existing drugs as potential LGR6 agonists.
Discussion: LGR6 functions as a putative tumor suppressor in PRAD, and its epigenetic silencing may contribute to disease progression through WNT signaling and the TP53 network. LGR6 is a robust prognostic biomarker and a potential therapeutic target. Drug repurposing of LGR1-3 agonists represents a speculative strategy that requires experimental validation for PRAD treatment. These findings support LGR6 as a novel molecular target for precision therapy of advanced prostate cancer.
Keywords
INTRODUCTION
Prostate cancer continues to be the second most commonly diagnosed malignancy in men worldwide, with increasing incidence rates in aging populations[1-3]. Despite advances in early detection and localized treatment, metastatic castration-resistant prostate cancer poses significant therapeutic challenges[4,5]. The current arsenal of targeted therapies remains limited, particularly for patients who develop resistance to androgen receptor pathway inhibitors[5-9]. This pressing clinical dilemma necessitates the discovery of novel molecular targets and the development of innovative treatment strategies to improve survival outcomes and quality of life for advanced-stage patients[10,11].
The G protein-coupled receptor (GPCR) superfamily comprises over 800 members and represents the largest class of druggable targets in the human genome[12]. Approximately 30% of currently marketed drugs target GPCRs, demonstrating their established therapeutic value[13]. In oncology, several GPCRs have emerged as promising targets due to their crucial roles in tumor growth, metastasis, and tumor microenvironment modulation[14,15]. However, within the leucine-rich repeat-containing G-protein coupled receptor (LGR) subfamily of GPCRs, which are characterized by their large extracellular domains and roles in stem cell biology, the exploration in prostate cancer remains in its infancy[16-18]. The therapeutic potential of many orphan LGR receptors awaits systematic investigation in the context of prostate carcinogenesis.
Our research employed a systematic multi-stage approach to address these gaps. Initially, we conducted comprehensive bioinformatic screening of GPCR expression patterns in large-scale prostate cancer cohorts, leading to the identification of leucine-rich repeat-containing G-protein coupled receptor 6 (LGR6) as a prominently dysregulated receptor with significant prognostic implications. LGR6 is known to participate in tumorigenesis and progression in multiple other cancer types by regulating the WNT signaling pathway, but its role in prostate cancer (PRAD) remains unexplored[19,20]. Subsequently, we employed integrated multi-omics analyses to decipher the epigenetic regulatory mechanisms governing LGR6 expression, particularly focusing on promoter methylation events. Beyond mechanistic insights, our study pioneers the exploration of LGR6’s therapeutic vulnerability through structural pharmacology and drug repurposing strategies. This comprehensive investigation not only establishes LGR6 as a clinically relevant biomarker but also provides a rational framework for targeting this receptor in precision medicine approaches for prostate cancer.
METHODS
Data acquisition and processing
Transcriptomic data, methylation profiles, and clinical information for PRAD were obtained from the Cancer Genome Atlas (TCGA, https://portal.gdc.cancer.gov). Normal prostate tissue expression data were sourced from the Genotype-Tissue Expression (GTEx,
Both datasets contain prostate cancer samples with matched clinical information. GSE150692 includes RNA-seq data from a large cohort with long-term follow-up, suitable for survival analysis. GSE141445 provides gene expression profiles from both tumor and adjacent normal tissues, allowing differential expression analysis. Both datasets are publicly available on GEO and have been used in previous prostate cancer bioinformatics studies. A curated list of 830 GPCR genes was compiled from existing literature and genomic databases for focused screening[13,23-25].
Differential expression analysis
Differential expression analysis was performed using three widely accepted algorithms: edgeR, DESeq2, and limma[26-28]. Raw counts were normalized and transformed using log2(TPM + 0.1). Genes with |log2(Fold Change)| > 1.5 and false discovery rate (FDR) < 0.05 were considered significantly differentially expressed. The final set of robust differentially expressed genes (DEGs) was defined as the intersection of DEGs identified by all three methods. In detail, differential expression analysis using edgeR and DESeq2 was performed on raw count data. For limma, normalized TPM values were log2-transformed (log2 (TPM + 0.1)). The expression matrix used in the main results section (e.g., heatmaps) was based on log2 (TPM + 0.1). The intersection of DEGs from the three methods was used for downstream analysis to minimize false positives.
Survival and clinical correlation analysis
Kaplan-Meier survival curves were generated based on gene expression levels (high vs. low, stratified by median expression). The log-rank test was used to assess the statistical significance of differences in disease-free survival. Associations between gene expression and clinical parameters (Gleason score, T stage, N stage) were evaluated using the Kruskal-Wallis test or Mann-Whitney U test for categorical variables.
Methylation and alternative splicing analysis
Methylation levels in the promoter region of LGR6 were compared between tumor and normal samples using beta values from the Illumina Infinium Methylation Assay. Statistical significance was assessed with the Mann-Whitney U test. Major transcript isoforms of LGR6 were identified using transcript-level TPM values from TCGA and GTEx.
Mutation analysis and co-expression networks
Somatic mutation data were processed using maftools in R. Mutation frequencies and their associations with expression were visualized and tested. Pearson correlation coefficients were calculated between LGR6 and key genes (e.g., PD-L1, RNA modification genes). A correlation coefficient > 0.5 was used to define strongly co-expressed genes.
Functional enrichment and stemness analysis
Genes strongly co-expressed with LGR6 were subjected to Gene ontology and Kyoto Encyclopedia of Genes and Genomes pathway enrichment analysis using the clusterProfiler R package[29]. The RNA stemness score (RNAss) was calculated based on transcriptome data, and its correlation with LGR6 expression was assessed across multiple cancer types.
Structural modeling and drug repurposing
The amino acid sequences of LGR6 (UniProt ID: Q9HBX8) and TP53 (UniProt ID: P04637) were used as inputs. The three-dimensional structures of LGR6 and TP53 were predicted using AlphaFold3[30]. AlphaFold3 was run with default parameters: number of recycles = 3, ensemble = 8, relaxation = yes. The predicted models with the highest predicted local distance difference test (pLDDT) scores were selected. Protein-protein docking was performed using Rosetta to identify potential interaction interfaces[31]. Meanwhile, we used Discovery Studio software to further identify potential ligand-binding pockets on the predicted LGR6 structure.
For docking, we used AlphaFold3’s multimer mode and Rosetta v3.13 with the following parameters: docking protocol = local_dock, interface score threshold = -1.0. The docking protocol consisted of global docking followed by local refinement. The Rosetta energy score and interface score were used as scoring functions, 1,000 poses were generated, and the final model was selected based on the lowest interface energy and highest cluster density. The lowest interface score decoy from the largest cluster was chosen as the final model. Interface residues were defined as those with any atom within 5 Å of the partner chain. Hydrogen bonds and pi-pi stacking were analyzed using Rosetta’s InterfaceAnalyzer.
Conserved domains in LGR6 were identified via Pfam (https://pfam.xfam.org) and NCBI CDD (https://www.ncbi.nlm.nih.gov/Structure/cdd). The LGR6 protein sequence was submitted to Pfam
The 3D structure of protein was shown by Pymol[32]. Structural similarity between LGR6 and LGR1, LGR2, LGR3 was quantified by calculating the root-mean-square deviation (RMSD) of Cα atoms after structural alignment. The predicted LGR6 structure was aligned to each of the LGR1-3 structures (obtained from the AlphaFold Protein Structure Database or predicted using AlphaFold3 as for LGR6) using PyMOL’s "align" command (Needleman-Wunsch algorithm). RMSD values (in Å) were reported; lower RMSD indicates higher structural similarity.
Statistical analysis
All statistical analyses were conducted in R 4.2.1 and Python 3.9, with two-sided P < 0.05 as significance threshold. Differential expression was analyzed using edgeR, DESeq2 on raw counts and limma on log2 (TPM + 0.1) data. Clinical correlations were assessed by Kruskal-Wallis and Mann-Whitney U tests. Survival analysis used Kaplan-Meier method and log-rank test. Pearson correlation was applied for gene co-expression and stemness index analysis. Methylation differences were tested by Mann-Whitney U test. For the initial screening of 830 GPCR genes, the Benjamini-Hochberg FDR was applied to correct for multiple testing. All subsequent analyses including survival, mutation, methylation, stemness, WNT pathway correlation, and pan-cancer comparisons were similarly FDR-corrected within each analysis domain. Statistical methods were annotated in figure legends accordingly.
In detail, the Mann-Whitney U test (also known as Wilcoxon rank-sum test) was used to compare gene expression levels between two independent groups (e.g., tumor vs. normal, or high vs. low expression groups). The test does not assume a normal distribution and ranks all observations from both groups together. The U statistic was calculated using the scipy.stats.mannwhitneyu function in Python (v3.9). A P-value < 0.05 was considered statistically significant.
RESULTS
Prognostic significance and clinical correlations of GPCR genes
Based on the TCGA database, we downloaded and obtained the transcriptome data for prostate cancer. Principal component analysis (PCA) of the log2-transformed transcriptomic data revealed a clear separation between the disease group and the control group along the PC1 and PC2 dimensions, indicating global transcriptomic differences between prostate cancer tissues and normal tissues [Figure 1A]. Using the mRNA expression matrix, we performed differential expression analysis with edgeR, DESeq2, and limma (log2 (TPM + 0.1)), respectively (screening thresholds: |log2(Fold Change)| > 1.5 and FDR < 0.05). A substantial number of DEGs were identified, with a considerable amount of both up-regulated and down-regulated genes [Figure 1B and C]. These three differential expression algorithms identified 688, 705, and 1,009 DEGs, respectively. By taking the intersection of the three DEG sets, we obtained 352 common DEGs, comprising 138 up-regulated [Figure 1D] and 214 down-regulated genes [Figure 1E]. Subsequently, a further intersection with the GPCR gene set (containing 830 genes) was performed, ultimately screening 19 significantly differentially expressed GPCR genes. These 19 genes are LGR6, CXCR2, NPFFR2, ADRA1A, GPR149, HCAR3, ADGRD2, HTR1E, ADRB3, OR51A7, OR51T1, OR51G2, OR52I1, KISS1R, OR51S1, OR2B6, OR52R1, F2RL2, and OR51E2.
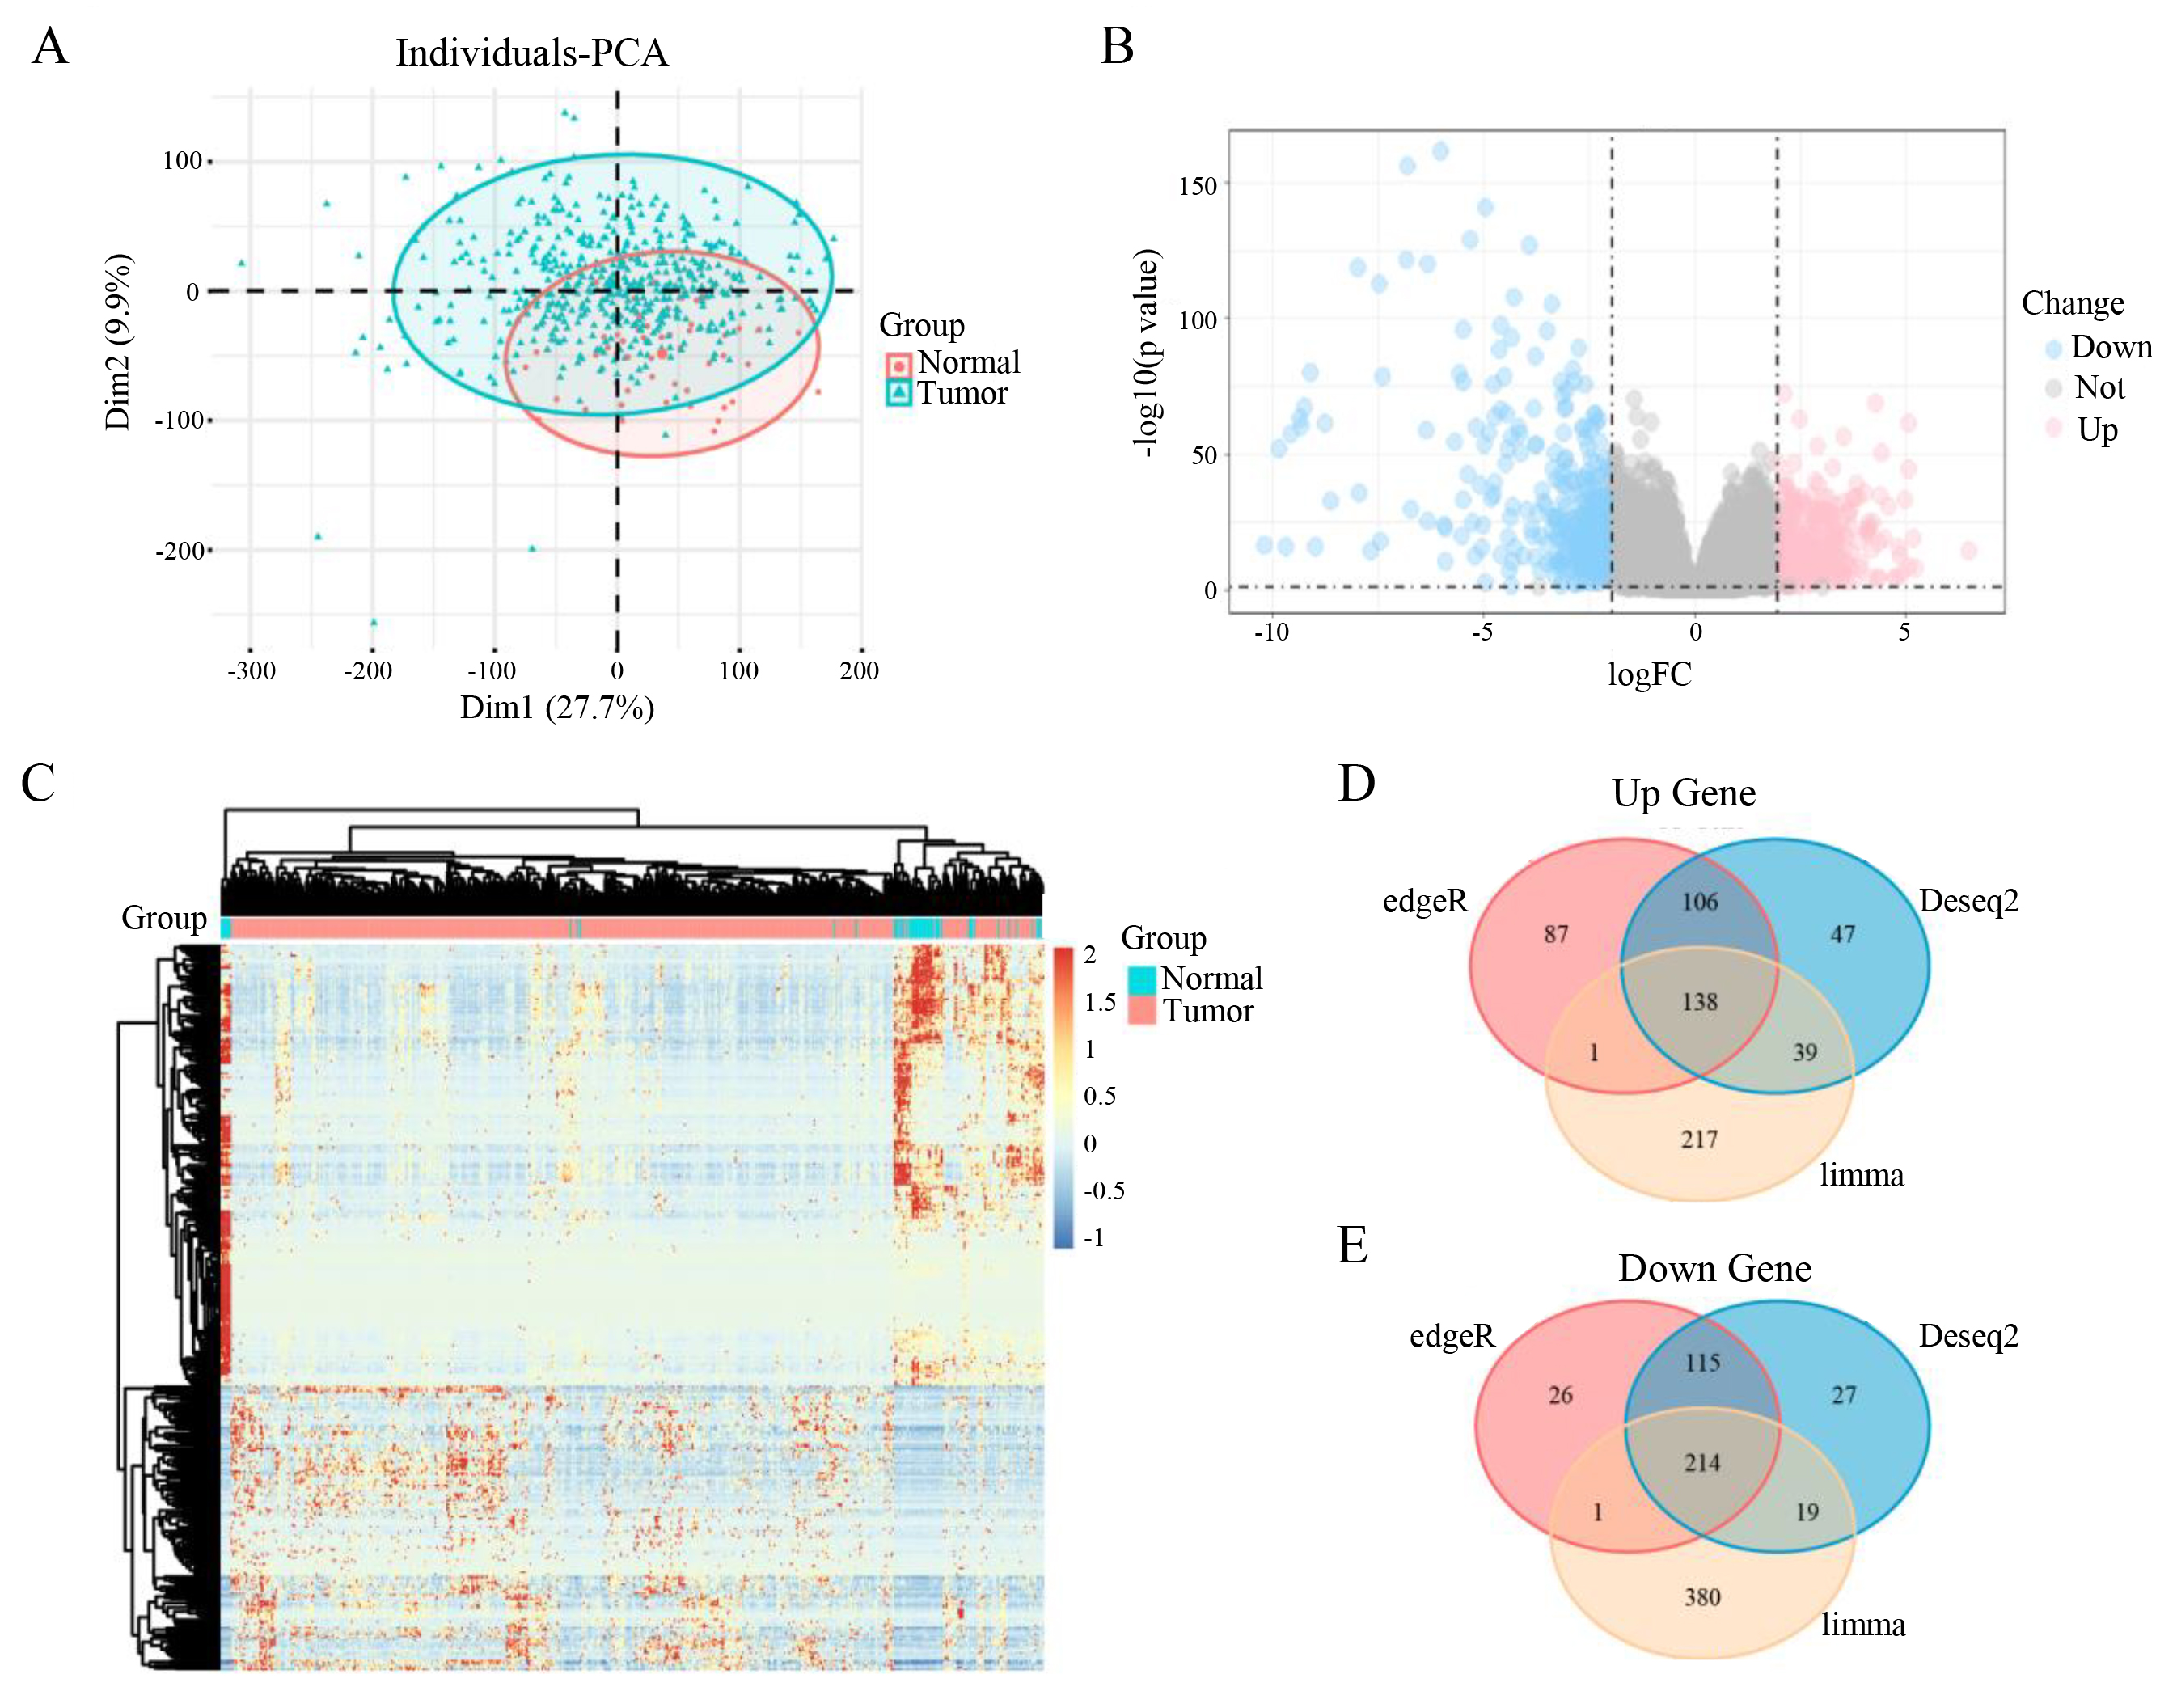
Figure 1. Identification and validation of differentially expressed genes in prostate cancer. (A) PCA plot showing tumor samples in blue and normal samples in red. (B) Volcano plot of differentially expressed genes, with down-regulated genes in blue and up-regulated genes in red. (C) Heatmap of differentially expressed genes, where red indicates up-regulation and blue indicates down-regulation. (D and E) Venn diagrams display the number of up-regulated (D) and down-regulated (E) genes identified by the three methods, with 352 common differentially expressed genes in total.
Survival prognosis analysis of the aforementioned 19 differentially expressed GPCR genes identified 7 GPCR genes significantly associated with the disease free survival of prostate cancer patients (log-rank P < 0.05) [Figure 2A and B]. Integrated with the differential expression results, OR51E2 was found to be the most significantly up-regulated gene in tumor tissues (log2FC = 2.93, P = 1.14 × 10⁻¹⁶) [Figure 2B], while LGR6 showed the most pronounced down-regulation (log2FC = -2.69, P = 1.95 × 10-46) [Figure 2C]. Survival correlation analysis revealed that although OR51E2 was up-regulated in the disease group, patients with low expression of this gene did not show a significant survival advantage, and the P-value of 0.037 indicated a marginally significant association with prognosis [Figure 2B]. In contrast, the prognostic significance of LGR6 was consistent with its down-regulated expression pattern, with a significant P-value of 0.0058.
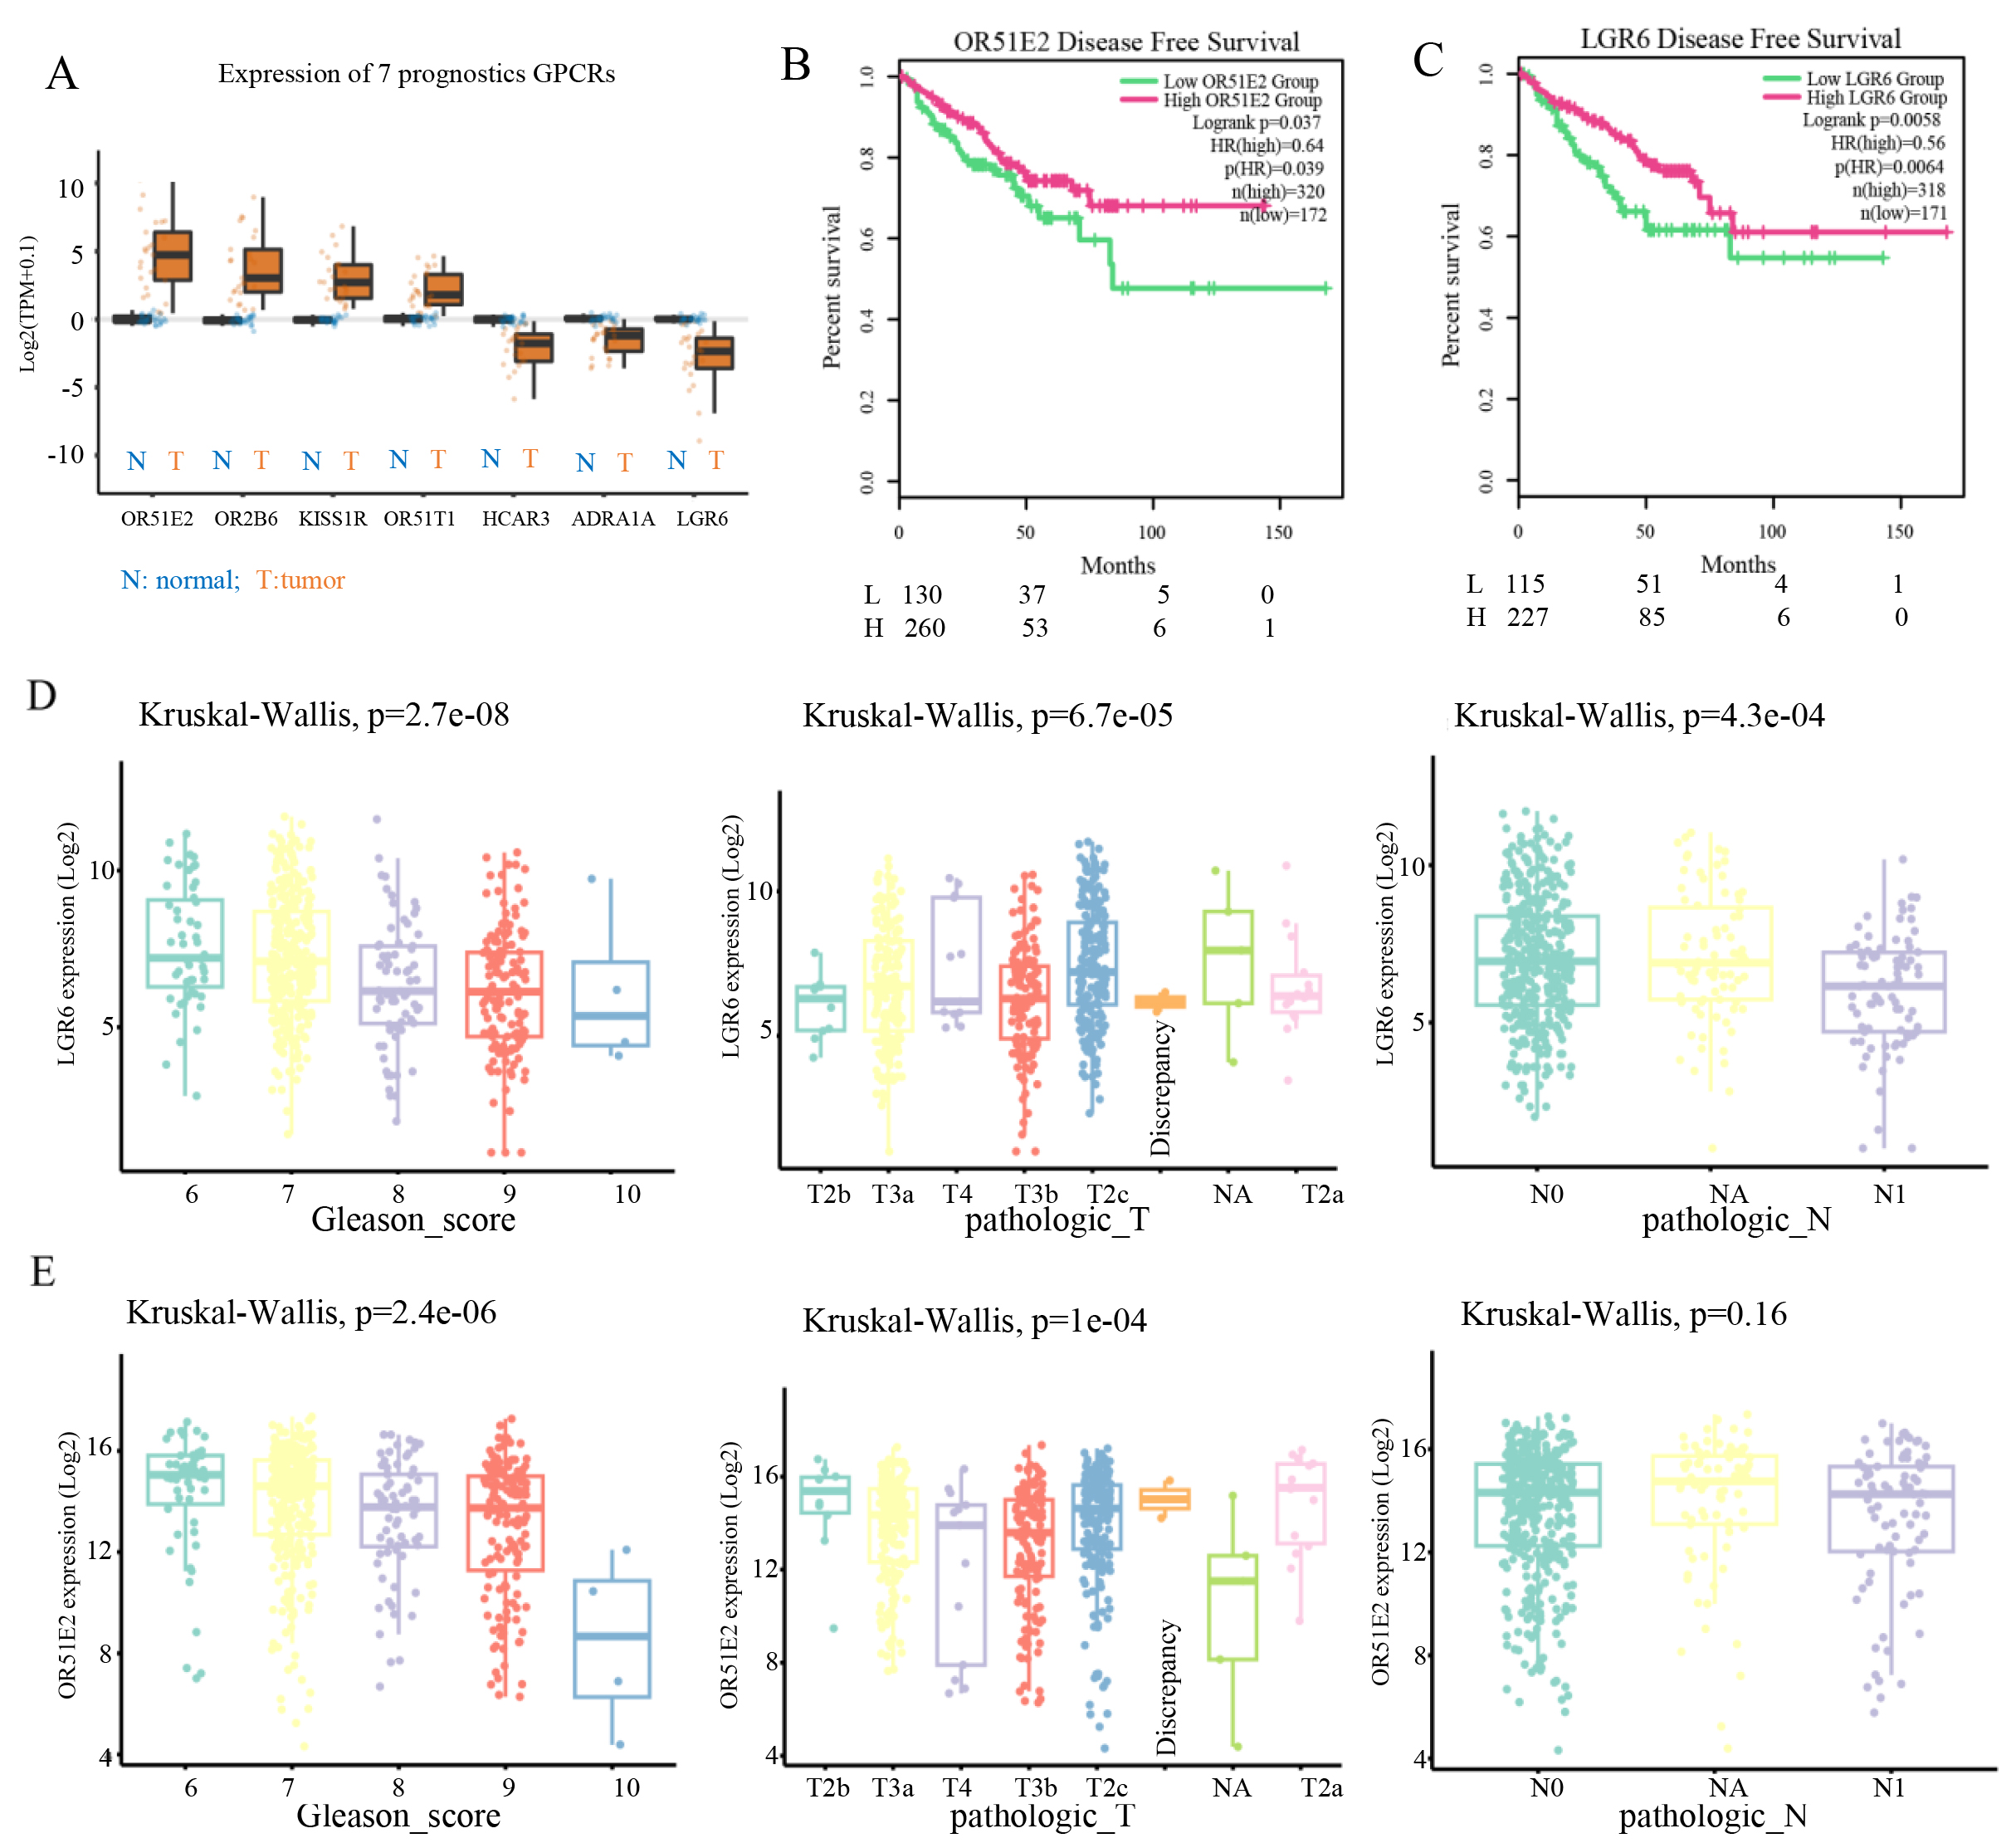
Figure 2. Survival and clinical correlation analysis of prognosis-associated GPCR genes. (A) Box plots showing differential expression of the 7 prognosis-associated genes, with blue and orange boxes indicating normal and case groups, respectively. (B) Disease-free survival (DFS) analysis of OR51E2, with green and red curves representing low and high expression groups, respectively. (C) DFS analysis of LGR6. (D and E) Clinical correlation analyses of LGR6 (D) and OR51E2 (E), including associations with Gleason score, T stage, and N stage.
Clinical correlation analysis demonstrated that LGR6 expression levels were significantly associated with Gleason score (P = 2.4 × 10⁻⁶), T stage (Kruskal-Wallis P = 1 × 10⁻⁴), and N stage (P = 4.3 × 10⁻⁴) [Figure 2D]. For OR51E2, its expression was significantly correlated with Gleason score (P = 2.4 × 10⁻⁶) and T stage (Kruskal-Wallis P = 1 × 10⁻⁴), but not with N stage (P = 0.16) [Figure 2E]. These figures show differences in LGR6 expression across Gleason score groups, suggesting a potential link between LGR6 and tumor aggressiveness. The trend of changing LGR6 expression with advancing T stage may reflect its role in tumor progression. N stage indicates lymph node metastasis status (N0: no metastasis; N1: metastasis present). The differential expression of LGR6 in the N1 subgroup may imply its involvement in metastatic regulation. These results suggested that LGR6 is a potential biomarker for prostate cancer.
To further evaluate whether LGR6 is an independent prognostic factor, we performed multivariable Cox regression adjusting for age, Gleason score, T stage, and N stage. LGR6 high expression remained significantly associated with favorable disease-free survival (HR = 0.54, 95%CI: 0.34-0.87), indicating that LGR6 is an independent prognostic biomarker in PRAD [Supplementary Table 1]. Subgroup analysis further confirmed the consistency of LGR6 prognostic value across different clinical strata [Supplementary Table 2]. Meanwhile, analysis of an independent dataset (GDS2546) revealed an LGR6 expression pattern in healthy adjacent prostate tissue and primary prostate tumor that was consistent with the TCGA-PRAD data [Supplementary Table 3, Supplementary Figure 1]. However, the function of LGR6 in prostate cancer remains unclear and warrants further investigation.
Promoter methylation mediates the downregulation of LGR6 in prostate cancer
To further clarify the expression of LGR6 in prostate cancer, we downloaded data from the HPA database (https://www.proteinatlas.org) to determine the protein expression and transcriptional levels of LGR6 in normal prostate tissues and cancerous tissues. Subsequently, we found that LGR6 exhibits a relatively high expression level in the prostate (Staining: Medium) [Figure 3A]. The mRNA expression level in normal prostate tissues was approximately 6 nTPM (sample 59: 8.6; sample 207: 6) [Figure 3B]. However, in prostate cancer tissues, the level of LGR6 staining was low (Staining: weak) [Figure 3C, Supplementary Figure 2]. These results demonstrate that LGR6 expression, both at the protein and transcriptional levels, is higher in normal prostate tissues than in cancerous tissues.
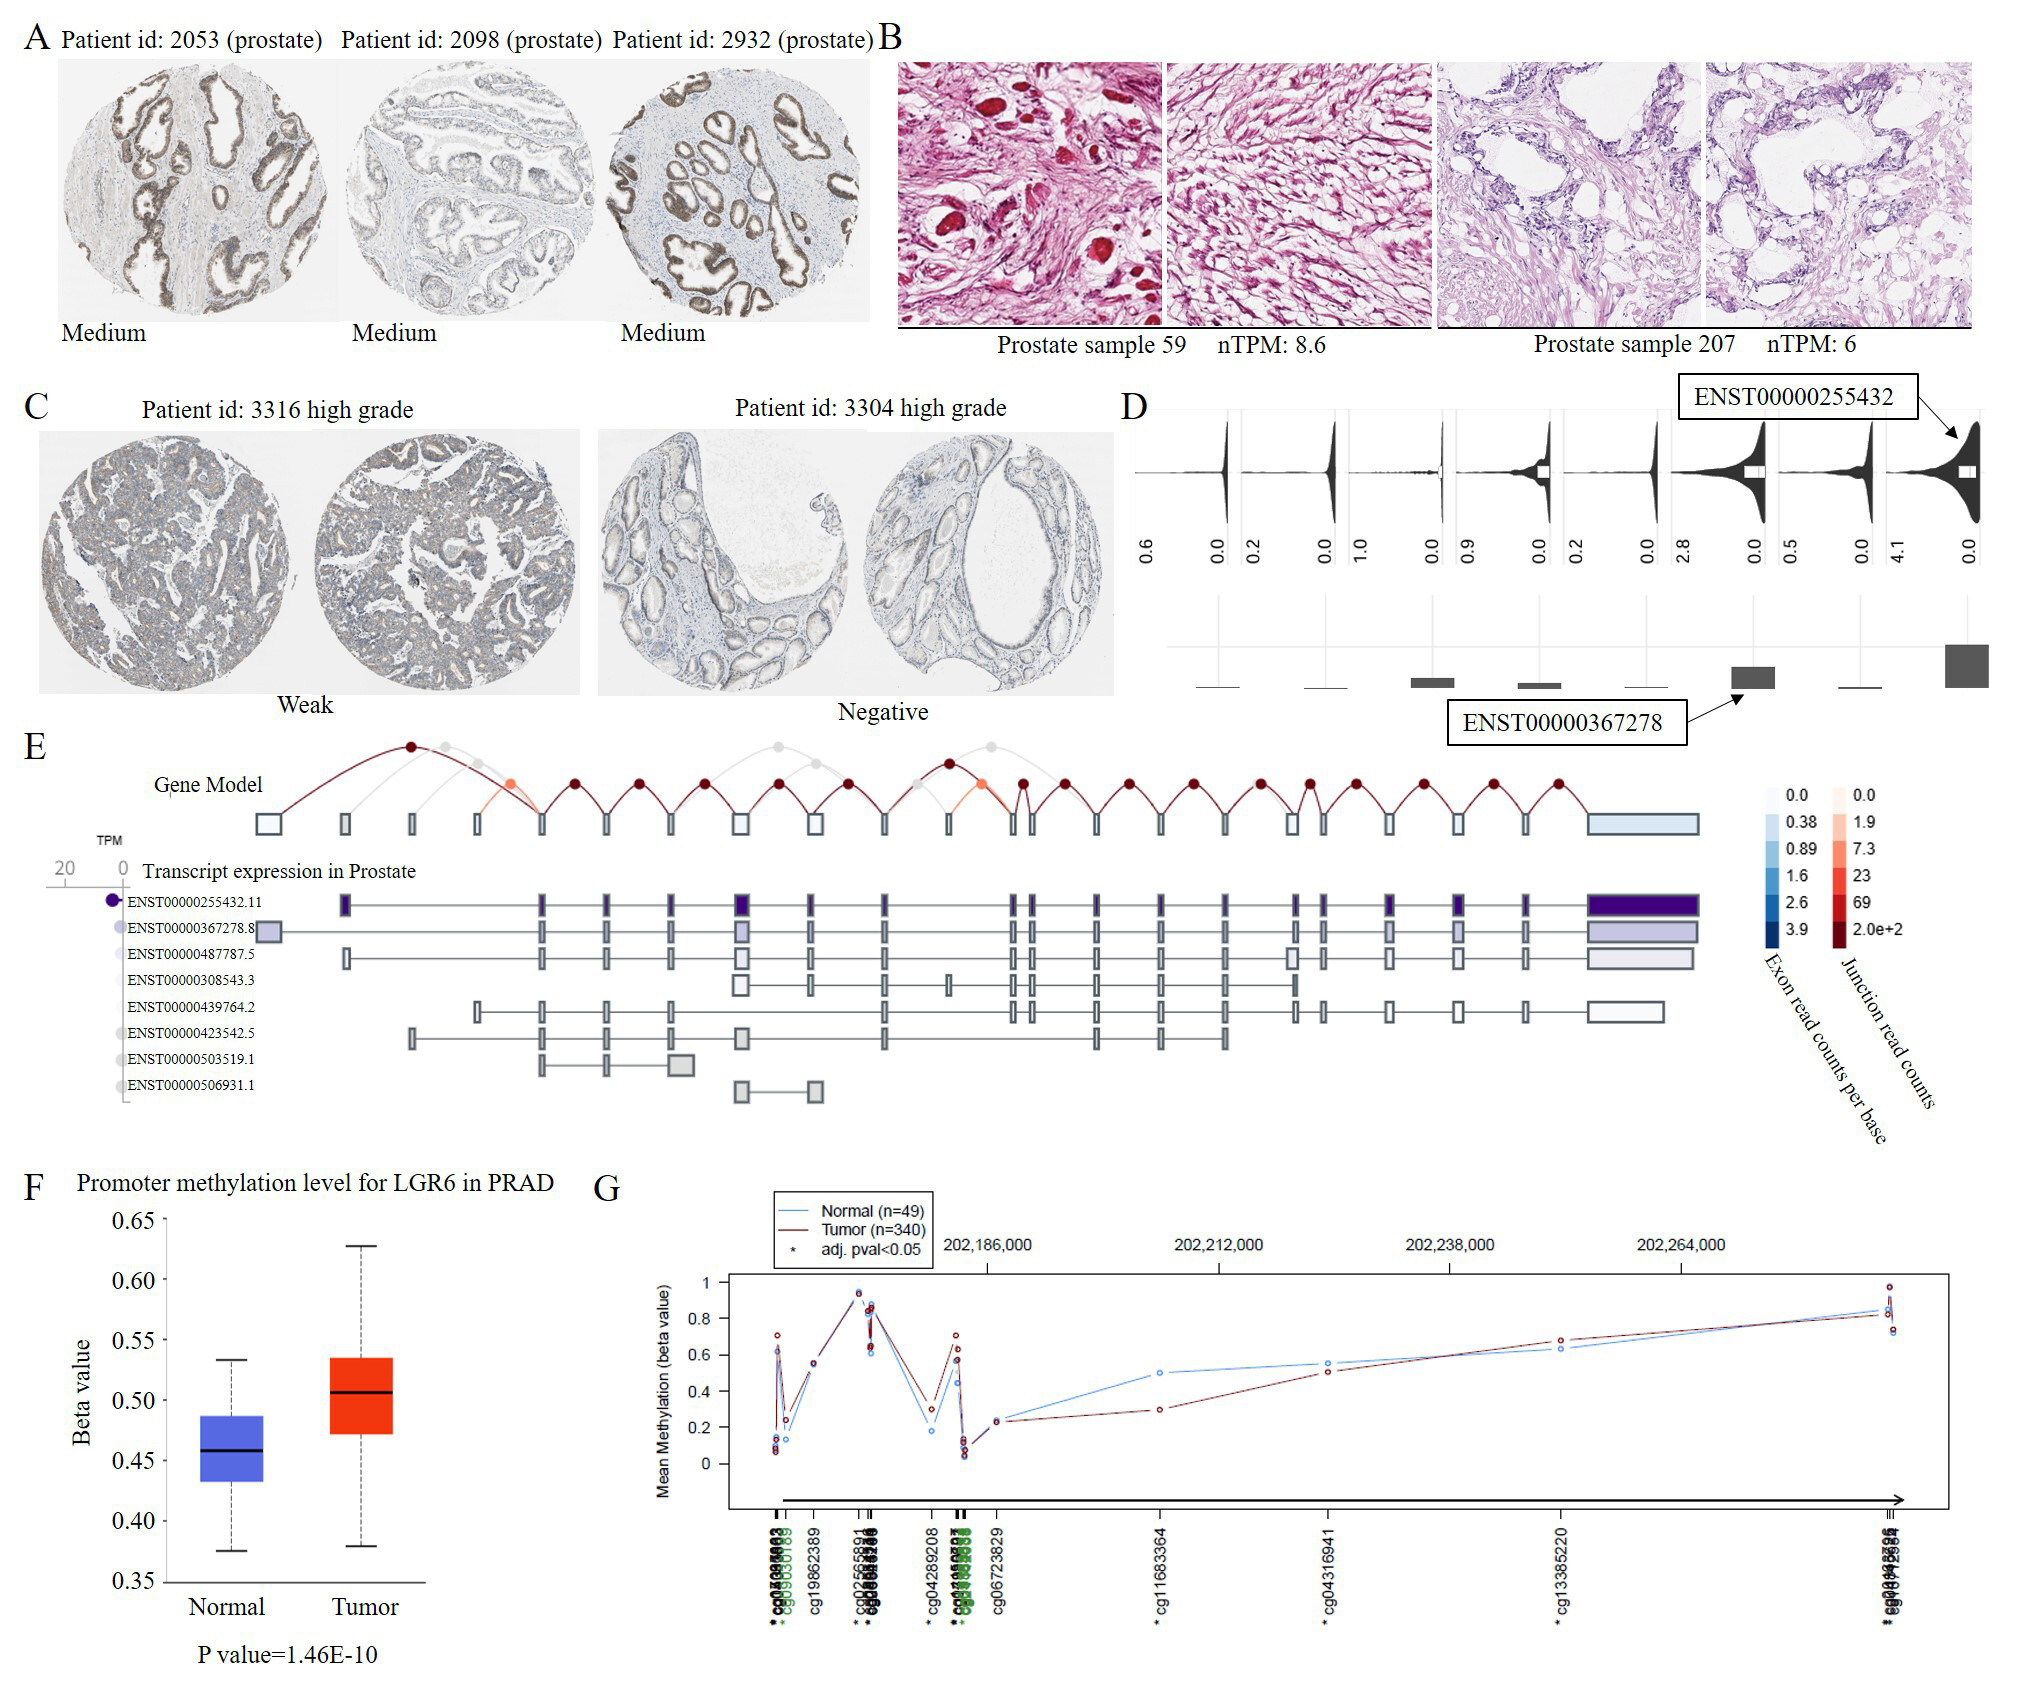
Figure 3. LGR6 is downregulated in prostate cancer associated with promoter hypermethylation. (A) Medium LGR6 protein staining in normal prostate tissue. (B) LGR6 mRNA expression (nTPM) in normal prostate tissues. (C) Weak LGR6 protein staining in prostate cancer tissue. (D) Predominant LGR6 isoforms in TCGA prostate cancer data. (E) Predominant LGR6 isoforms in normal prostate tissue (GTEx). (F) Promoter hypermethylation of LGR6 in prostate cancer (TCGA). (G) Differentially methylated regions between cancer and adjacent tissues. Immunohistochemistry images (A-C) were obtained from the human protein atlas (HPA) at 20× magnification, corresponding to a scale bar of 50 μm. This figure was generated by the authors based on publicly available data from TCGA, GEO and HPA; no additional patient samples were used.
To investigate the impact of alternative splicing on LGR6, we analyzed prostate cancer data from TCGA and found that ENST00000255432 and ENST00000367278 are the predominant isoforms of LGR6 [Figure 3D]. According to GTEx (genotype-tissue expression) data, these two isoforms are also dominant in normal prostate tissues [Figure 3E]. This indicates that alternative splicing is not the reason for the altered expression of LGR6 in prostate cancer. Subsequently, we analyzed methylation data from prostate cancer (TCGA-PRAD) and discovered that the methylation level in the promoter region of LGR6 is significantly higher in prostate cancer tissues than in normal tissues (P value = 1.46 × 10⁻¹⁰) [Figure 3F]. Meanwhile, the difference in methylation levels is primarily distributed in the promoter region [Figure 3G]. Therefore, we hypothesize that a significant reason for the low expression of LGR6 in prostate cancer is the hypermethylation of the gene's promoter region.
LGR6 potential functions in PRAD
To further investigate the function of LGR6 in prostate cancer, we analyzed the association between LGR6 mutations and its expression, as well as the correlation between LGR6 expression and gene mutations. Subsequently, we found that mutations in LGR6 do not affect its expression level [Figure 4A], and its mutation rate is relatively low in TCGA-PRAD patients, with a mutation rate of only 0.4% [Figure 4B]. Further analysis revealed significant differences in the mutation rates of 13 genes between the high and low LGR6 expression groups, namely FOXA1, SPOP, LRP1B, PIK3CA, APC, CDH12, XIRP1, ZAN, SCN5A, TRPM6, SSPO, NEB, and UBR4
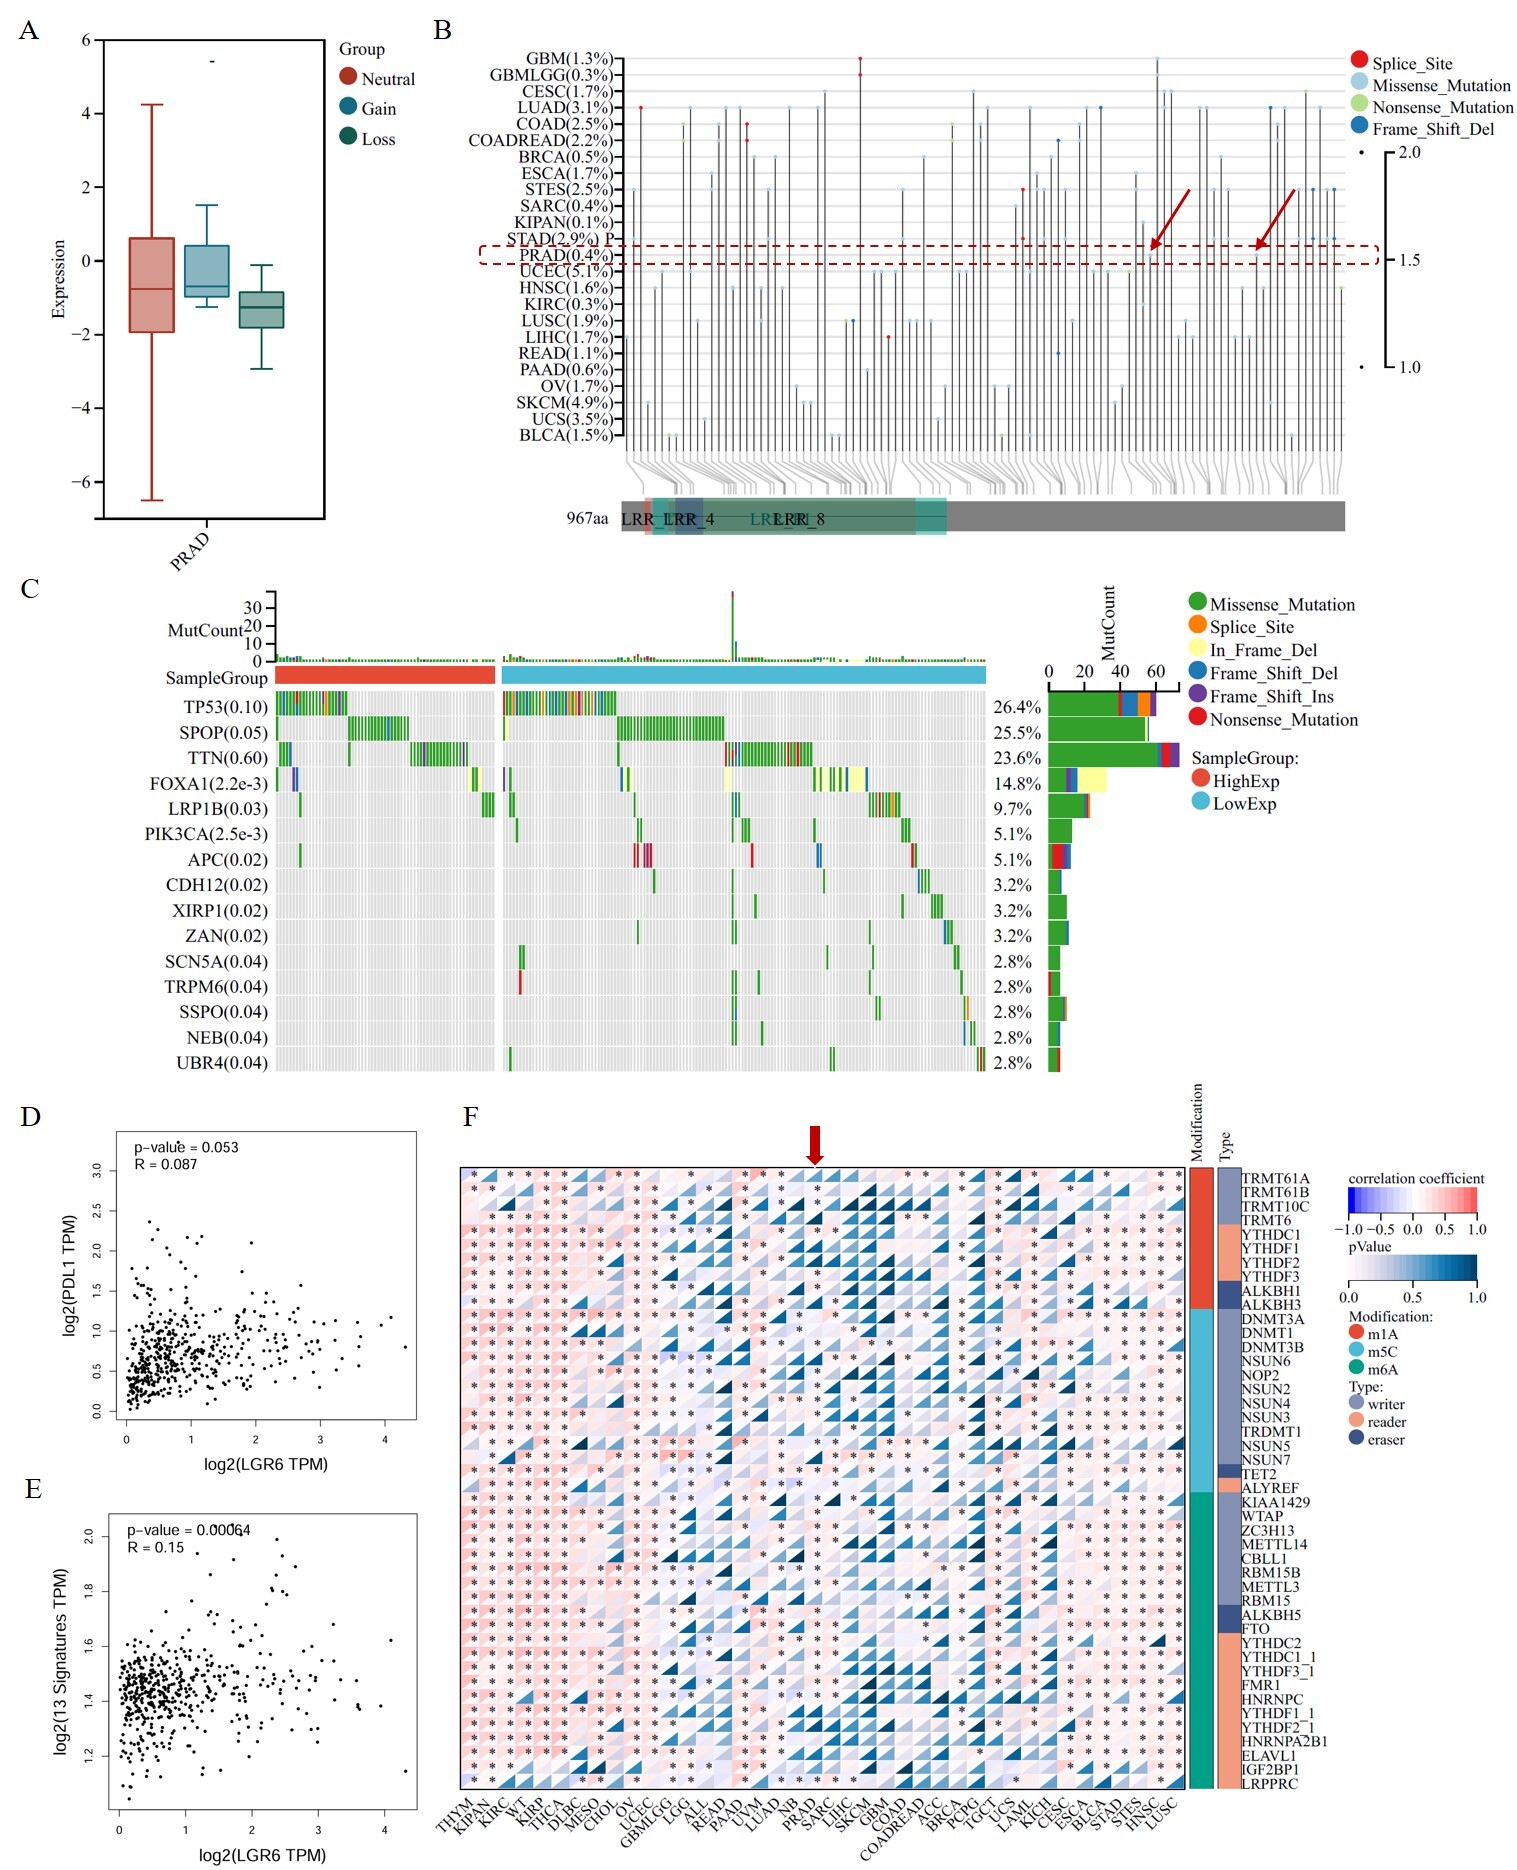
Figure 4. Mutational landscape and co-expression network of LGR6 in prostate cancer. (A) LGR6 expression is independent of its mutation status. (B) Low mutation rate of LGR6 in TCGA-PRAD cohort. (C) Differential mutation burden of 13 genes between LGR6 high/low groups. (D) Weak correlation between LGR6 and PD-L1 expression (Pearson’s correlation test). (E) Positive correlation between LGR6 and the 13-gene signature (Pearson’s correlation test). (F) Pan-cancer correlation of LGR6 with RNA modification genes, strongest in PRAD.
To further investigate the potential functions of LGR6, we downloaded the datasets GSE150692 and GSE141445 from the GEO database. Subsequently, correlation analysis revealed 105 genes with a correlation coefficient greater than 0.5 with LGR6; all had P < 0.05. Among these, 102 genes showed a positive correlation, while three exhibited a negative correlation. Functional enrichment analysis of these genes indicated that the cancer-related signaling pathway most significantly enriched was the WNT signaling pathway [Figure 5A]. Meanwhile, we calculated the correlation between the pan-cancer stemness index RNAss and LGR6 expression and found that LGR6 exhibited the most significant correlation in PRAD [Figure 5B]. Additionally, we performed correlation analysis on six gene sets related to the WNT signaling pathway, namely: genes related to the WNT signaling pathway, regulatory factors controlling the initiation and inhibition of the WNT signaling pathway, receptors of the WNT signaling pathway, regulators of the WNT signaling pathway, kinases and phosphatases involved in the regulation of the WNT signaling pathway, and other genes playing roles in cell proliferation, differentiation, and apoptosis. The results demonstrated that LGR6 showed significant correlations with these genes in PRAD
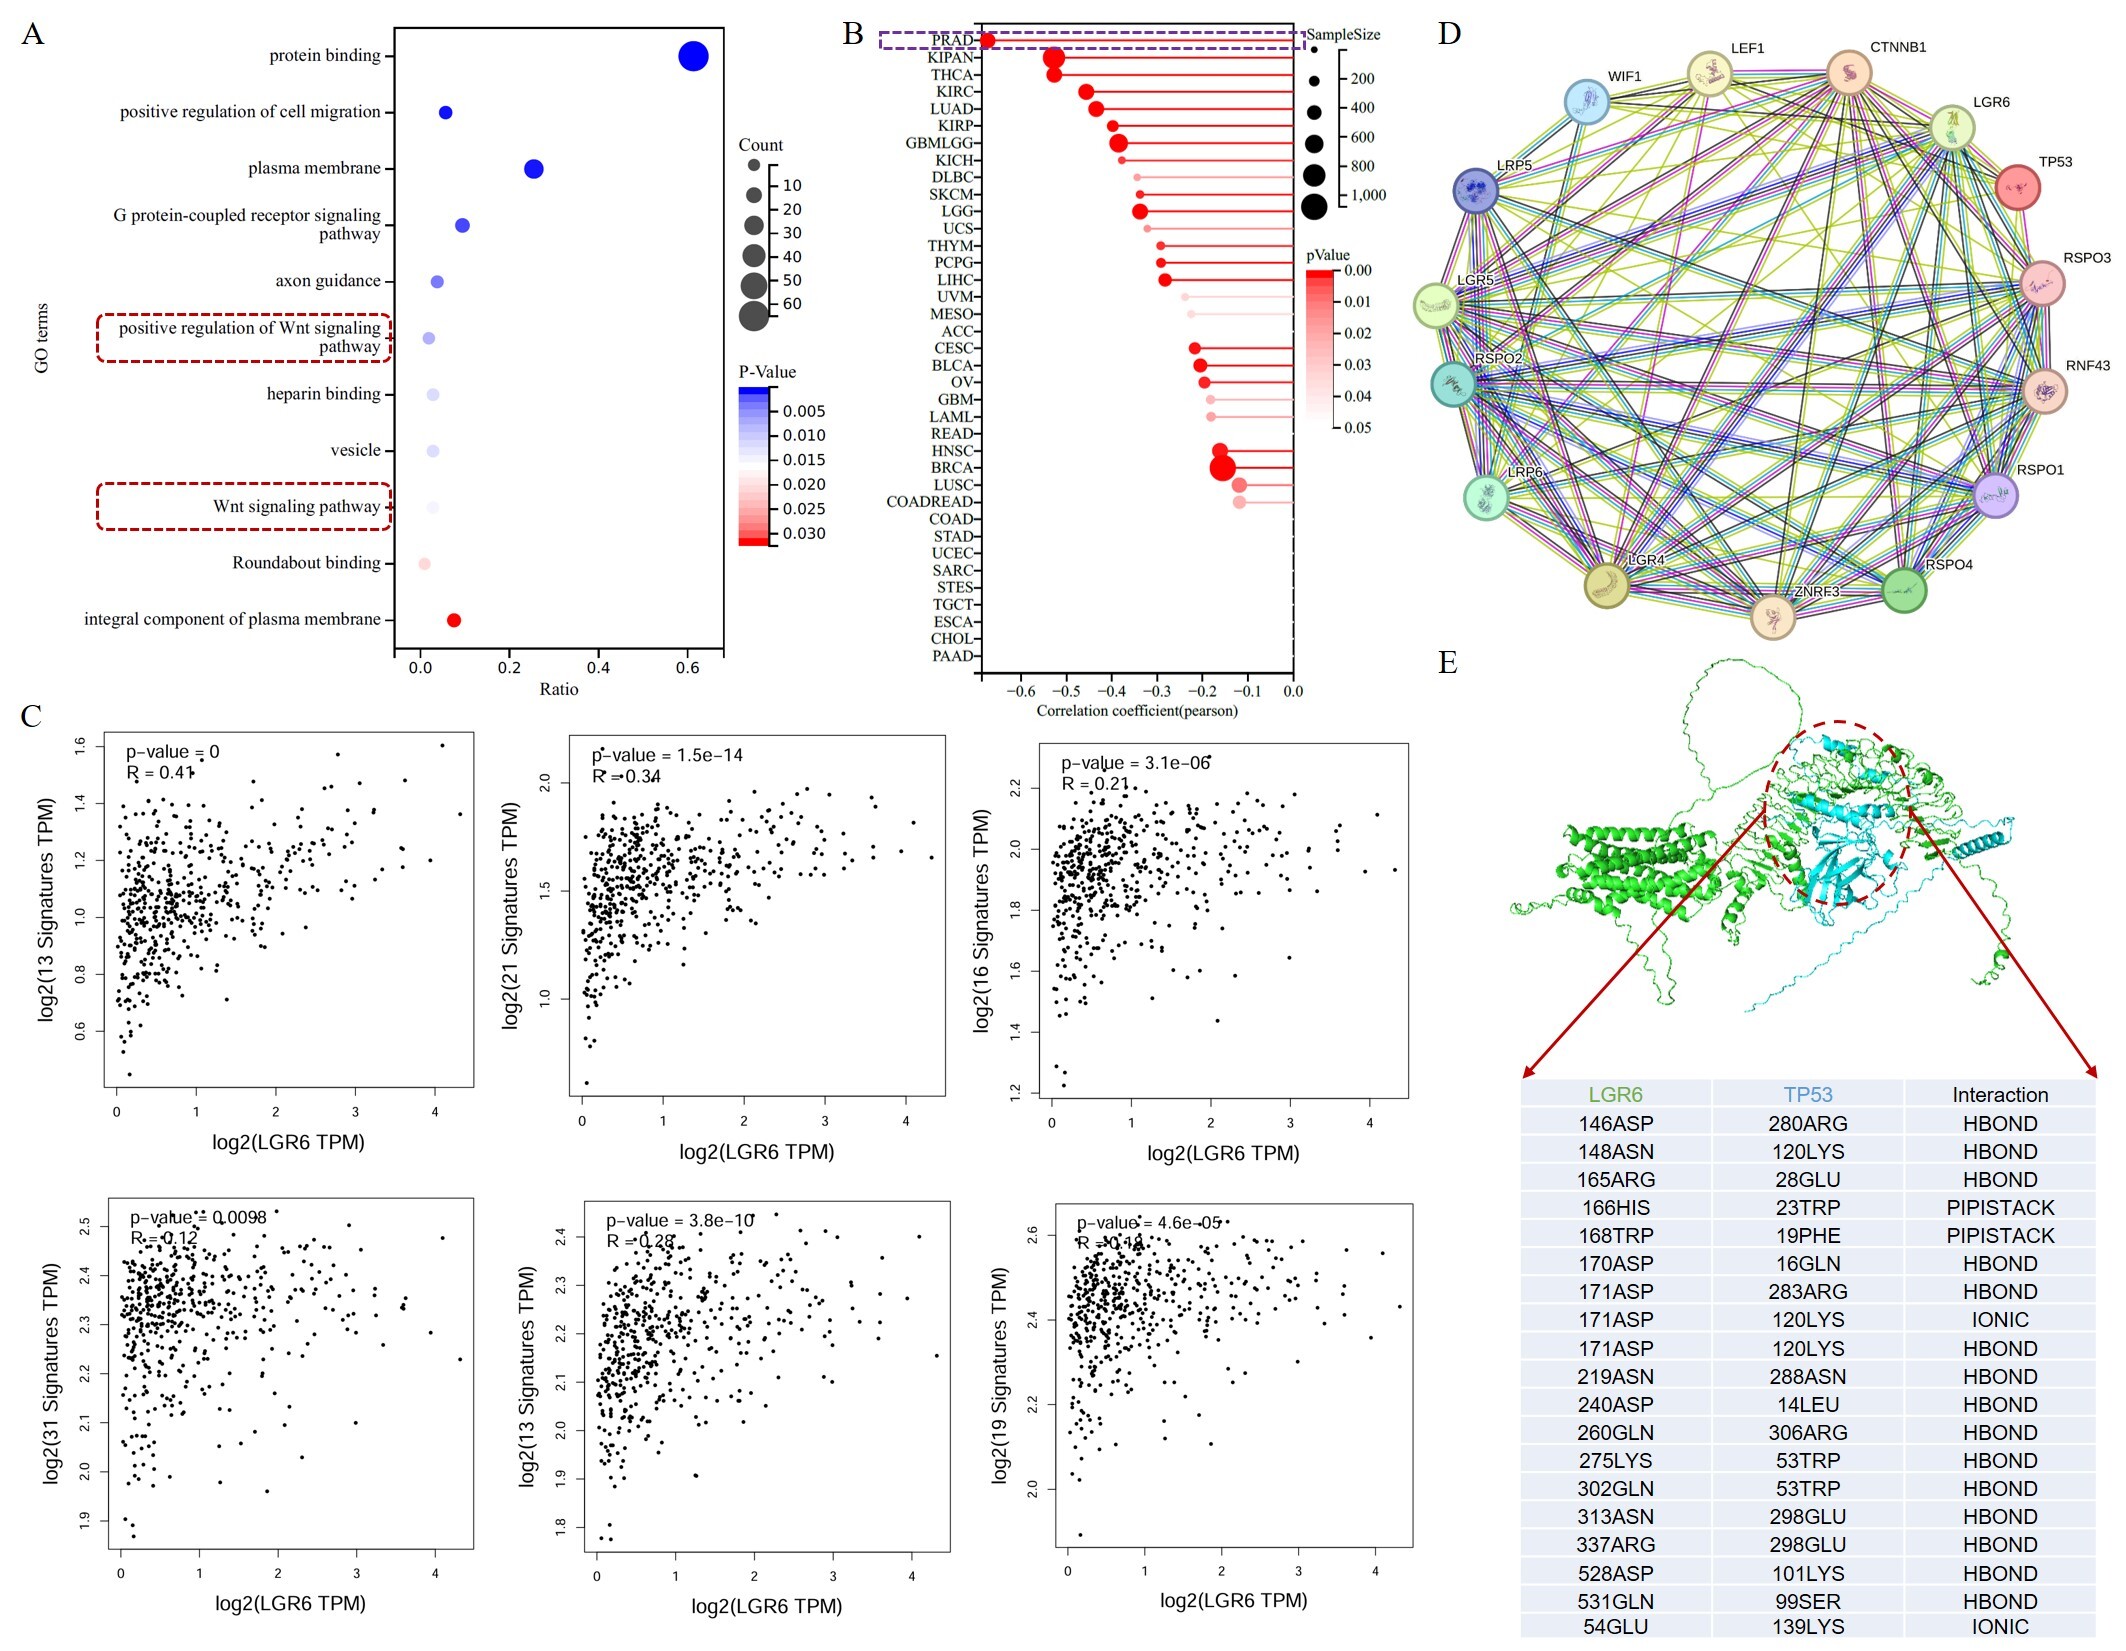
Figure 5. Computational prediction of LGR6 association with the WNT pathway and TP53 in prostate cancer. (A) Functional enrichment analysis of LGR6 co-expressed genes in the WNT signaling pathway. (B) Correlation analysis between LGR6 expression and the pan-cancer stemness index (RNAss) across various cancer types. (C) Correlation analysis between LGR6 expression and WNT signal pathway-related gene sets (Pearson’s correlation test). (D) Regulatory network of LGR6 and key oncogenes (e.g., TP53). (E) Predicted three-dimensional structure and interaction model between LGR6 and TP53 proteins.
Furthermore, we investigated the regulatory network of LGR6 and its significantly correlated genes, revealing that LGR6 has predicted regulatory relationships with multiple oncogenes, such as TP53 [Figure 5D]. TP53 may regulate the expression of LGR6 by binding to its promoter region. Meanwhile, we first used AlphaFold3 to predict the three-dimensional structures of LGR6 and TP53, followed by computational docking analysis using both AlphaFold3 and Rosetta software. The results suggest that TP53 and LGR6 may potentially interact, with relatively diverse interaction sites (the primary interaction region of LGR6 is 140-280, while that of TP53 is 10-180), primarily mediated by hydrogen bonds and pi-pi stacking [Figure 5E]. These findings suggest that LGR6 may be associated with TP53, although a physical interaction has not been experimentally validated. These computational predictions suggest a potential interaction, which requires experimental validation (e.g., co-IP or pull-down assays).
Potential drugs targeting LGR6
Currently, there are no commercially available targeted drugs for LGR6. Since no targeted drugs against LGR6 have been approved or developed by the FDA, our study focused on drug repurposing for LGR6-targeted therapy. To explore potential therapeutic agents, we investigated evolutionary relationships and structural pharmacology. Through sequence alignment, we identified several conserved domains in LGR6, including PLN00113, LRR, PPP1R42, and LRR_8 [Figure 6A]. Based on these domains, we searched drug databases such as the FDA and DrugBank and identified homologous targeted drugs. Specifically, drugs associated with the LRR domain included Dapansutrile and Selnoflast, while drugs matching the PPP1R71 domain included Selnoflast, Defactinib, and Lorlatinib [Figure 6B].
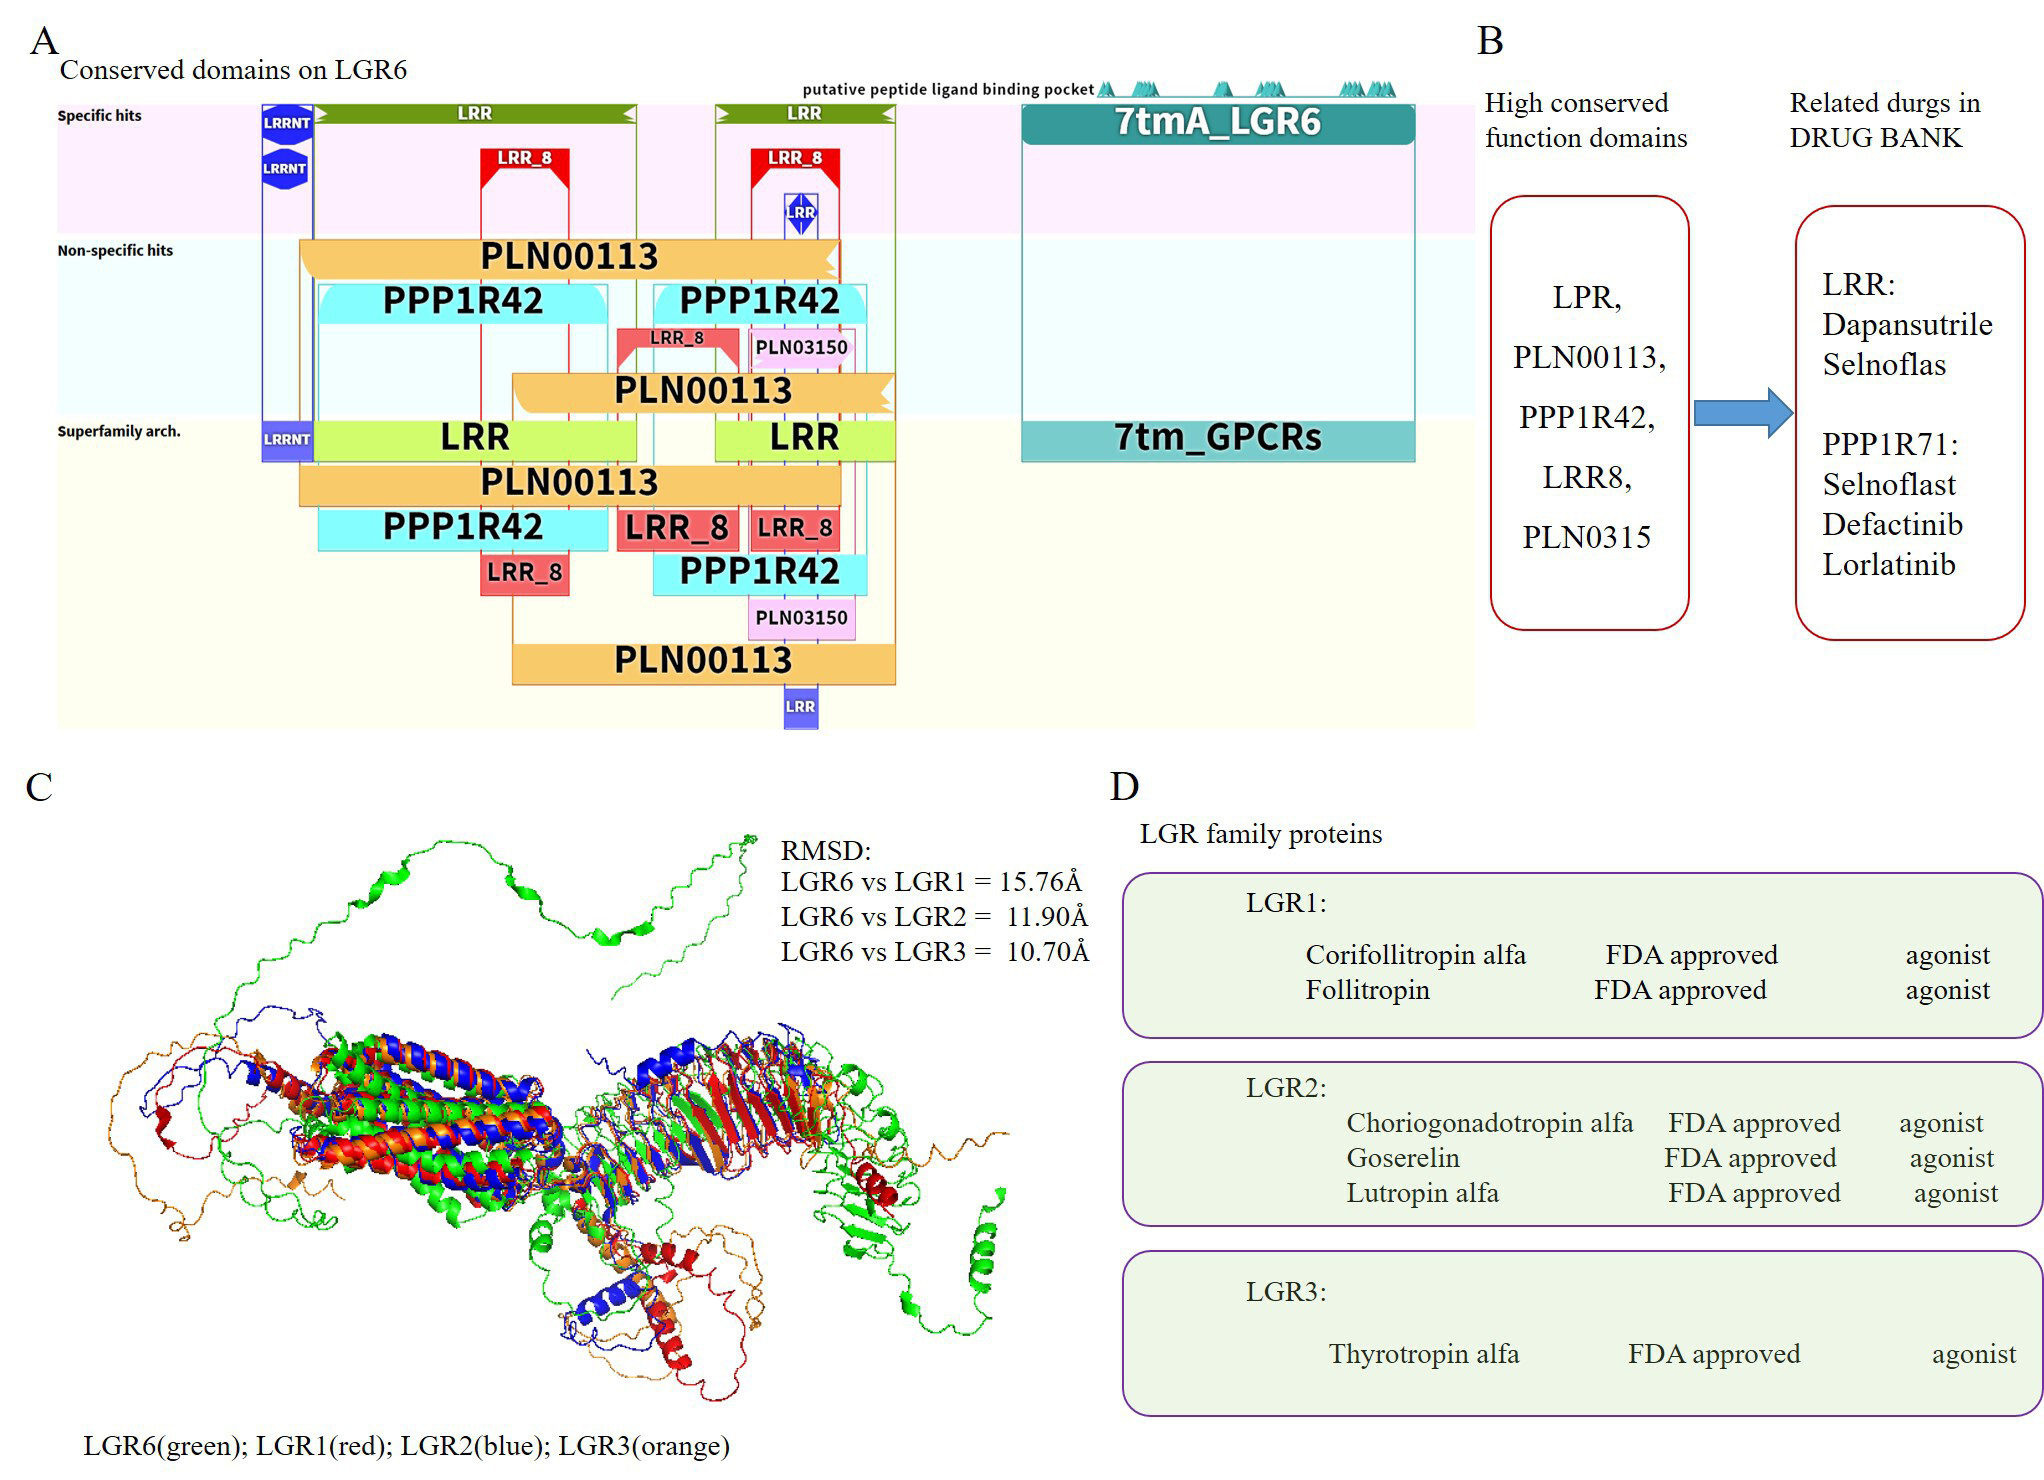
Figure 6. Potential LGR6 agonists from existing drugs. (A) Conserved domains identified in the LGR6 sequence. (B) Potential drugs targeting LGR6 based on conserved domain homology. (C) Structural similarity between LGR6 and related LGR family members (LGR1-3). (D) Potential LGR6 agonists identified from known agonists of LGR1, LGR2, and LGR3.
Simultaneously, we observed that LGR6 shares significant structural similarity with LGR1, LGR2, and LGR3 in the LGR family. The RMSD values from structural alignment fell within 15 Å, indicating a high degree of structural conservation among LGR family members [Figure 6C] As LGR6 exhibits high structural similarity with LGR1-3 in the LGR family, we can infer the putative active site and druggable pocket of LGR6 based on the conserved domains and known ligand-binding regions of LGR1-3. This suggests that targeted drugs developed for LGR1-3 might potentially bind with LGR6. Further investigation revealed that agonists for LGR1 include Corifollitropin alfa and Follitropin; agonists for LGR2 include Choriogonadotropin alfa, Goserelin, and Lutropin alfa; and an agonist for LGR3 is Thyrotropin alfa. These agonists are speculative candidates requiring experimental validation for targeting LGR6 [Figure 6D]. These findings suggest that LGR6 may have multiple potential agonists that could be explored for the treatment of prostate cancer.
DISCUSSION
This study systematically investigates the expression pattern, regulatory mechanism, biological function and clinical significance of LGR6 in prostate cancer via comprehensive in silico analysis, suggesting LGR6 as a putative tumor suppressor, a potential prognostic biomarker, and a hypothetical therapeutic target requiring experimental validation. Consistent with our screening results, LGR6 is identified as the most significantly downregulated GPCR in prostate cancer, and its low expression is tightly associated with adverse clinicopathological features including high Gleason score, advanced T stage and lymph node metastasis, as well as inferior disease-free survival. These findings align with the emerging role of LGR family receptors in tumor suppression and stem cell homeostasis[33,34], and extend the understanding of GPCR dysregulation in prostate cancer progression.
Mechanistically, we demonstrate that the silencing of LGR6 in prostate cancer is predominantly driven by promoter hypermethylation rather than alternative splicing or somatic mutations, which represents a typical epigenetic inactivation pattern of tumor suppressor genes. The low mutation frequency of LGR6 itself further supports that epigenetic dysregulation is the primary cause of its abnormal expression. Functionally, LGR6 is closely linked to the WNT signaling pathway and cancer stemness[35,36], and computational analysis predicted a potential association with the tumor suppressor TP53, suggesting a hypothetical mechanism by which LGR6 might influence prostate cancer progression through WNT-related stemness traits and TP53 pathway activity. However, these predictions remain speculative and require experimental validation. These results provide a preliminary interpretive framework for interpreting the tumor-suppressive role of LGR6 and bridge the gap between LGR6 dysregulation and core oncogenic pathways in prostate cancer.
In terms of translational potential, the conserved structural domains and high similarity with LGR1-3 suggest that existing FDA-approved agonists might serve as candidate starting points for LGR6-targeted drug discovery. However, this hypothesis requires extensive experimental validation including binding assays and functional studies before any clinical application can be considered.
Nevertheless, this study has several limitations. All conclusions are derived from public multi-omics data and computational predictions, which lack experimental validation using clinical specimens, cell lines, or animal models. The precise molecular mechanisms underlying the LGR6-WNT-TP53 axis and the actual efficacy of candidate agonists remain to be verified by in vitro and in vivo functional assays. Future studies should focus on experimental validation of LGR6 expression and function, exploration of its upstream epigenetic regulators and downstream effectors, and preclinical evaluation of LGR6 agonists as novel therapeutic agents for castration-resistant prostate cancer.
Collectively, our findings highlight that epigenetically silenced LGR6 acts as a tumor suppressor in prostate cancer by regulating WNT signaling and the TP53 network, and holds great promise as a prognostic biomarker and therapeutic target. This study provides novel insights into the molecular pathogenesis of prostate cancer and offers a rational basis for the development of targeted strategies against advanced disease.
In conclusion, our integrative in silico analysis demonstrates that LGR6 acts as a tumor suppressor in prostate cancer (PRAD). LGR6 is significantly downregulated in PRAD due to promoter hypermethylation, and its low expression correlates with advanced clinicopathological features and poor relapse-free survival. Mechanistically, LGR6 is closely associated with the WNT signaling pathway, cancer stemness, and shows a predicted association with the tumor suppressor TP53. Notably, no FDA-approved drugs target LGR6; based on structural conservation and similarity to LGR1-3, we identified several existing agonists as candidate compounds warranting experimental validation. Collectively, LGR6 serves as a potential prognostic biomarker and a putative therapeutic target for precision therapy of advanced prostate cancer.
DECLARATIONS
Authors’ contributions
Conceived, designed, and supervised the study: Li J, Yao L, Huang X
Performed the experiments and wrote the original draft of the manuscript: Zhu X, Zhou H, Shu C
Collected the data and interpreted the results: Huang X, Zhou H, Shu C
Availability of data and materials
The original data used to support the findings of this study are available from the corresponding author upon reasonable request by E-mail.
AI and AI-assisted tools statement
Not applicable.
Financial support and sponsorship
This work was supported by the Natural Science Foundation of Jiangsu Province (No. BK20220313) and the Natural Science Research Project of Colleges and Universities in Jiangsu Province (No. 22KJB180004).
Conflicts of interest
All authors declared that there are no conflicts of interest.
Ethical approval and consent to participate
This study used only publicly available de-identified data and did not require additional ethical approval.
Consent for publication
Not applicable.
Copyright
© The Author(s) 2026.
Supplementary Materials
REFERENCES
1. Sasaki K, Bhatia V, Asano Y, et al. Collagen-binding IL-12-armoured STEAP1 CAR-T cells reduce toxicity and treat prostate cancer in mouse models. Nat Biomed Eng. 2025;10:630-46.
2. Chen S, Lu K, Hou Y, et al. YY1 complex in M2 macrophage promotes prostate cancer progression by upregulating IL-6. J Immunother Cancer. 2023;11:e006020.
3. Nag N, Dutta S. Deubiquitination in prostate cancer progression: role of USP22. J Cancer Metastasis Treat. 2020;6:16.
4. Li H, Melnyk JE, Fu BXH, et al. Genome-scale CRISPR screens identify PTGES3 as a direct modulator of androgen receptor function in advanced prostate cancer. Nat Genet. 2025;57:3027-38.
5. De Laere B, Crippa A, Discacciati A, et al. Androgen receptor pathway inhibitors and taxanes in metastatic prostate cancer: an outcome-adaptive randomized platform trial. Nat Med. 2024;30:3291-302.
6. Li W, Chen S, Lu J, et al. YY1 enhances HIF-1α stability in tumor-associated macrophages to suppress anti-tumor immunity of prostate cancer in mice. Nat Commun. 2025;16:6261.
7. Tilki D, Van Den Bergh RC, Briers E, et al. EAU-EANM-ESTRO-ESUR-ISUP-SIOG guidelines on prostate cancer. Part II—2024 update: treatment of relapsing and metastatic prostate cancer. Eur Urol. 2024;86:164-82.
8. Jiang W, Gan D, Johnson MH, Latich I, Lee FY. Advancements in minimally invasive interventional oncology procedures for painful sacral metastases under imaging guidance. EngMedicine. 2025;2:100051.
9. Wu S, Powers S, Zhu W, Hannun YA. Substantial contribution of extrinsic risk factors to cancer development. Nature. 2015;529:43-7.
10. Dong B, Xu J, Huang Y, et al. Integrative proteogenomic profiling of high-risk prostate cancer samples from Chinese patients indicates metabolic vulnerabilities and diagnostic biomarkers. Nat Cancer. 2024;5:1427-47.
11. Bergom HE, Boytim E, Mcsweeney S, et al. Androgen production, uptake, and conversion (APUC) genes define prostate cancer patients with distinct clinical outcomes. JCI Insight. 2024;9:e183158.
12. Soni N, Das T, Baidya M. Structural insights into an intracellular biased agonist for GPCRs. Nat Struct Mol Biol. 2023;30:1612-4.
13. Congreve M, De Graaf C, Swain NA, Tate CG. Impact of GPCR structures on drug discovery. Cell. 2020;181:81-91.
14. Hou Y, Lu H, Chen S, et al. Investigation of GPR137C as a promising novel marker for the progression of prostate cancer through G4 screen and bioinformatics analyses. Front Immunol. 2025;16:1576835.
15. Herrera LPT, Andreassen SN, Caroli J, et al. GPCRdb in 2025: adding odorant receptors, data mapper, structure similarity search and models of physiological ligand complexes. Nucleic Acids Res. 2025;53:D425-35.
16. Jiang G, Wang Z, Cheng Z, et al. The integrated molecular and histological analysis defines subtypes of esophageal squamous cell carcinoma. Nat Commun. 2024;15:8988.
17. Nieto Gutierrez A, Mcdonald PH. GPCRs: emerging anti-cancer drug targets. Cell Signal. 2018;41:65-74.
18. Khan S, Simsek R, Fuentes JDB, Vohra I, Vohra S. Implication of toll-like receptors in growth and management of health and diseases: special focus as a promising druggable target to Prostate Cancer. Biochim Biophys Acta Rev Cancer. 2025;1880:189229.
19. Feng Q, Li S, Ma H, Yang W, Zheng P. LGR6 activates the Wnt/β-catenin signaling pathway and forms a β-catenin/TCF7L2/LGR6 feedback loop in LGR6high cervical cancer stem cells. Oncogene. 2021;40:6103-14.
20. Wang J, Koch DT, Hofmann FO, et al. WNT enhancing signals in pancreatic cancer are transmitted by LGR6. Aging. 2023;15:205101.
21. Crowley L, Cambuli F, Aparicio L, et al. A single-cell atlas of the mouse and human prostate reveals heterogeneity and conservation of epithelial progenitors. eLife. 2020;9:e59465.
22. Chen S, Zhu G, Yang Y, et al. Single-cell analysis reveals transcriptomic remodellings in distinct cell types that contribute to human prostate cancer progression. Nat Cell Biol. 2021;23:87-98.
23. Ping Y, Xiao P, Yang F, et al. Structural basis for the tethered peptide activation of adhesion GPCRs. Nature. 2022;604:763-70.
24. Munk C, Isberg V, Mordalski S, et al. GPCRdb: the G protein‐coupled receptor database - an introduction. Br J Pharmacol. 2016;173:2195-207.
25. Turku A, Schihada H, Kozielewicz P, Bowin C, Schulte G. Residue 6.43 defines receptor function in class F GPCRs. Nat Commun. 2021;12:3919.
26. Ritchie ME, Phipson B, Wu D, et al. Limma powers differential expression analyses for RNA-sequencing and microarray studies. Nucleic Acids Res. 2015;43:e47.
27. Love MI, Huber W, Anders S. Moderated estimation of fold change and dispersion for RNA-seq data with DESeq2. Genome Biol. 2014;15:550.
28. Robinson MD, Mccarthy DJ, Smyth GK. edgeR: a bioconductor package for differential expression analysis of digital gene expression data. Bioinformatics. 2010;26:139-40.
29. Wu T, Hu E, Xu S, et al. clusterProfiler 4.0: a universal enrichment tool for interpreting omics data. Innovation. 2021;2:100141.
30. Abramson J, Adler J, Dunger J, et al. Accurate structure prediction of biomolecular interactions with AlphaFold 3. Nature. 2024;630:493-500.
31. Schmitz S, Ertelt M, Merkl R, Meiler J. Rosetta design with co-evolutionary information retains protein function. PLoS Comput Biol. 2021;17:e1008568.
32. Del Conte A, Monzon AM, Clementel D, et al. RING-PyMOL: residue interaction networks of structural ensembles and molecular dynamics. Bioinformatics. 2023;39:btad260.
33. Yu S, Mulero MC, Chen W, et al. Therapeutic targeting of tumor cells rich in LGR stem cell receptors. Bioconjugate Chem. 2021;32:376-84.
34. Tocci JM, Felcher CM, García Solá ME, et al. R-spondin3 is associated with basal-progenitor behavior in normal and tumor mammary cells. Cancer Res. 2018;78:4497-511.
35. Scharr M, Scherer S, Fuchs J, Hirt B, Neckel PH. R-spondin1 regulates fate of enteric neural progenitors via differential LGR4/5/6 expression in mice and humans. Cell Mol Gastroenterol Hepatol. 2026;20:101642.
Cite This Article
 Open Access
How to Cite
Download Citation
Export Citation File:
Type of Import
Tips on Downloading Citation
Citation Manager File Format
Type of Import
Direct Import: When the Direct Import option is selected (the default state), a dialogue box will give you the option to Save or Open the downloaded citation data. Choosing Open will either launch your citation manager or give you a choice of applications with which to use the metadata. The Save option saves the file locally for later use.
Indirect Import: When the Indirect Import option is selected, the metadata is displayed and may be copied and pasted as needed.
About This Article
Copyright

Data & Comments
Data
0






Comments
Comments must be written in English. Spam, offensive content, impersonation, and private information will not be permitted. If any comment is reported and identified as inappropriate content by OAE staff, the comment will be removed without notice. If you have any queries or need any help, please contact us at support@oaepublish.com.