



fig1
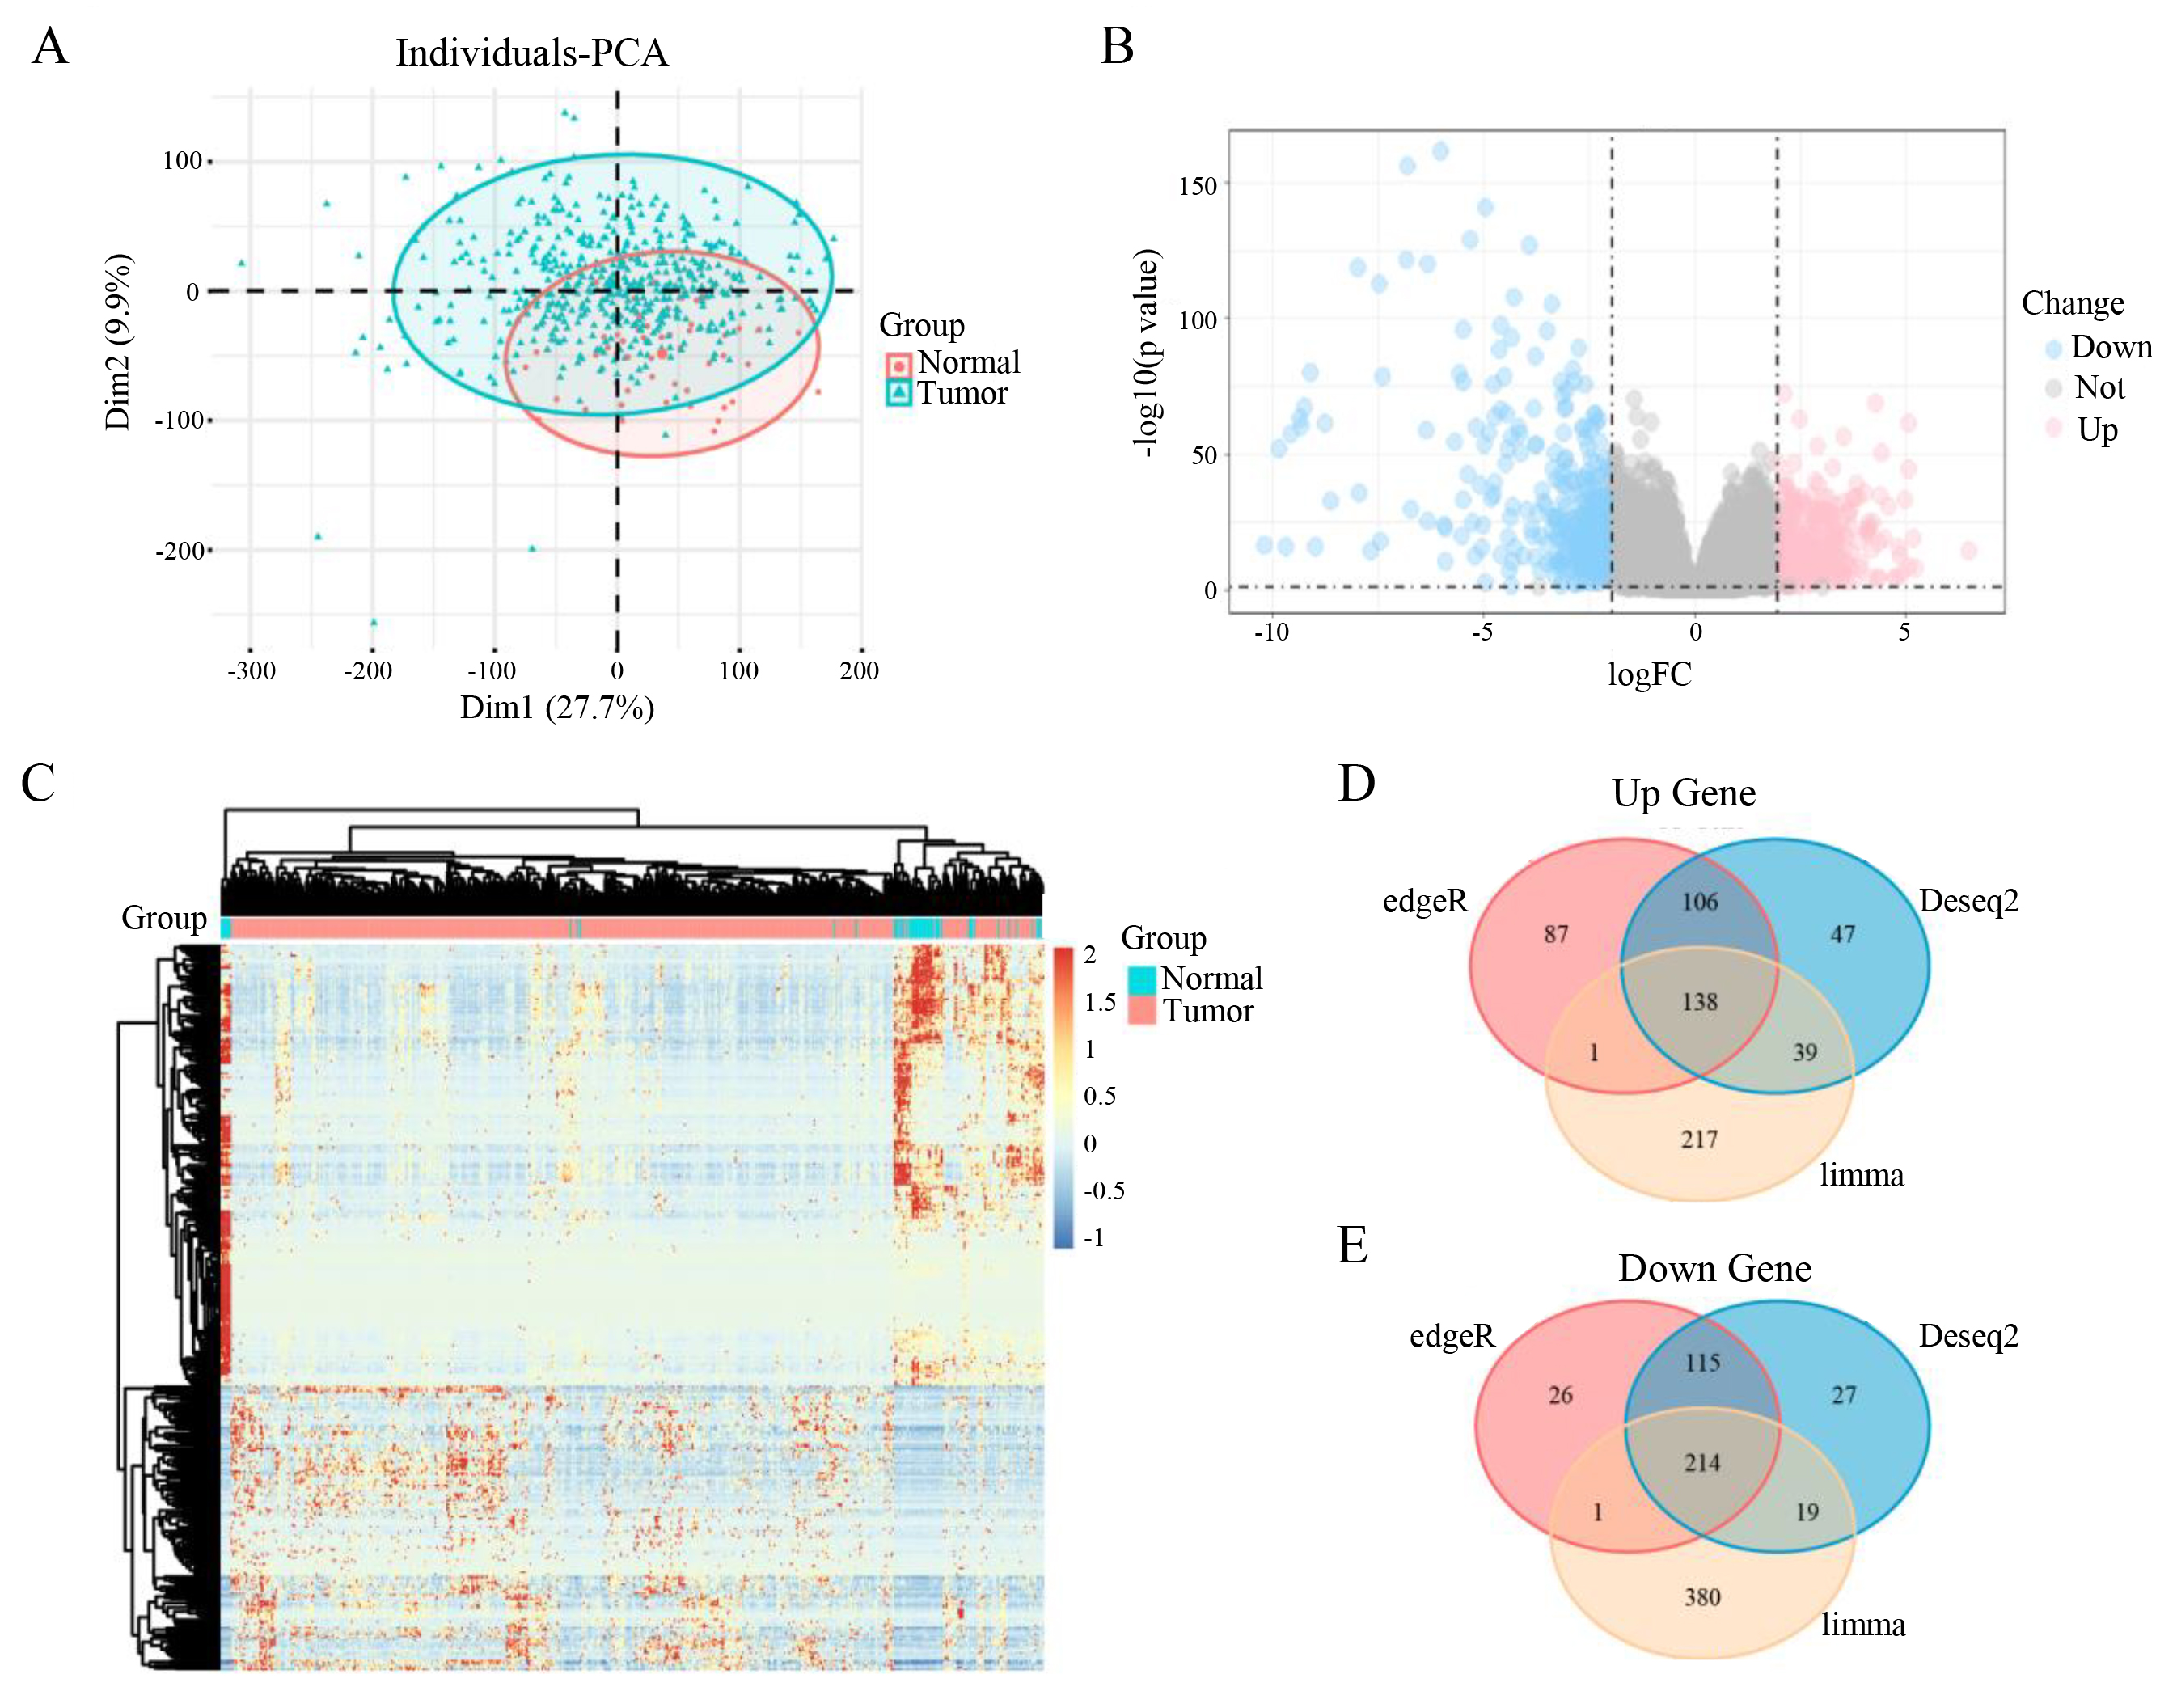
Figure 1. Identification and validation of differentially expressed genes in prostate cancer. (A) PCA plot showing tumor samples in blue and normal samples in red. (B) Volcano plot of differentially expressed genes, with down-regulated genes in blue and up-regulated genes in red. (C) Heatmap of differentially expressed genes, where red indicates up-regulation and blue indicates down-regulation. (D and E) Venn diagrams display the number of up-regulated (D) and down-regulated (E) genes identified by the three methods, with 352 common differentially expressed genes in total.