



fig2
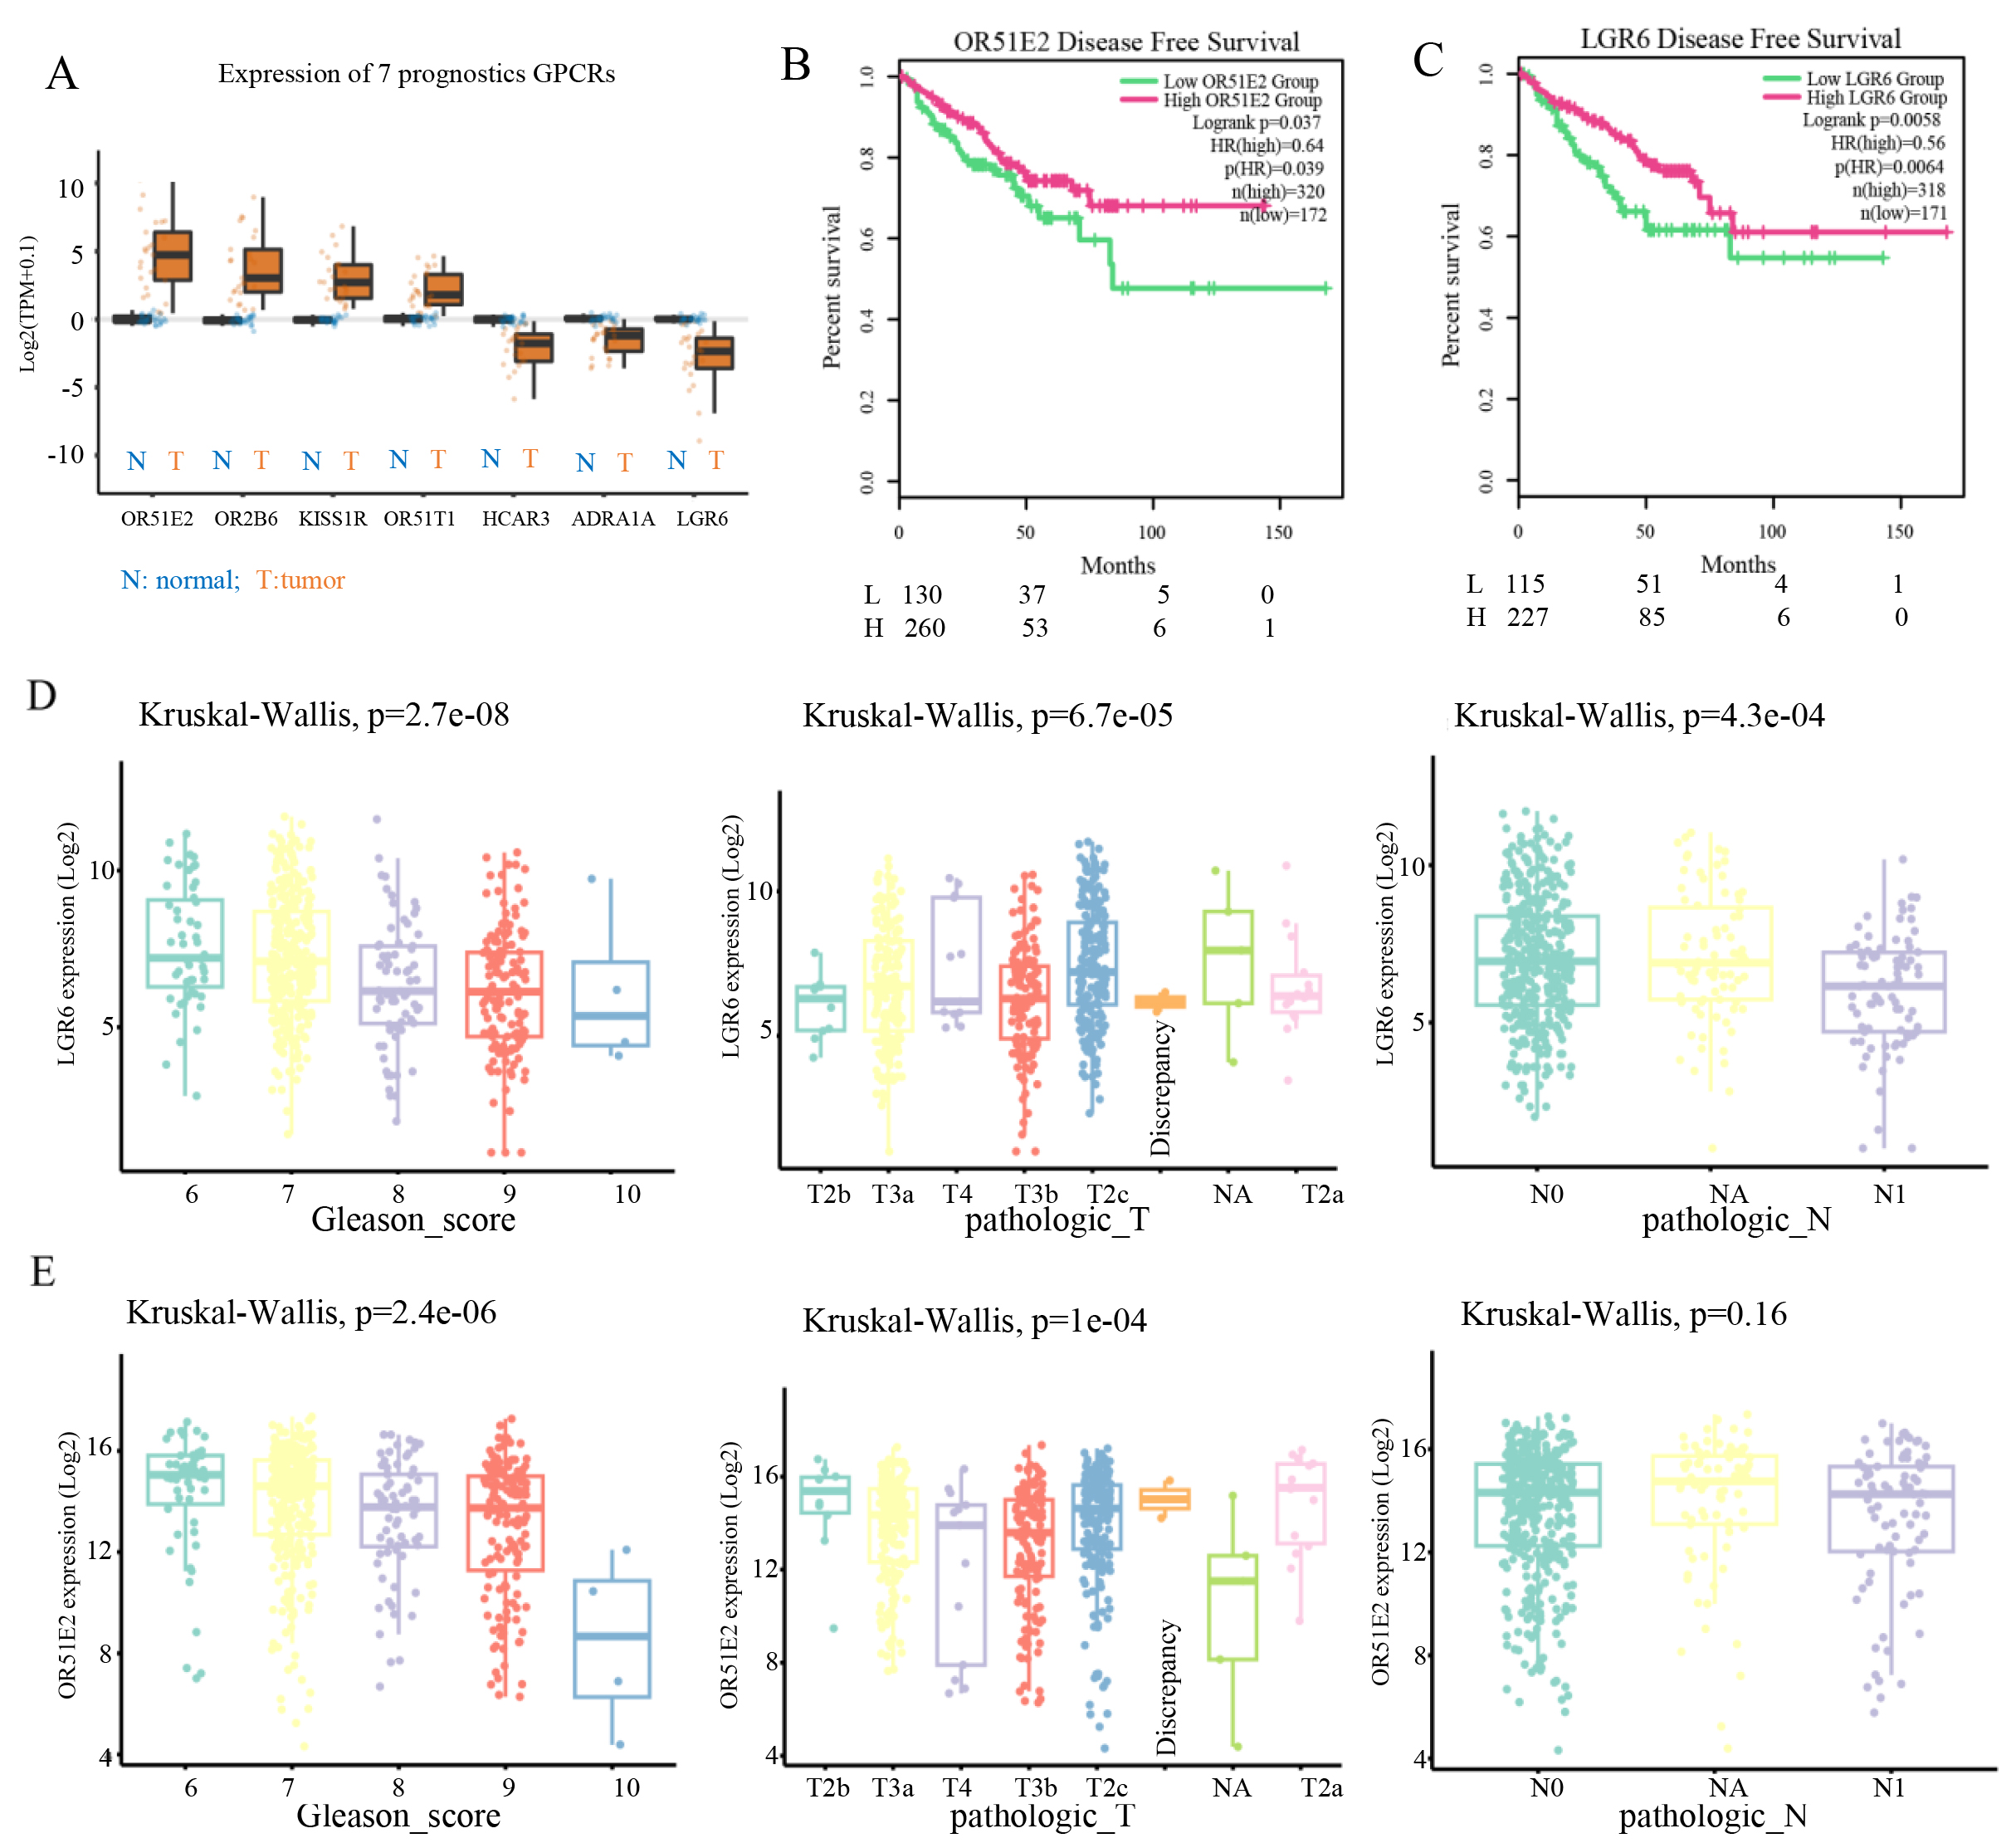
Figure 2. Survival and clinical correlation analysis of prognosis-associated GPCR genes. (A) Box plots showing differential expression of the 7 prognosis-associated genes, with blue and orange boxes indicating normal and case groups, respectively. (B) Disease-free survival (DFS) analysis of OR51E2, with green and red curves representing low and high expression groups, respectively. (C) DFS analysis of LGR6. (D and E) Clinical correlation analyses of LGR6 (D) and OR51E2 (E), including associations with Gleason score, T stage, and N stage.