


fig6
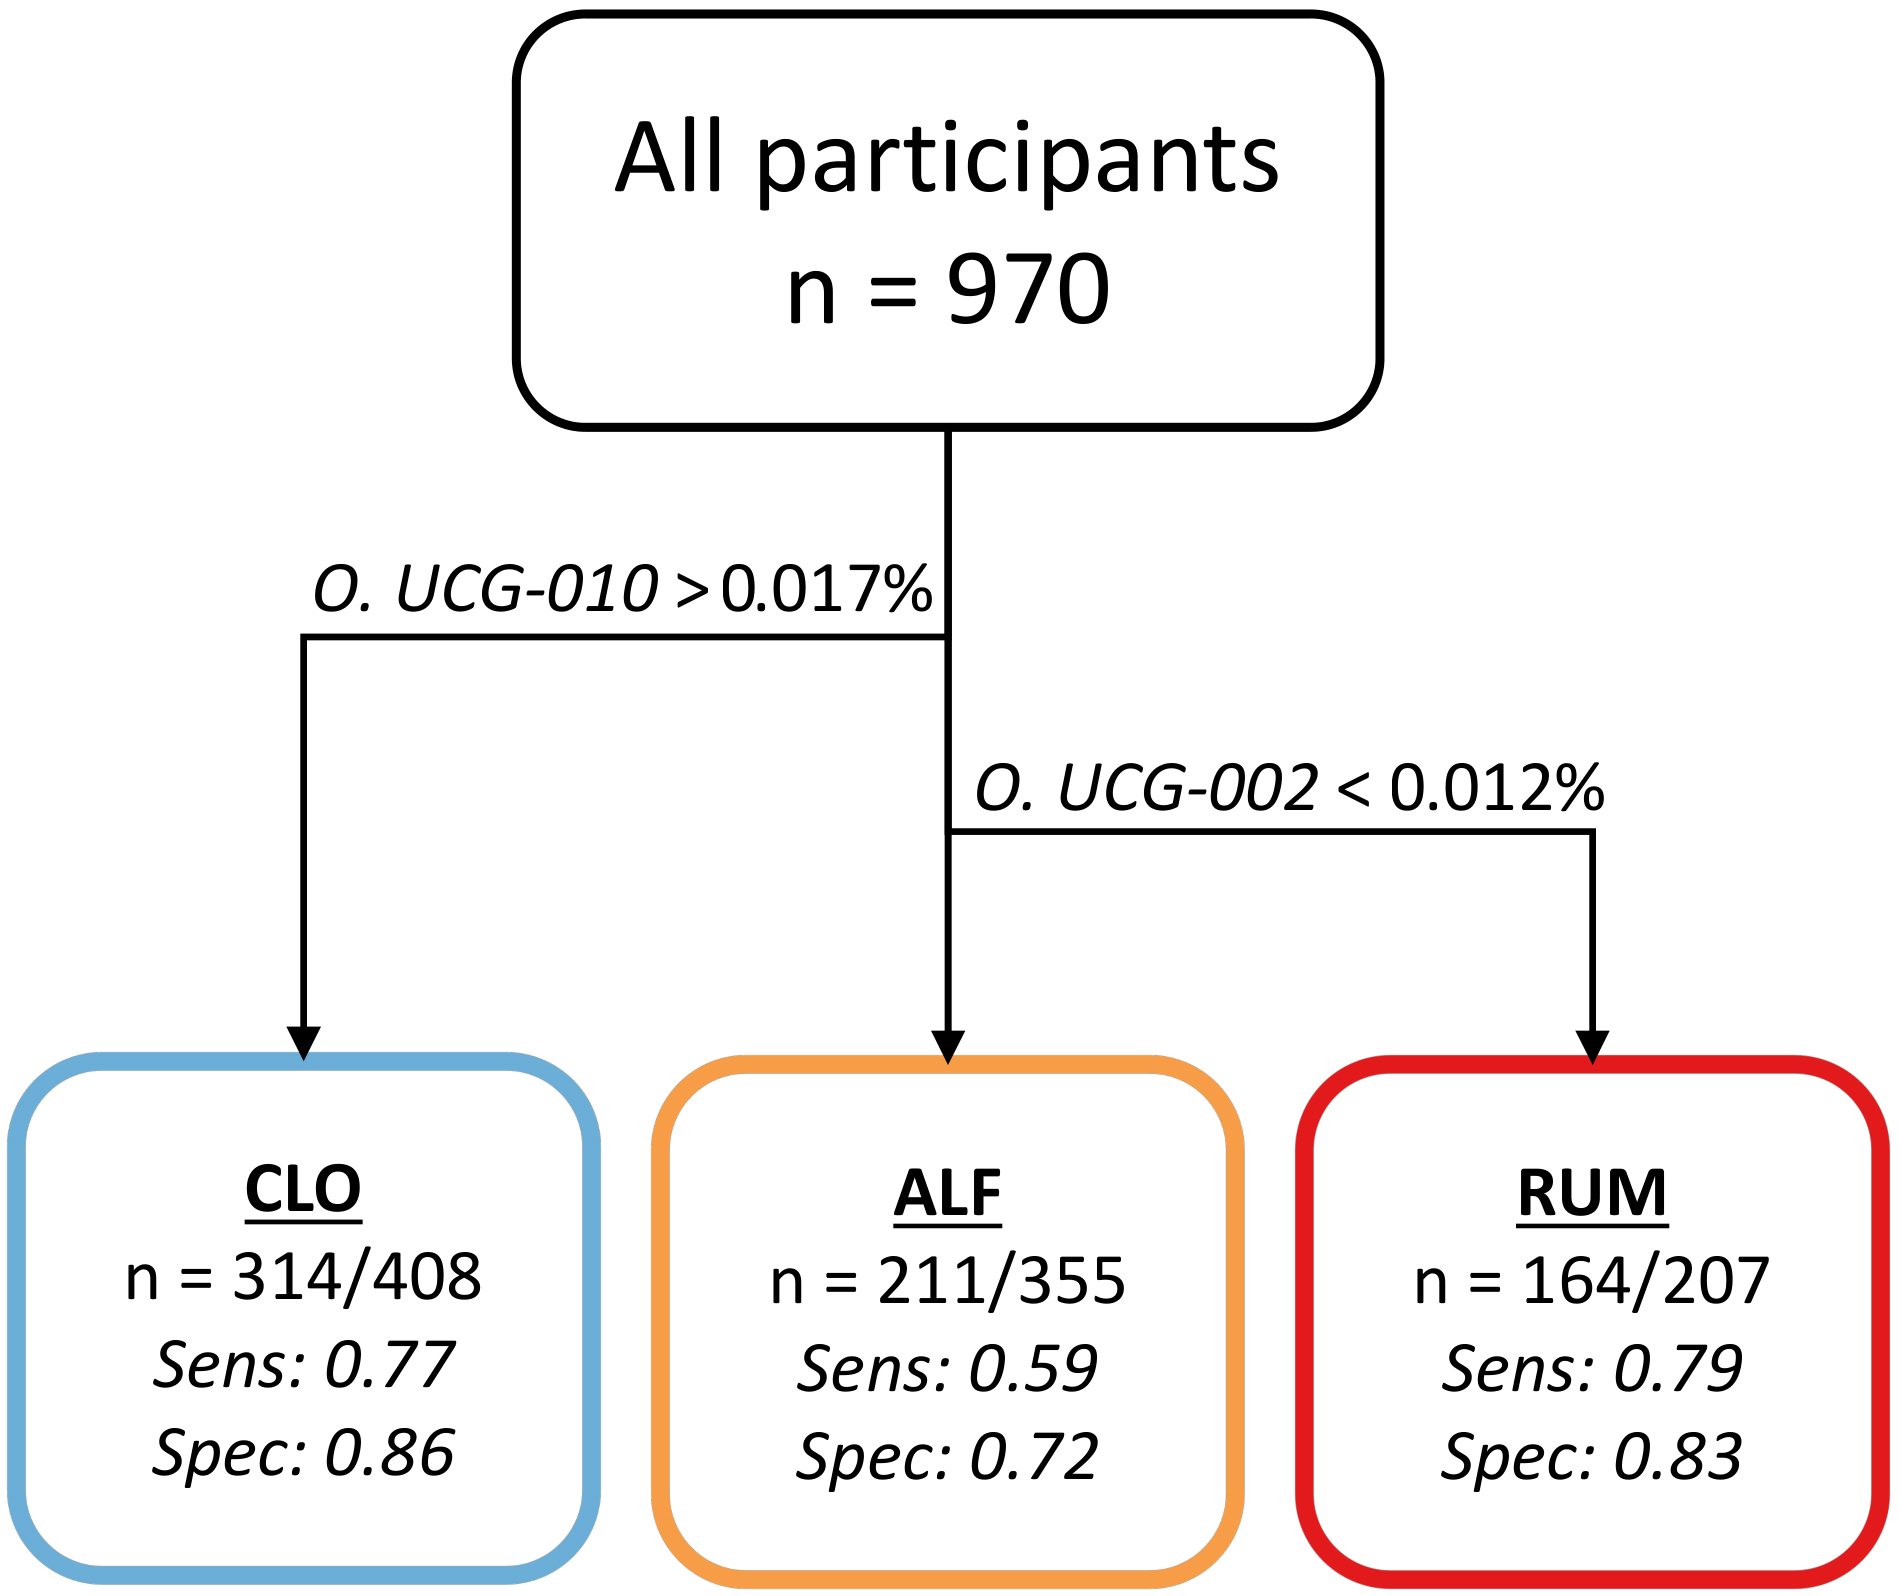
Figure 6. Flowchart illustrating the optimal decision tree with regard to sensitivity (sens.) and specificity (spec.). Samples with O. UCG-010 at a relative abundance > 0.017% are categorized as CLO, with a sens./spec. of 0.77/0.86. Samples with O. UCG-010 below this threshold but O. UCG-002 > 0.012% are categorized as ALF with a sens./spec. of 0.59/0.72. Samples with below-threshold levels of both taxa are categorized as RUM, with a sens./spec. of 0.79/0.83. Figure created in Microsoft PowerPoint.


