


fig3
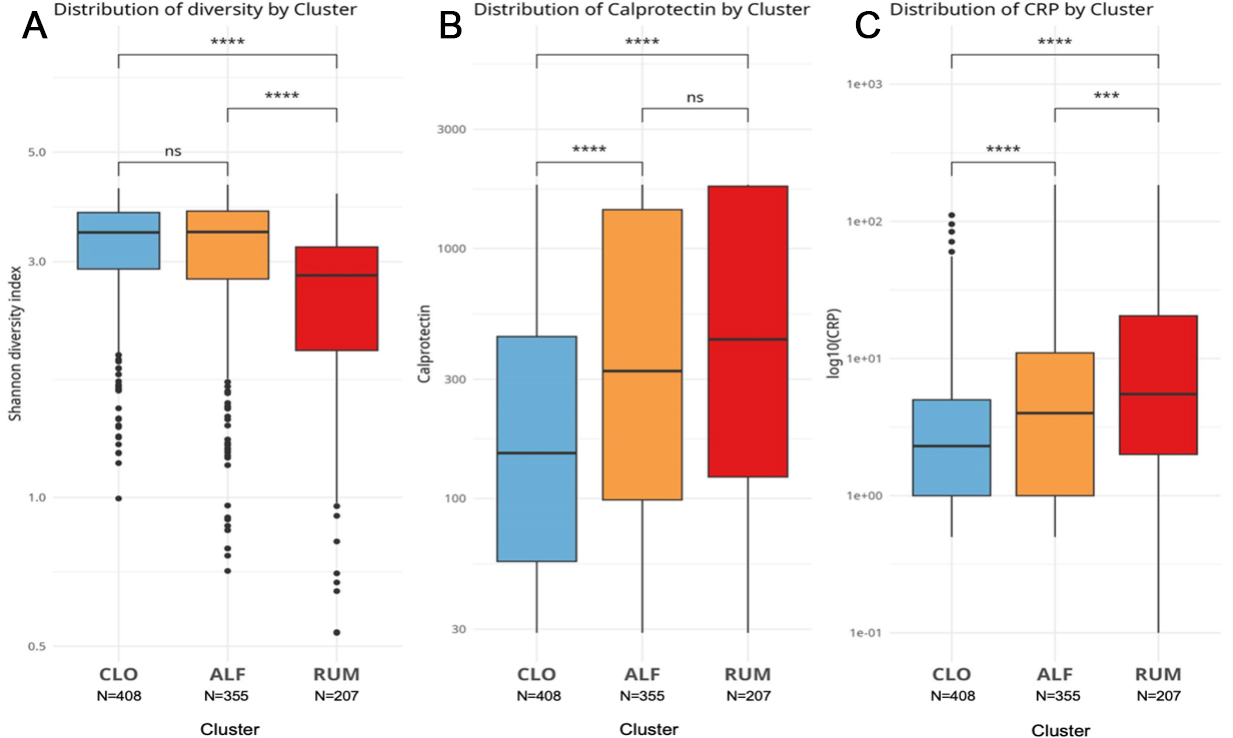
Figure 3. Boxplots comparing key measurements between clusters, with Mann-Whitney test statistics: (A) Shannon diversity index, (B) fecal calprotectin, and (C) C-reactive protein. Blue = CLO, yellow = ALF, red = RUM. Ns = not significant, ***P < 0.001, ****P < 0.0001. Figure created with ggplot2.0 in R. CLO: Clostridia UCG-014; ALF: Agathobacter, Lachnoclostridium, and Faecalibacterium; RUM: Ruminococcus gnavus; CRP: C-reactive protein.


