


fig6
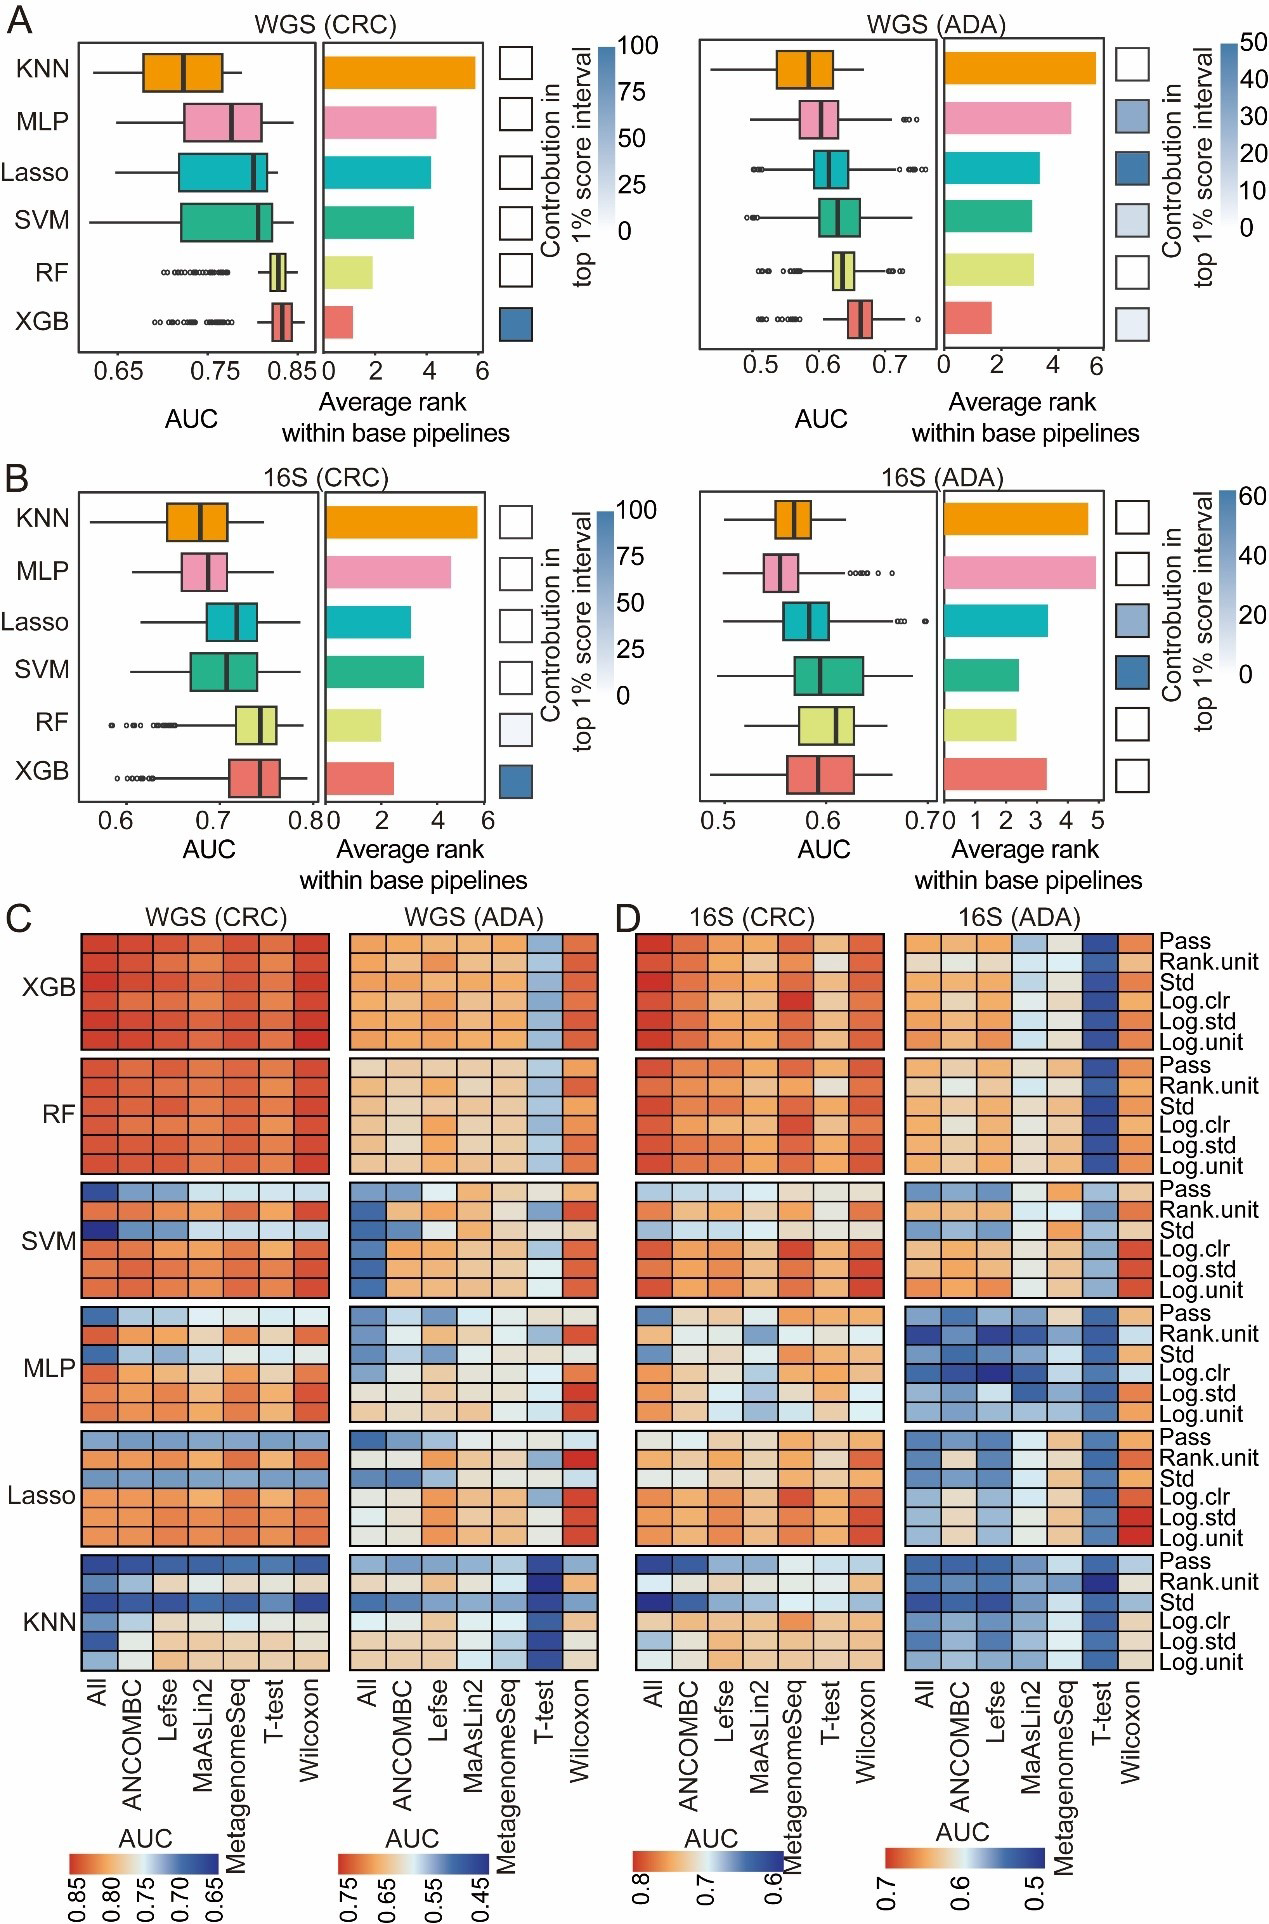
Figure 6. Evaluation of classification algorithms. For both CRC and ADA detection based on (A) WGS and (B) 16S data, this figure evaluates six classification algorithms across 1,512 base pipelines. The left and middle panels respectively plot the distribution of AUC scores and the average performance ranking for each strategy. The heatmaps (right panels) illustrate each strategy’s contribution to the top 1% of pipelines. The heat map shows the performance analysis results of disease detection for CRC and ADA based on WGS (C) and 16S (D) sequencing data, respectively. Source data is available in Supplementary dataset. WGS: Whole genome sequencing; CRC: colorectal cancer; ADA: adenoma; 16S: 16S rRNA gene sequencing; AUC: area under the curve; KNN: k-nearest neighbors; MLP: multilayer perceptron; Lasso: least absolute shrinkage and selection operator; SVM: support vector machine; RF: random forest; XGB: eXtreme Gradient Boosting; Std: standardization; Log.clr: log centered log-ratio transformation; Log.std: log transformation with standardization; Log.unit: log transformation with unit scaling; Rank.unit: rank normalization with unit scaling; MaAsLin2: multivariable association with linear models 2; ANCOMBC: analysis of composition of microbiomes with bias correction; MetagenomeSeq: MetagenomeSeq (zero-inflated Gaussian model toolkit);Lefse: linear discriminant analysis effect size.


