


fig5
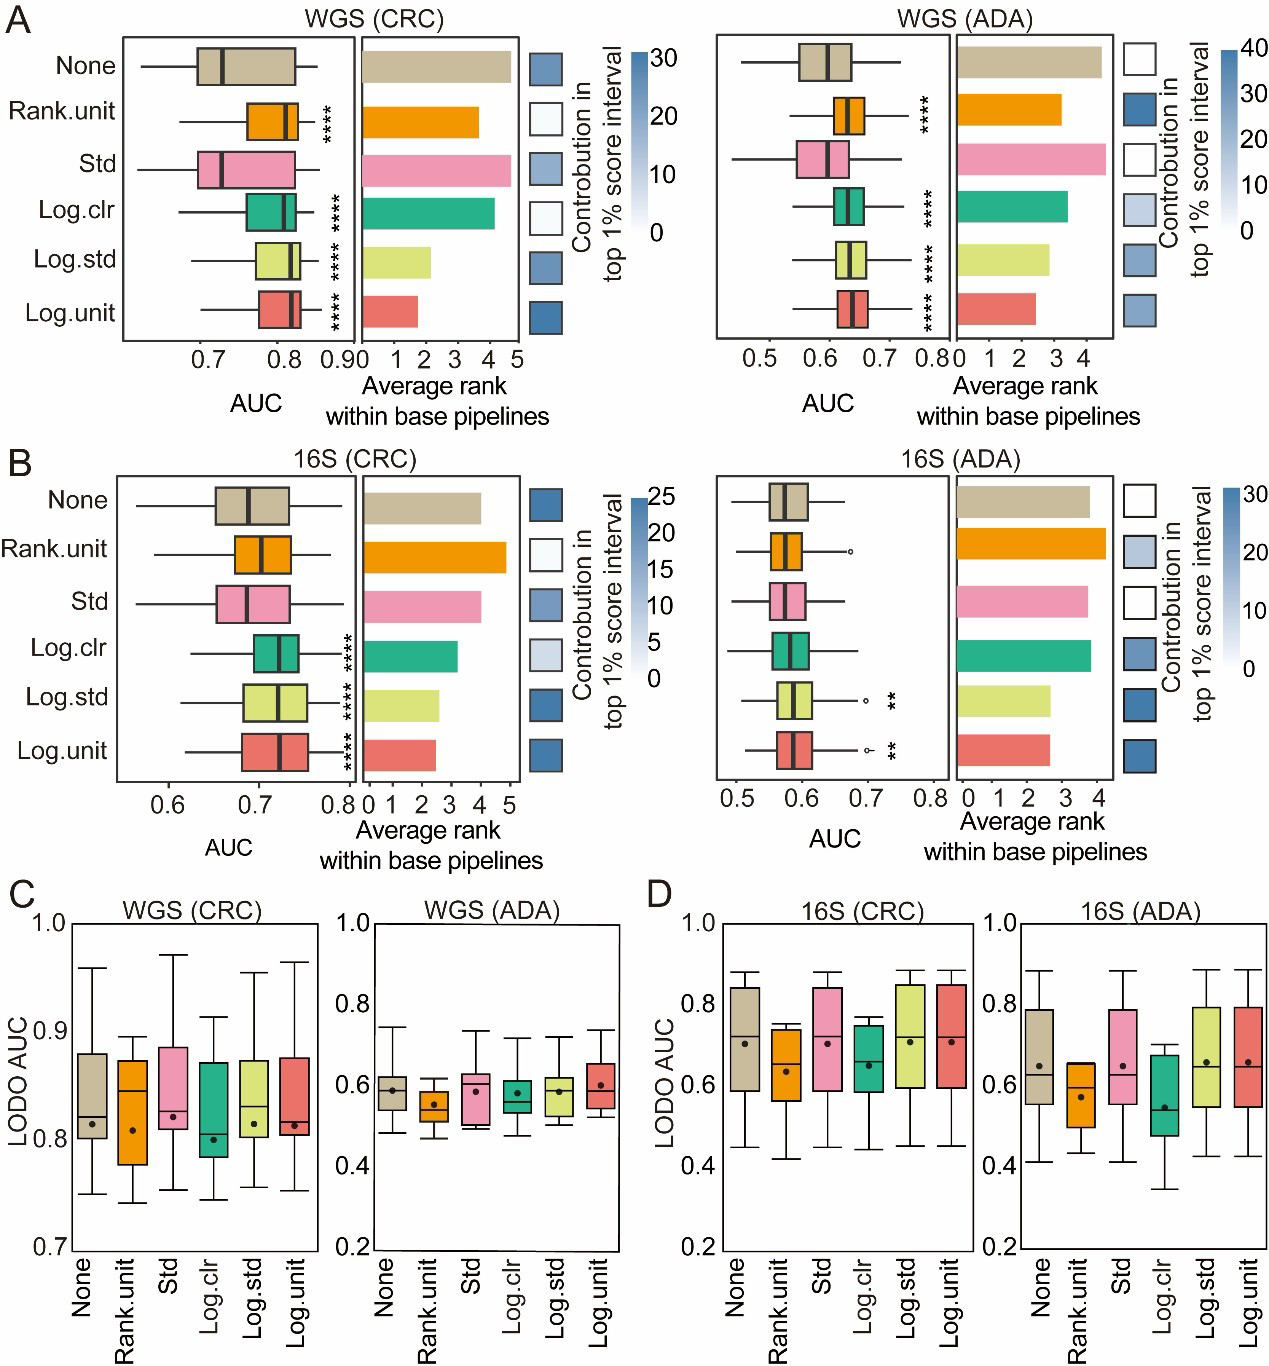
Figure 5. Evaluation of normalization methods. For both CRC and ADA detection based on (A) WGS and (B) 16S data, this figure evaluates 6 normalization methods across 1,512 base pipelines. The left and middle panels respectively plot the distribution of AUC scores and the average performance ranking for each strategy. The contribution of each strategy to the top 1% of processes is shown in the heat map in the right panel. Fisher’s exact test was employed to calculate the significance of this enrichment (P-values are indicated as follows: NS > 0.05; * < 0.05; ** < 0.01; and **** < 0.001); (C and D) Performance in LODO validation. Box plots show the distribution of LODO-AUCs for the six normalization methods using (C) WGS and (D) 16S data. Source data is available in Supplementary dataset. WGS: Whole genome sequencing; CRC: colorectal cancer; ADA: adenoma; 16S: 16S rRNA gene sequencing; AUC: area under the curve; LODO: Leave-One-Dataset-Out; Std: standardization; Log.clr: log centered log-ratio transformation; Log.std: log transformation with standardization; Log.unit: log transformation with unit scaling; Rank.unit: rank normalization with unit scaling.


