


fig5
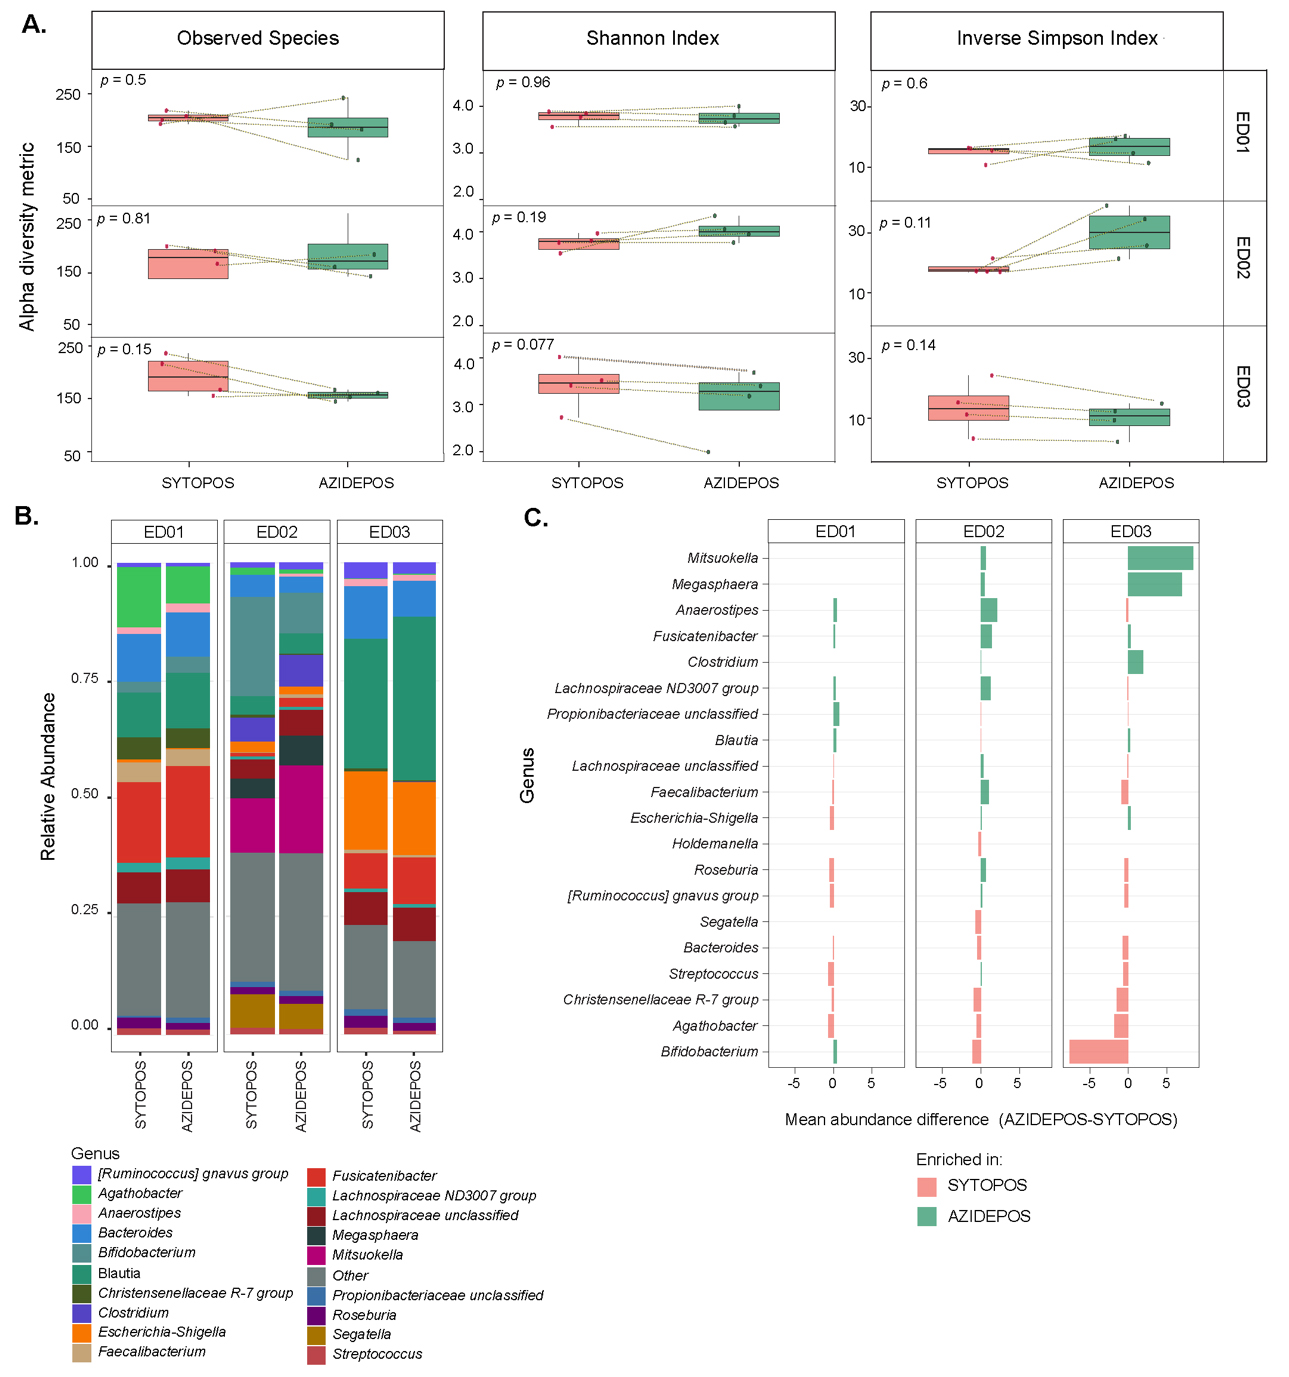
Figure 5. Microbial community diversity and composition of drug-associated or total microbial cell fractions sorted by FACS. (A) Alpha diversity metrics across sorted cell populations. For each metric, samples from the same donor were compared between SYTOPOS (total microbial cells) and AZIDEPOS (EB-11-38-associated cell populations) fractions (paired cell sorts from the same sample). Statistical significance was evaluated using paired t-tests, and P-values are shown on each plot. Panels are facetted by donor; (B) Relative abundance of bacterial genera across samples sorted by SYTOPOS and AZIDEPOS populations at 4- and 6-h timepoints. Bar plots show the relative abundance of the top 20 bacterial genera (y-axis) within each sorted sample (x-axis), grouped by donor and treatment condition. Genera not among the top 20 are grouped under “Other”; (C) Bar plot depicting the difference in mean relative abundance of microbial genera in AZIDEPOS and SYTOPOS populations across three donors at 4- and 6-h timepoints. Each bar represents a genus, with colours indicating whether the genus is more abundant in drug-associated cells (green) or in the total microbial community (light red). The x-axis lists microbial genera, while the y-axis represents the difference in abundance (AZIDEPOS minus SYTOPOS). T>-test analysis revealed no significant differences in genera abundance between sorted fractions (all comparisons: P < 0.05). FACS: Fluorescence-activated cell sorting.


