


fig2
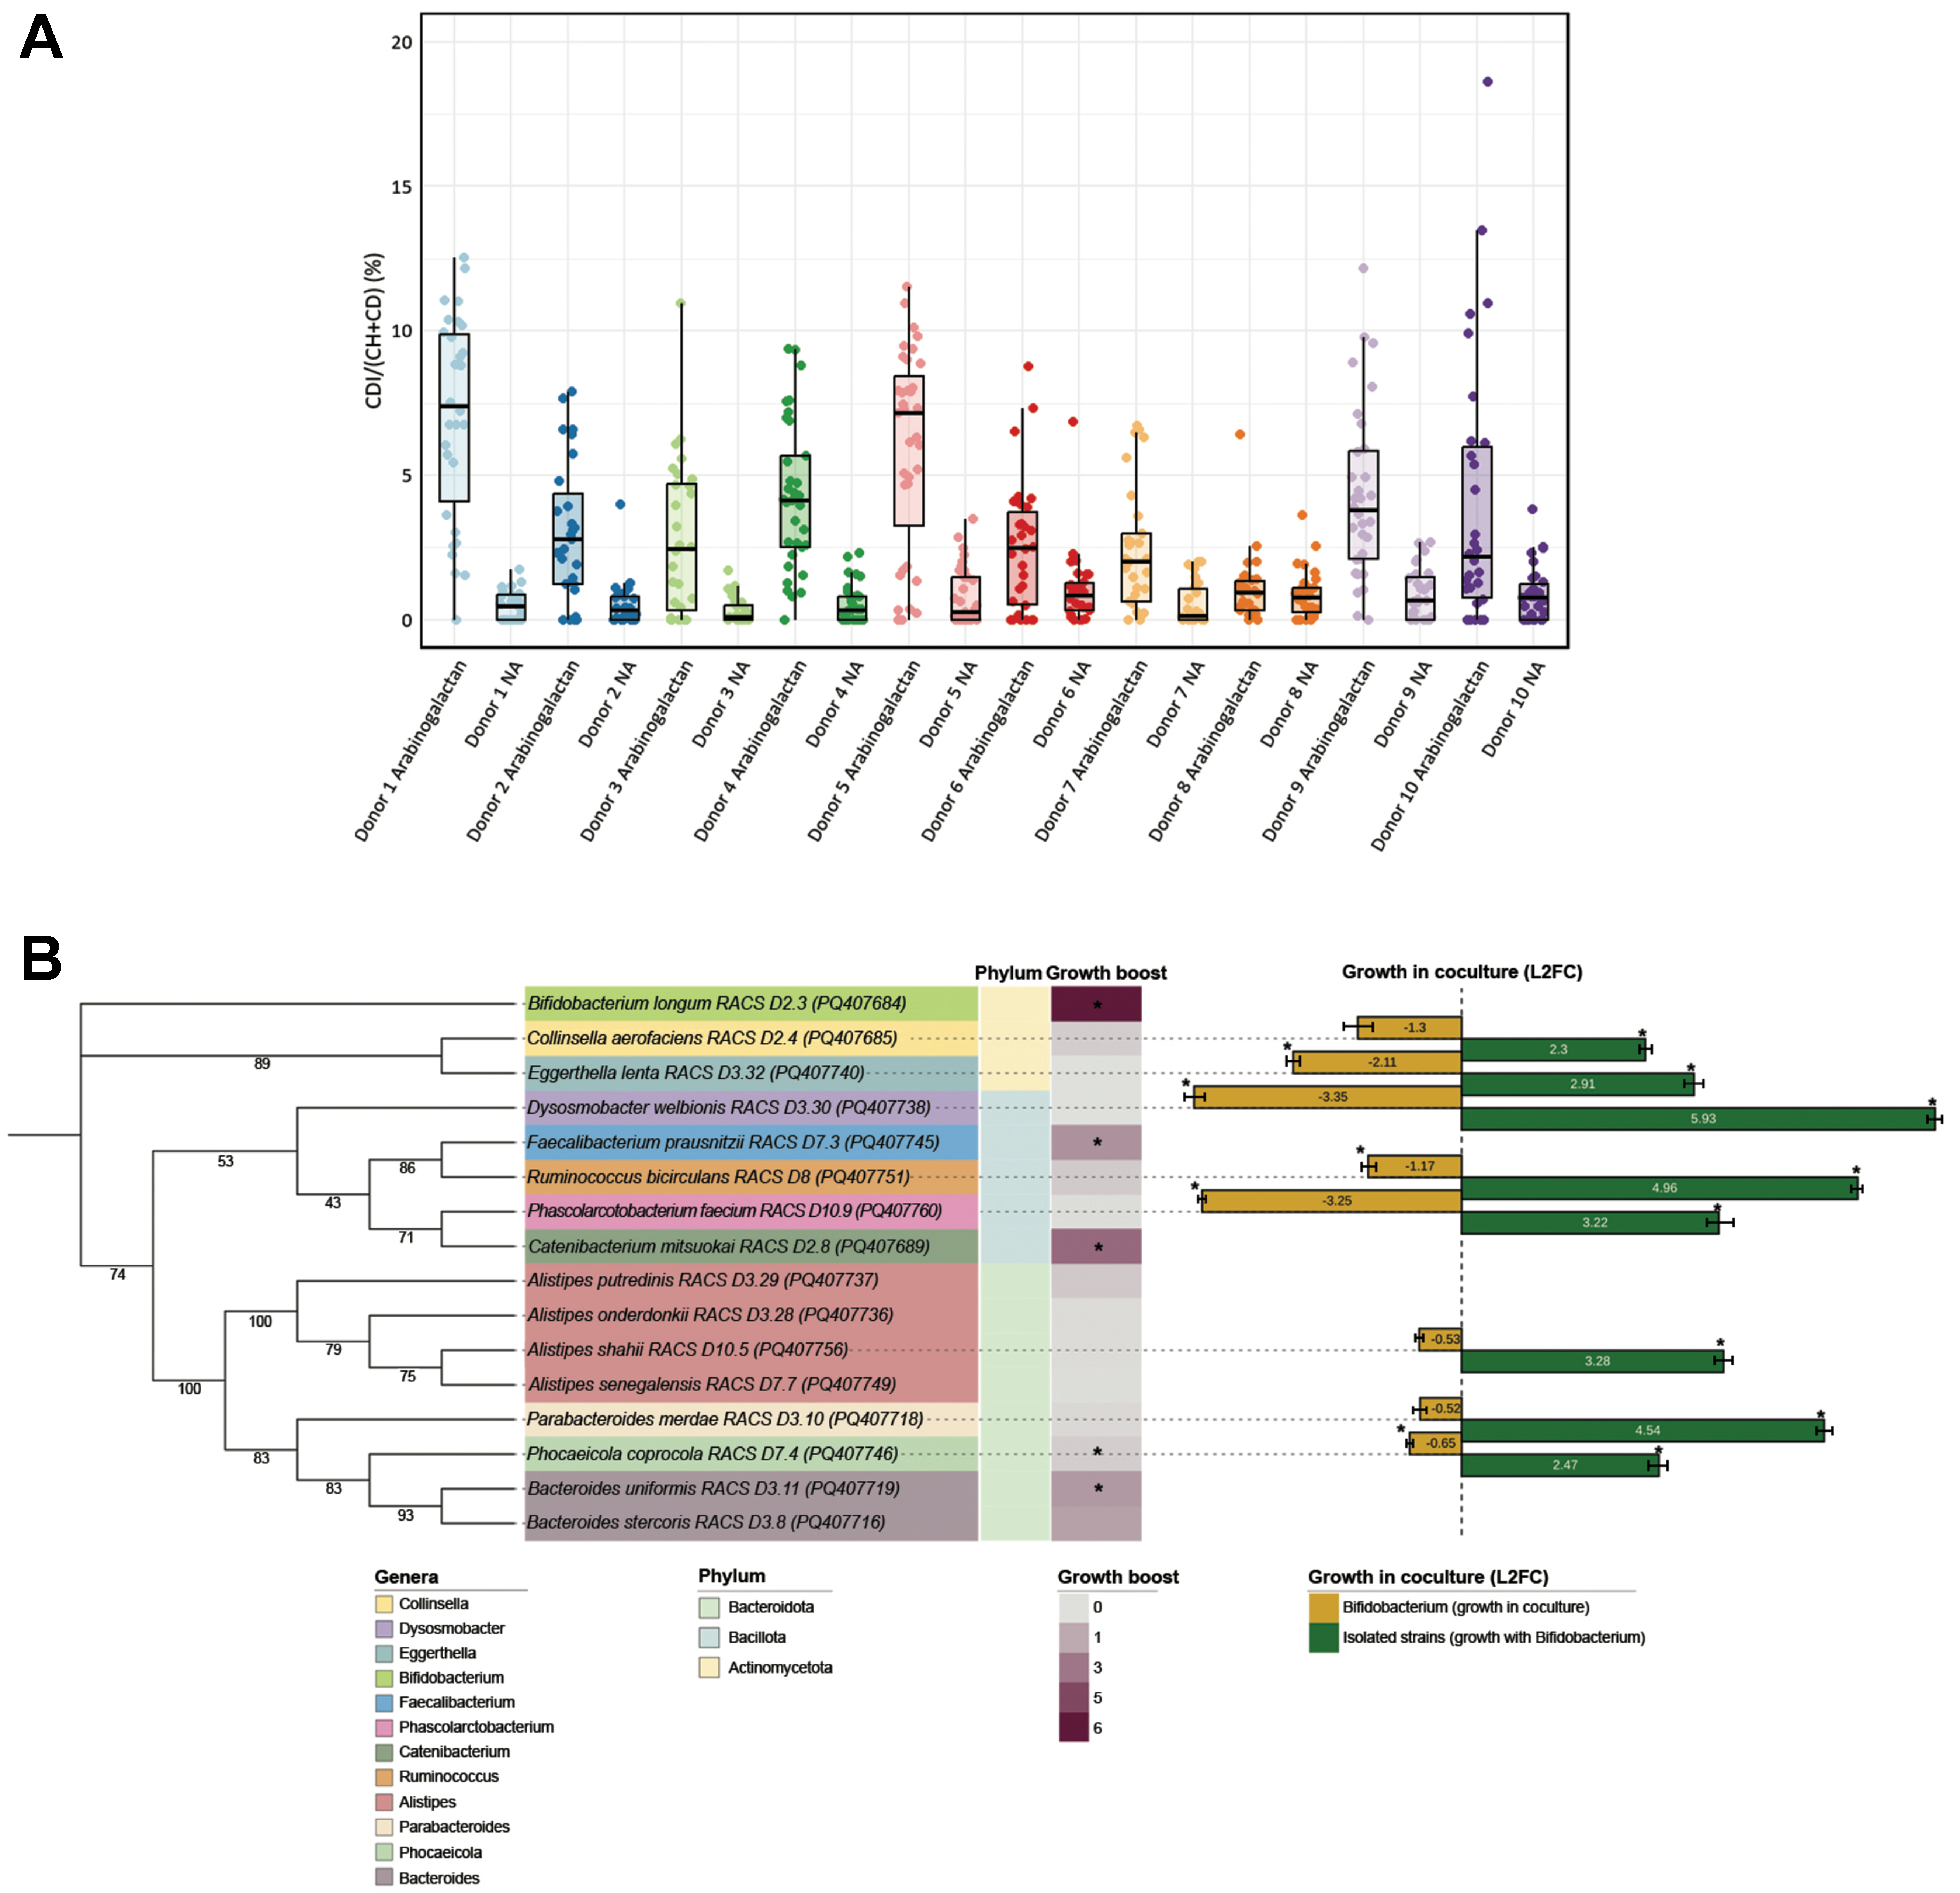
Figure 2. Raman-based detection and physiological analysis of arabinogalactan-responsive gut microbes. (A) Single-cell analysis of microbial metabolic activity in response to arabinogalactan. The percentage of deuterium incorporation (%CD) was measured in individual cells following 6 h of incubation with D2O, with or without arabinogalactan. The dots indicate single-cell measurements collected from each ten donors, while boxplots illustrate the spread of %CD values across conditions. Statistical testing across all donors revealed a significant increase in microbial metabolic activity following arabinogalactan treatment (ANOVA, P < 0.001, n = 607); (B) Phylogenetic and physiological profiling of representative arabinogalactan-responsive isolates. A mid-point rooted maximum likelihood phylogenetic tree was generated from near full-length 16S rRNA gene sequences of 16 representative strains isolated via RACS. Branch support values are based on 1,000 ultrafast bootstrap replicates. The tree generation was performed using the aligned sequences, with subsequent visualization annotated in iTOL[51]. The heatmap displays growth boost, calculated as the area under the growth curve in arabinogalactan-supplemented media relative to no-amendment control, based on three technical replicates per condition. Asterisks indicate statistically significant differences in AUC between the two conditions (Student’s t-test, P < 0.05, n = 6). Color. Bar plots show L2FC in abundance of each strain after 24 h of coculture with B. longum, as quantified by qPCR based on the average of three technical replicates. Asterisks (*) indicate significant differences in growth (Student’s t-test, P < 0.05, n = 6). ANOVA: Analysis of variance; RACS: Raman-activated cell sorting; iTOL: interactive tree of life; AUC: area under the curve; L2FC: log2 fold change; qPCR: quantitative PCR.


