


fig2
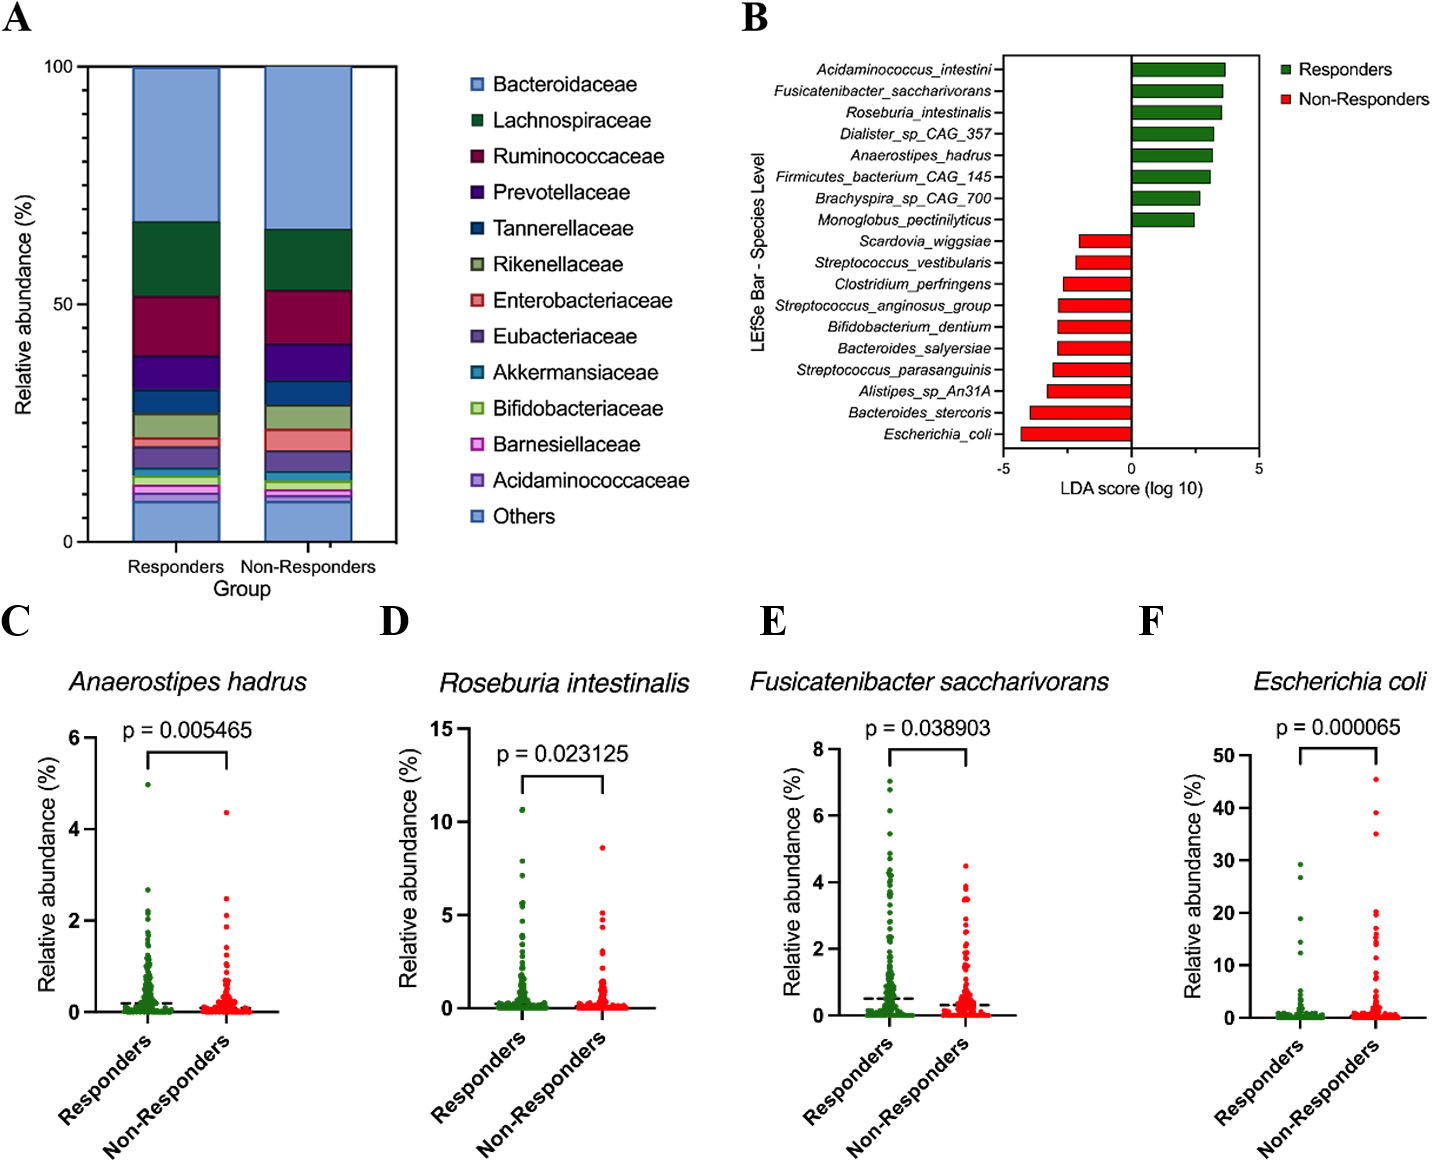
Figure 2. Taxonomic differences between responders and non-responders. (A) Family-level composition of the gut microbiota in responders (R, n = 155) and non-responders (NR, n = 114). Stacked bar plots show the mean relative abundance (%) of major bacterial families; minor families are grouped as “Others”; (B) LEfSe analysis at the species level comparing responders (R, n = 155) and non-responders (NR, n = 114); (C-F) Relative abundance of selected species in responders and non-responders. Panels show Anaerostipes hadrus (C), Roseburia intestinalis (D), Fusicatenibacter saccharivorans (E), and Escherichia coli (F). Relative abundances are expressed as percentages. Group comparisons were performed using two-sided Mann-Whitney U tests; P-values are shown in each panel.


