


fig6
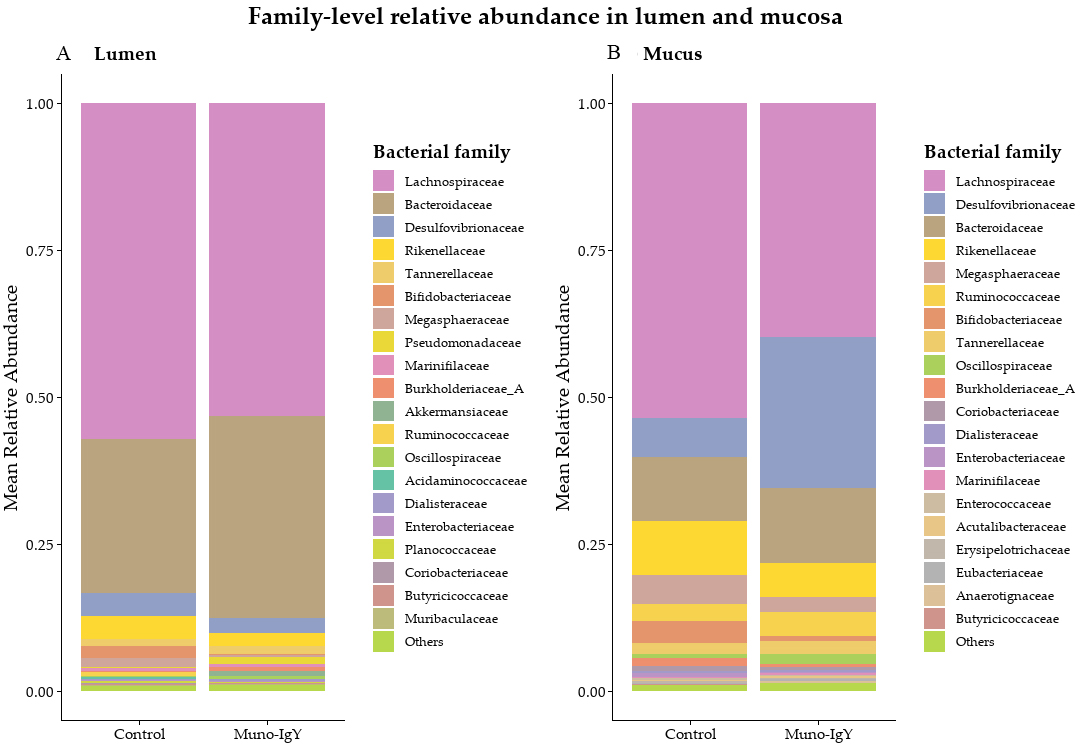
Figure 6. Family-level relative abundance in lumen and mucosal compartments. Relative abundance was calculated from normalized sequencing reads and expressed as the mean proportion per treatment group. (A) Luminal microbiota composition showing mean relative abundance of the top 20 bacterial families across control and Muno-IgY® treatments, with remaining taxa grouped as “Others”; (B) Mucosal microbiota composition showing mean relative abundance of the top 20 bacterial families across control and Muno-IgY® treatments, with remaining taxa grouped as “Others”. No taxa reached statistical significance following false discovery rate (FDR) correction, therefore, differences are presented descriptively. IgY: Immunoglobulin Y.


