




fig8
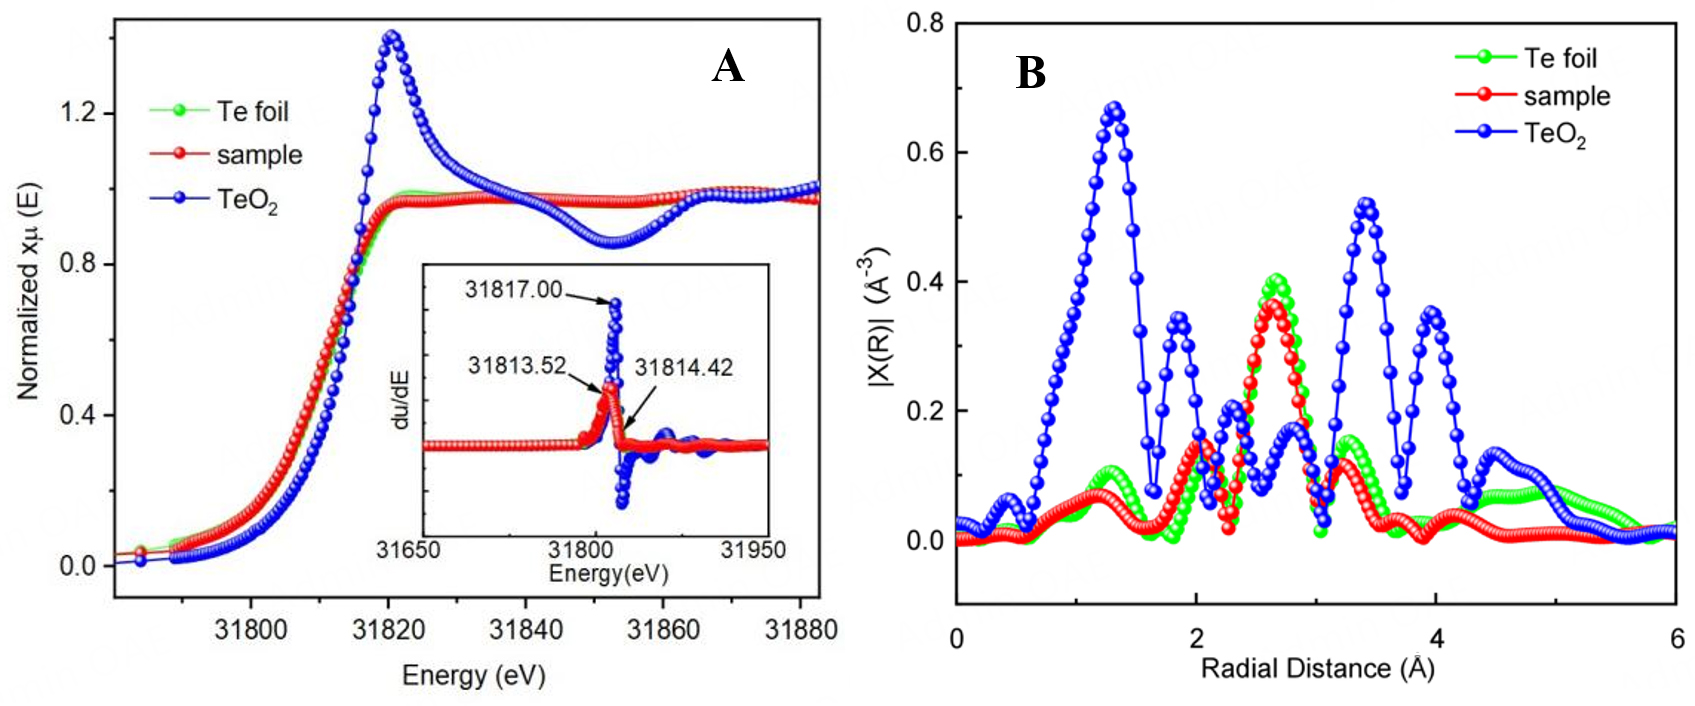
Figure 8. The comparison of Te K-edge X-ray absorption fine structure (XAFS) spectra. (A) X-ray absorption near edge structure spectra. The inset shows the first derivative plot of the absorption coefficient. The absorption edges of CdTe (Te), Te foil, and TeO2 are 31,813.52, 31,814.42 and 31,817.00 eV, respectively. (B) k2 weighted R-space extended X-ray absorption fine structure spectra, shown to compensate for signal attenuation at high wave vector (k) value.





