




fig1
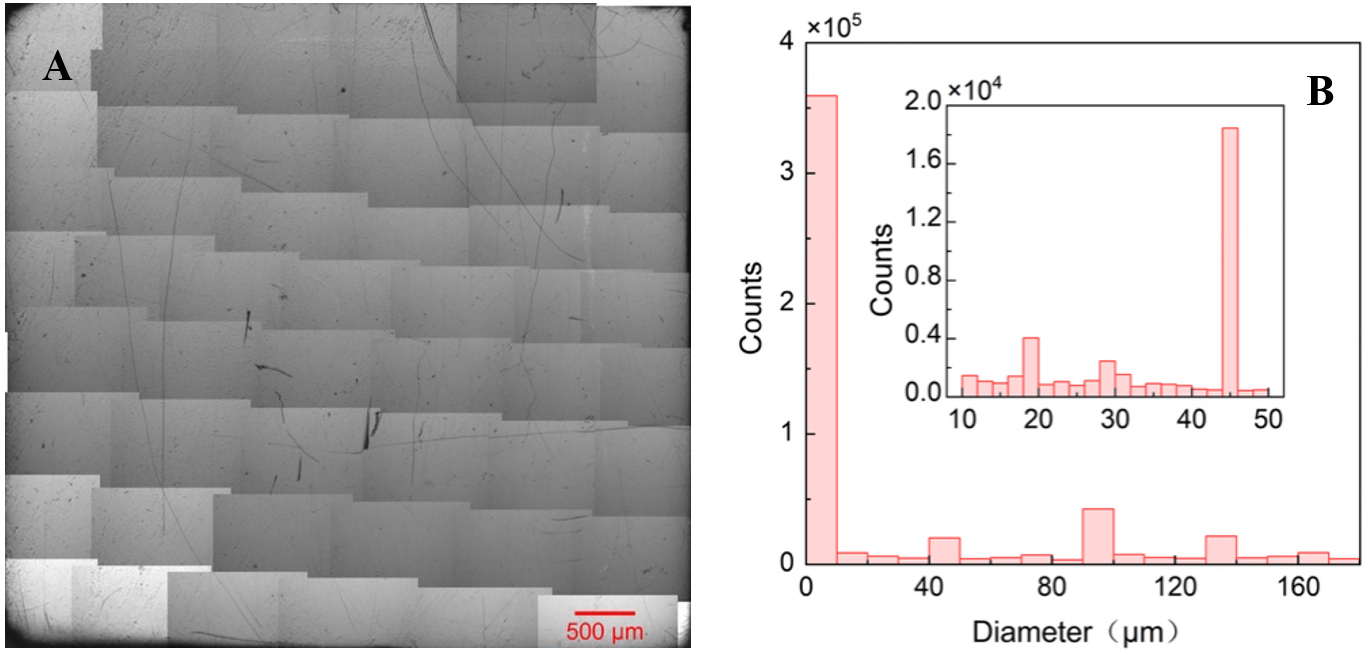
Figure 1. (A) Infrared transmission photographs of the CdTe single crystal, composited from multiple images, showing the distribution of Te inclusions over an area of approximately 5 × 5 mm2. (B) The corresponding dimensional statistics, where the size range of 0-10 µm accounts for the great majority. The inset shows a magnified view of the size distribution in the 10-50 μm range.





