




fig9
From: Residual stress mapping of additively manufactured Inconel 718 via synchrotron X-ray diffraction
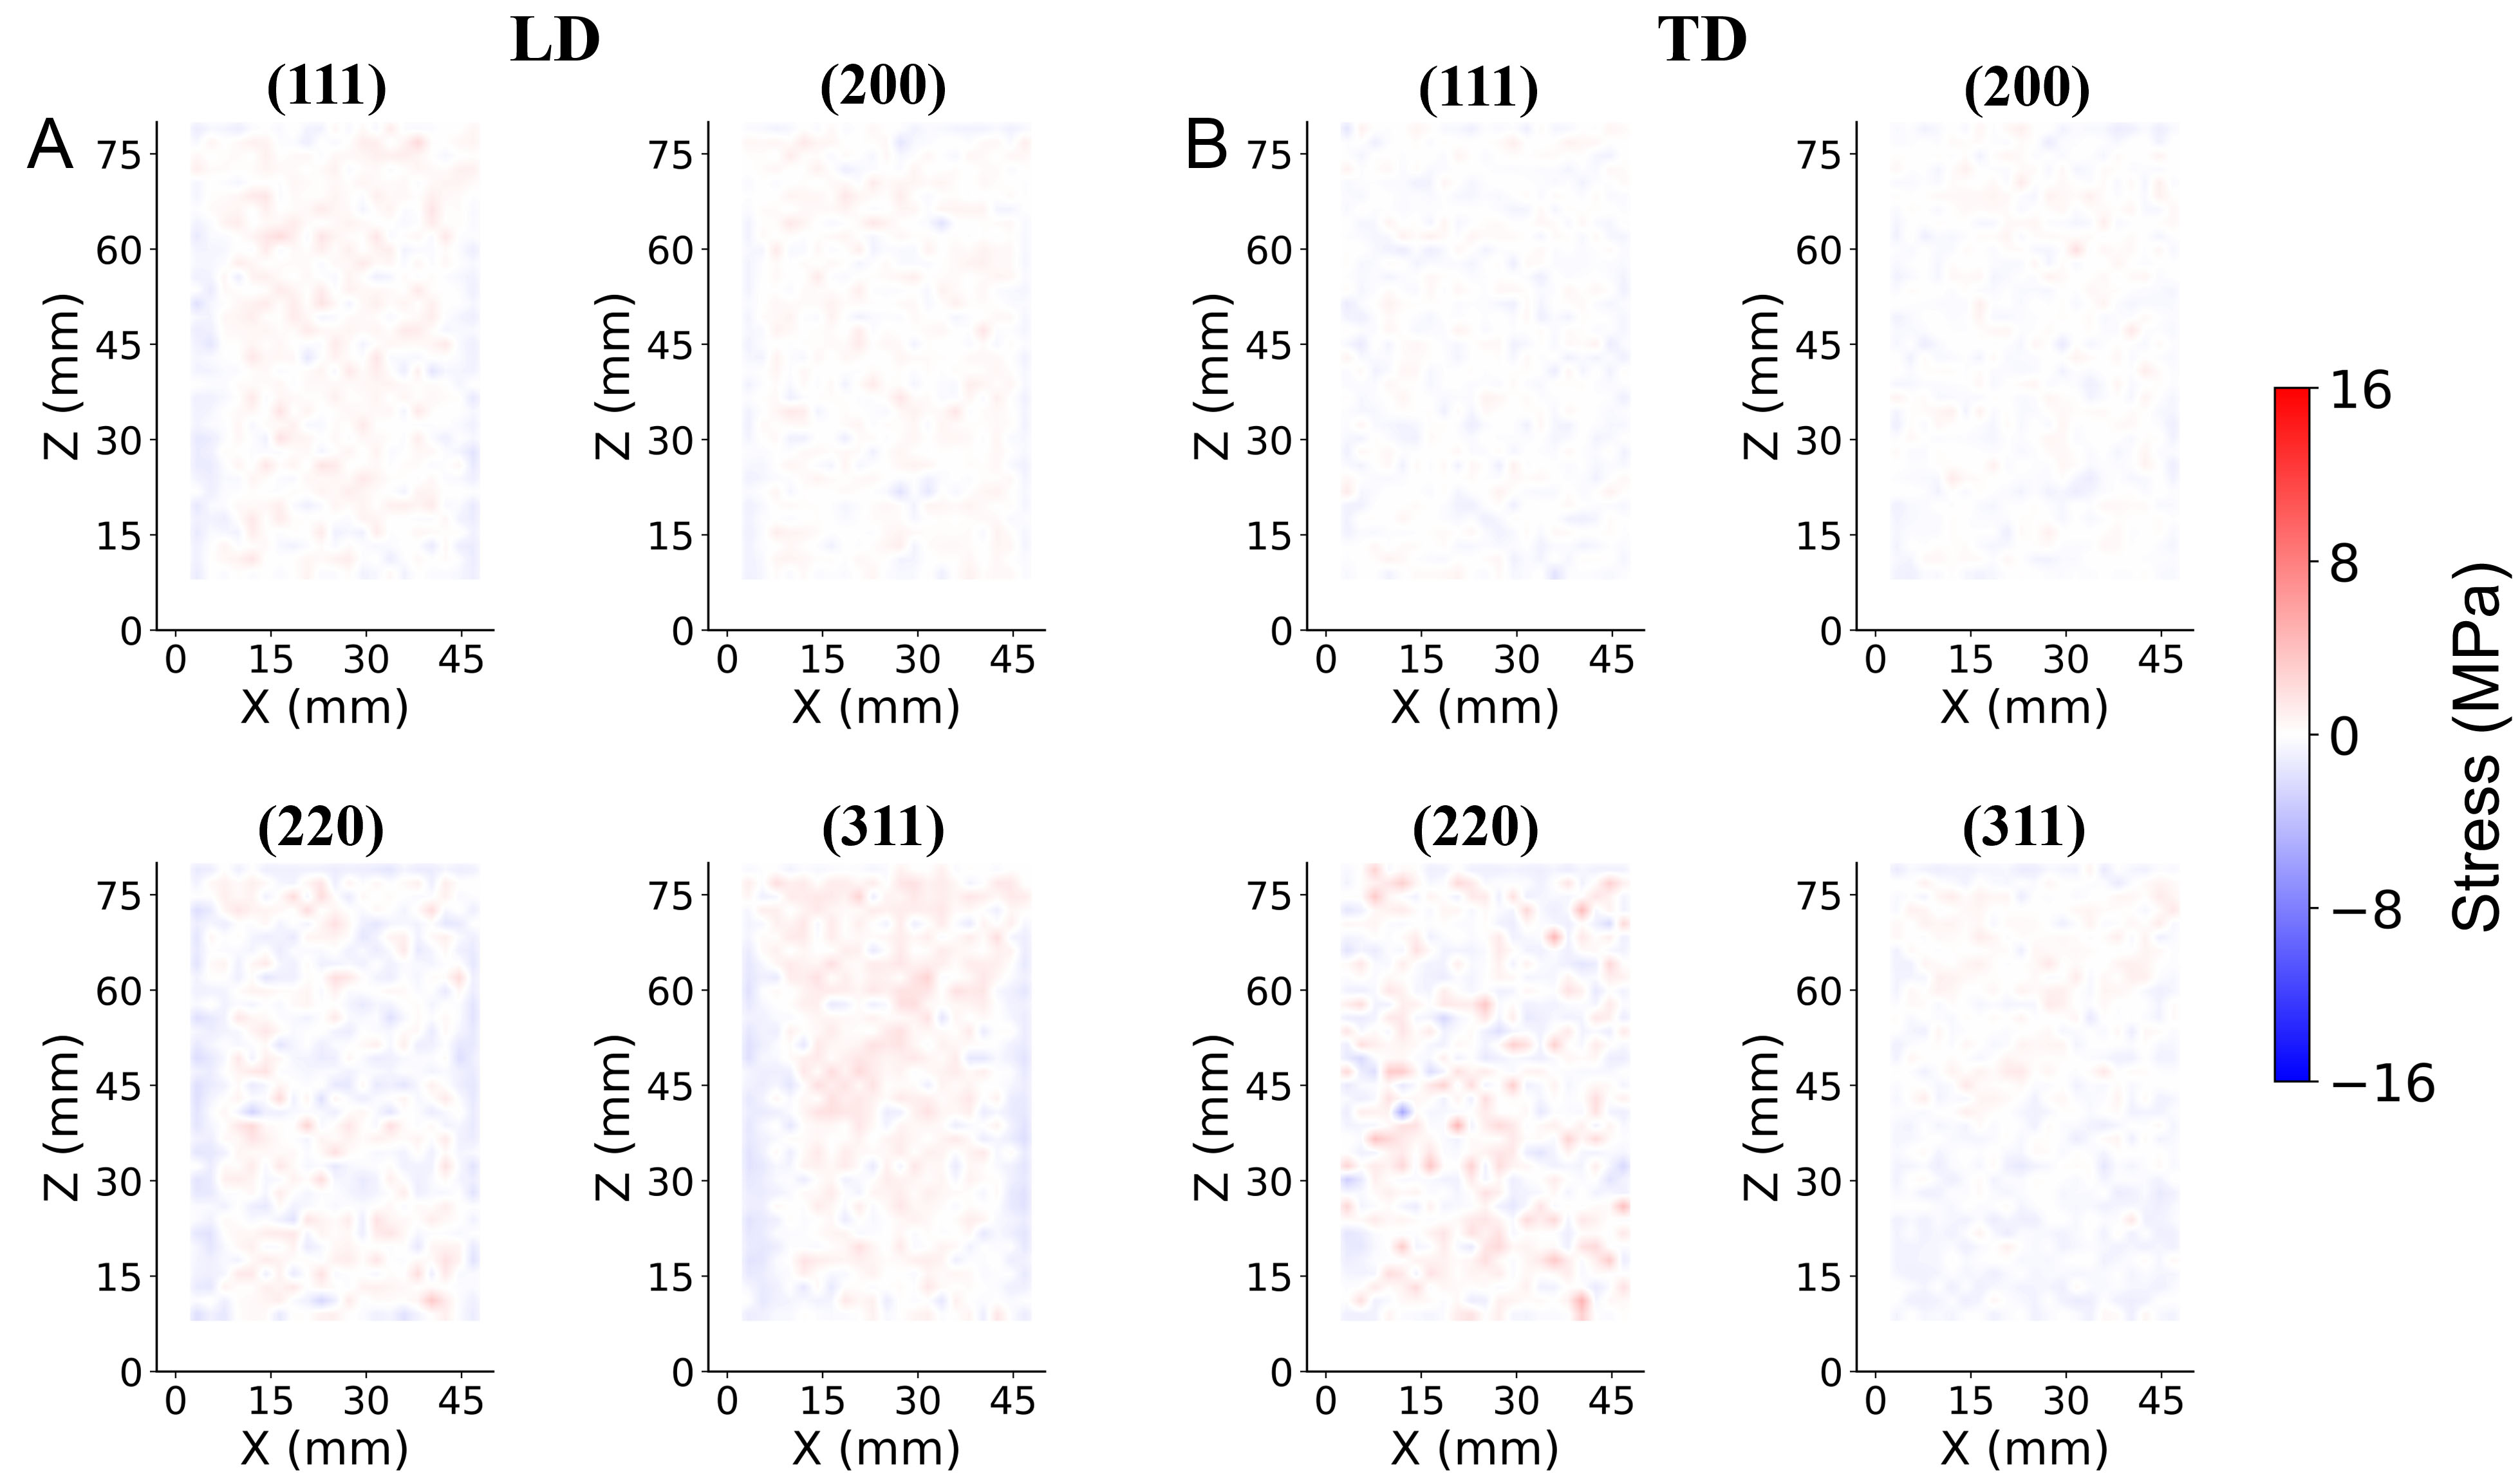
Figure 9. Maps showing the difference between the residual stress maps obtained using Pseudo-Voigt and Pearson VII for fitting X-ray diffraction data from additively manufactured IN718. Results are shown for the (A) LD and (B) TD, respectively. The color scale indicates the difference in values: positive values indicate that the Pseudo-Voigt fit yielded a larger residual stress magnitude than the Pearson VII fit, and negative values indicate the opposite. Each map corresponds to a different crystallographic plane (hkl), as indicated above each panel. LD: Loading direction; TD: transverse direction; IN718: Inconel 718.





