




fig5
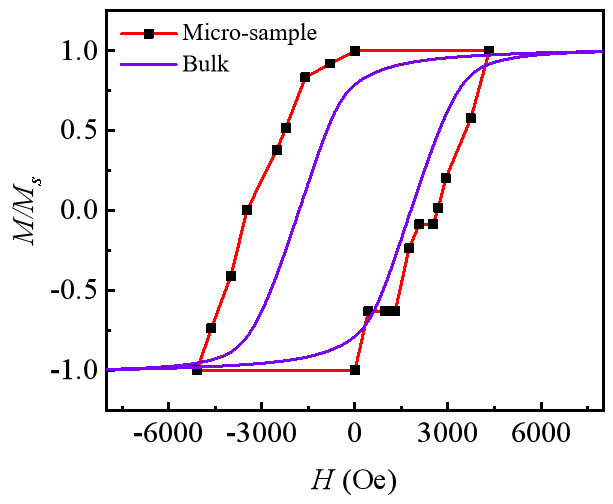
Figure 5. Hysteresis loops of Alnico magnets and those calculated from the in situ magnetization tests. The purple curve represents the bulk alloy; the red curve with square markers corresponds to the micro-sample. Both magnetization values are normalized to the saturation magnetization (M/Ms).





