




fig3
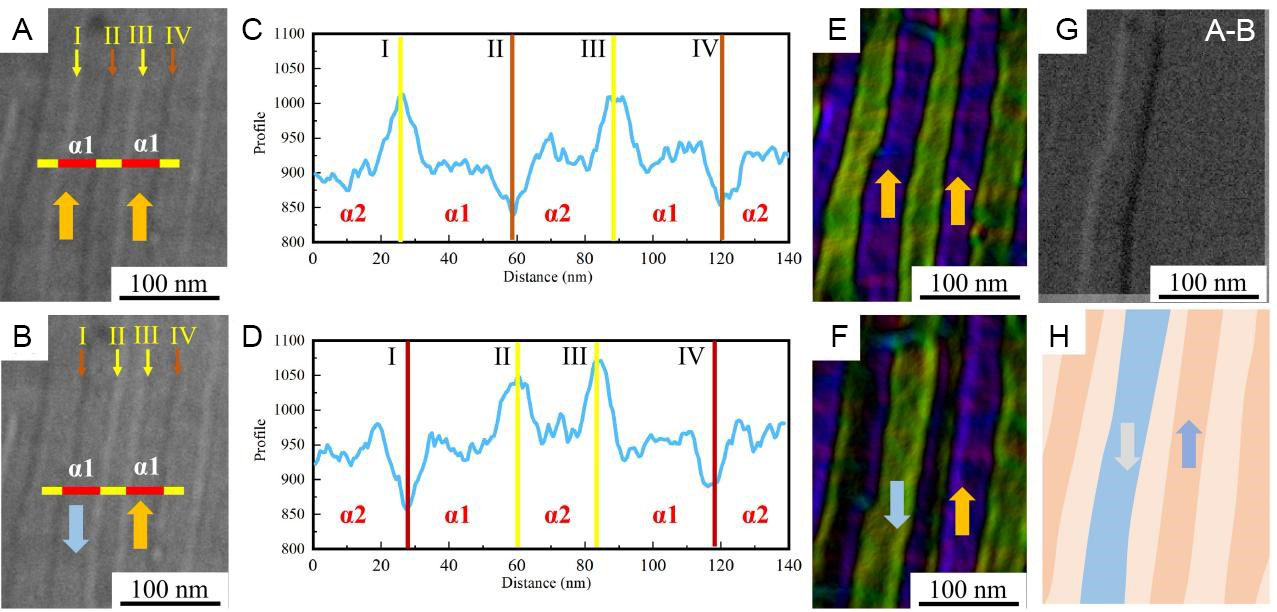
Figure 3. Local Fresnel images, contrast curves, magnetic moment distribution maps, contrast subtraction image, and schematic before and after magnetization reversal: (A) Fresnel image before magnetization reversal; (B) Fresnel image after magnetization reversal; (C) contrast variation curve corresponding to the line in (A); (D) contrast variation curve corresponding to the line in (B); (E) magnetic moment distribution map before magnetization reversal; (F) magnetic moment distribution map after magnetization reversal; (G) contrast subtraction image of (A) and (B); (H) schematic of the magnetization reversal system.





