




fig5
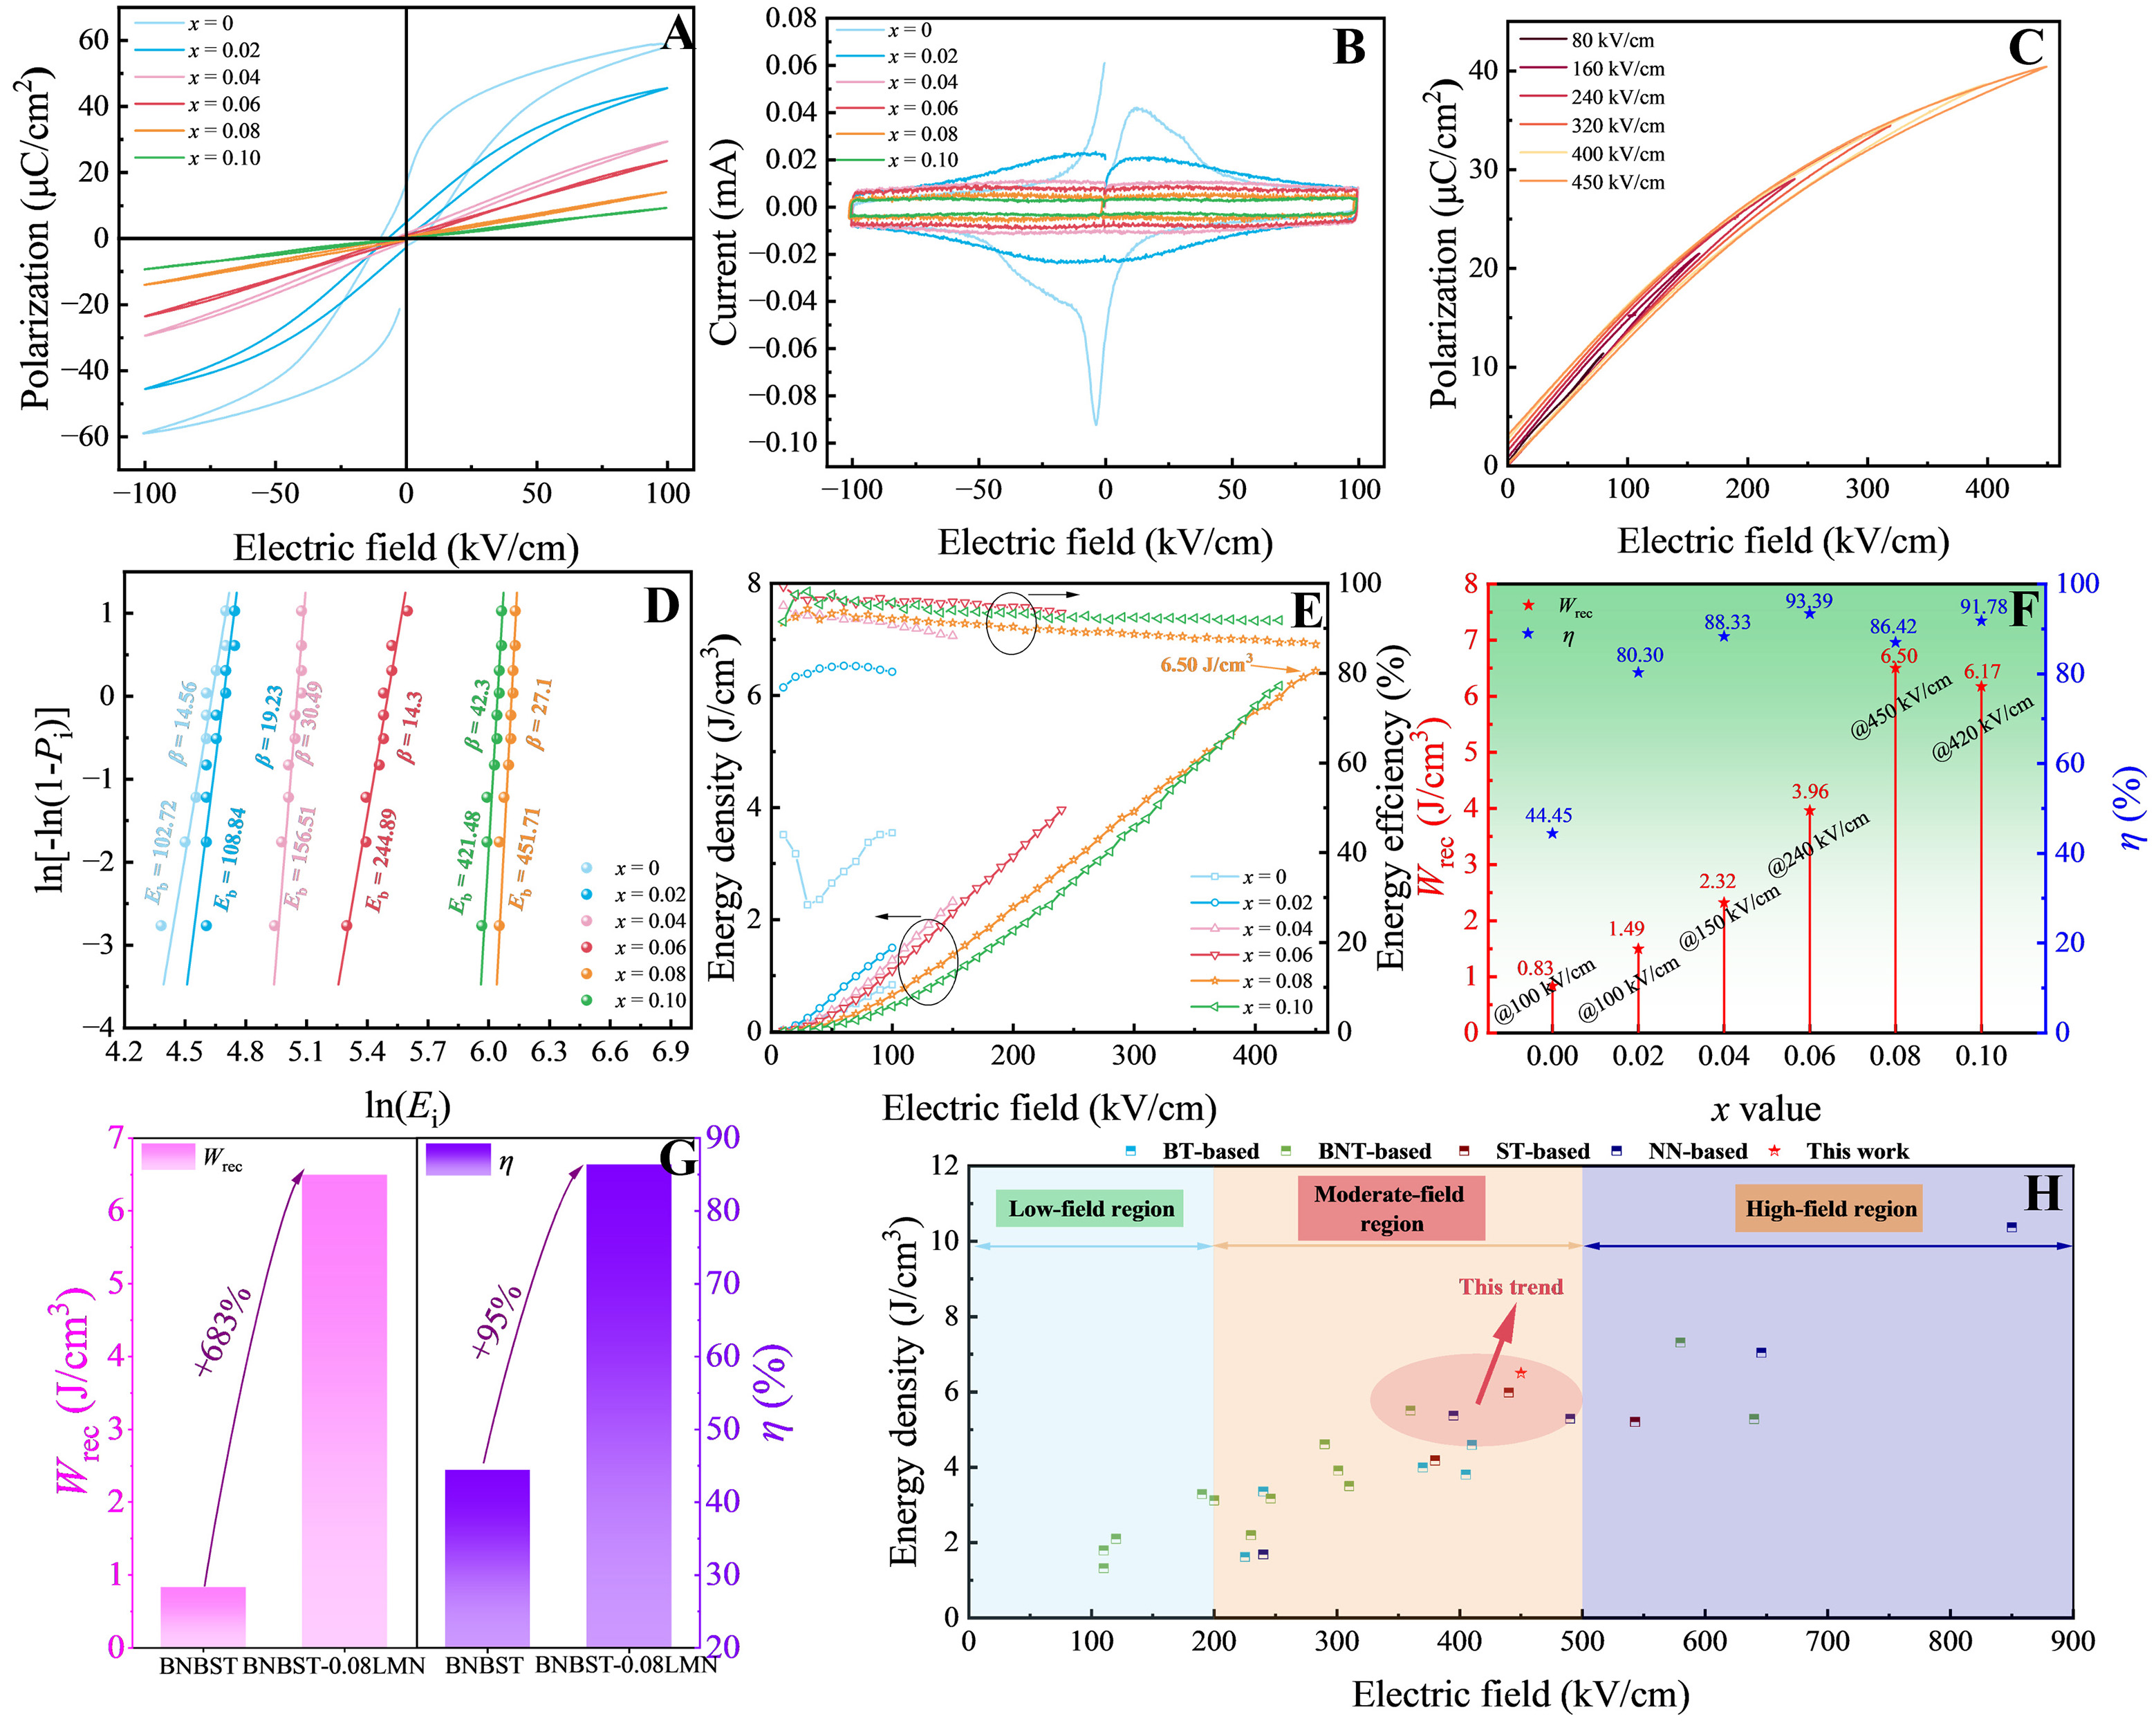
Figure 5. (A) Bipolar P-E loops and (B) corresponding I-E curves at 100 kV/cm for all samples. (C) Unipolar P-E loops for the x = 0.08 ceramic under different electric fields. (D) Weibull distribution of Eb for all samples. (E) Wrec and η for all samples versus the applied electric field. (F) Wrec and η values at the Eb value for each sample. (G) Comparison of Wrec and η between the x = 0 and 0.08 ceramics at their respective Eb values. (H) Wrec-Eb comparison with recently reported lead-free ceramics (references listed in Supplementary Table 1).





