



fig7

Role of Mn in partitioning behavior and precipitation evolution in multicomponent Fe-Cu-based steels
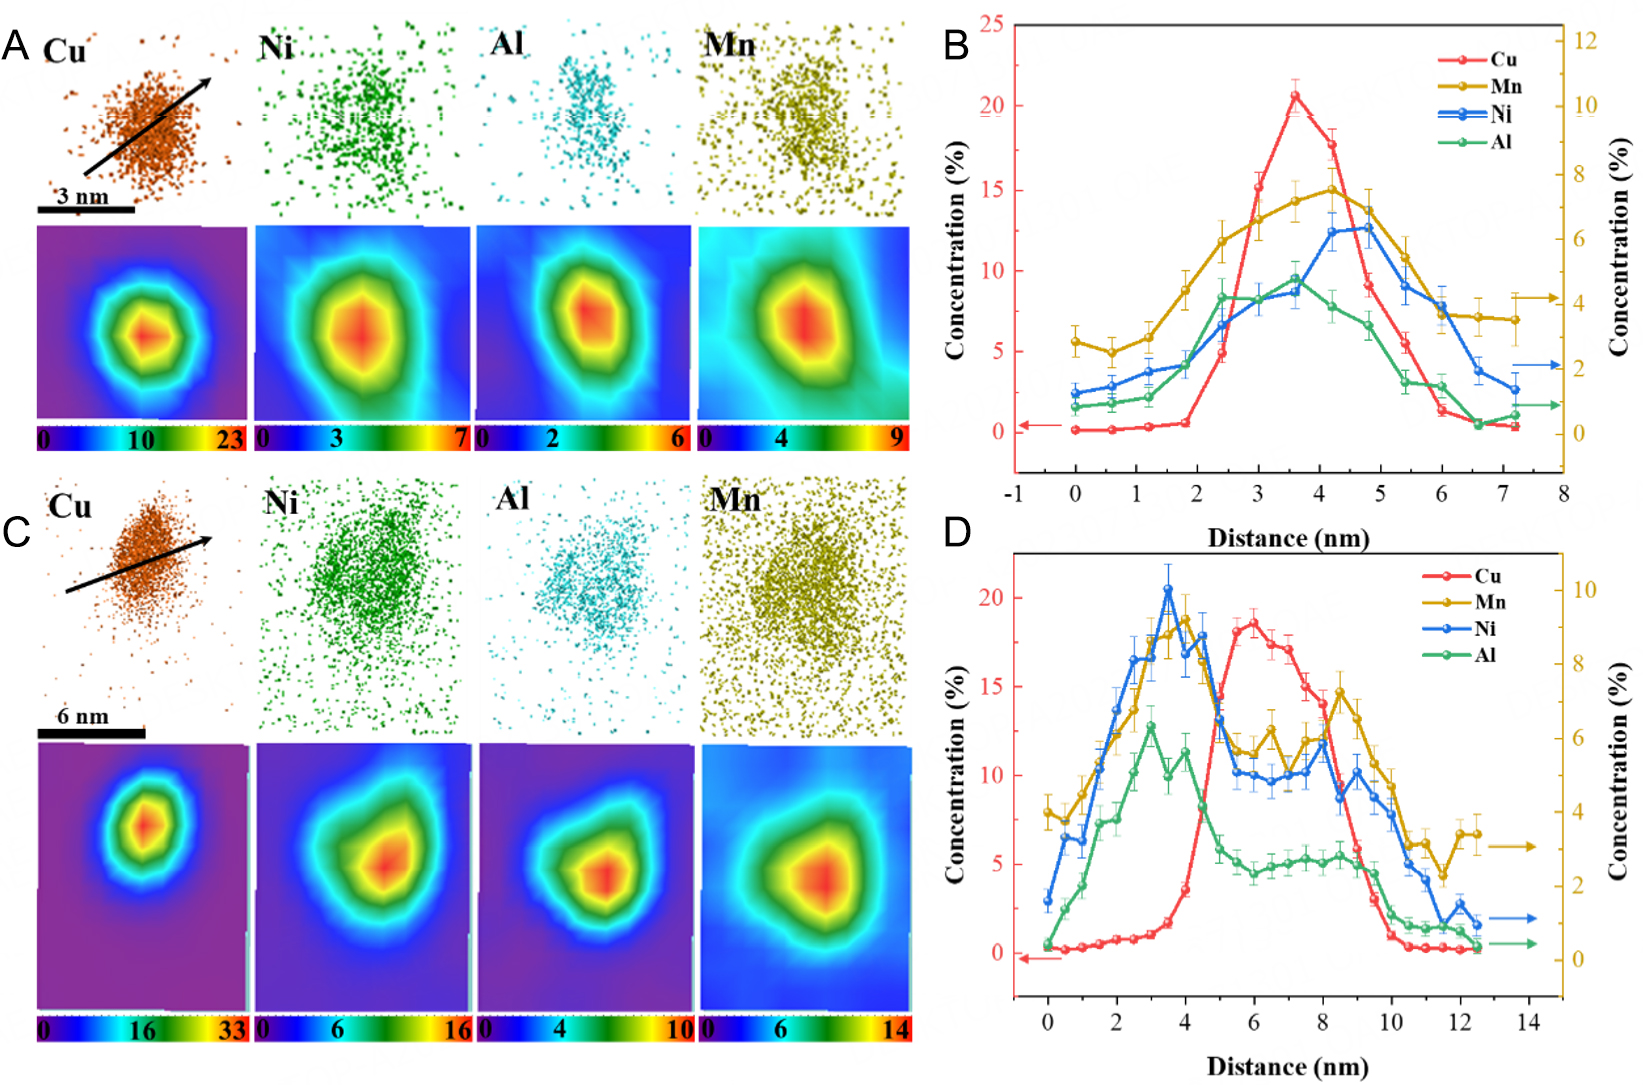
Figure 7. APT atom maps, 2D concentration maps, and 1D concentration profiles of representative Cu precipitates in CuNiAl-4Mn steel aged for (A and B) 20 min and (C and D) 60 min. Error bars represent the counting-statistics standard deviation $$\sigma=\sqrt{c(1-c) / N}$$, where c is the atomic fraction of the element and N is the total number of atoms in each distance bin.

Microstructures
ISSN 2770-2995 (Online)

Portico

All published articles are preserved here permanently:

https://www.portico.org/publishers/oae/

Portico

All published articles are preserved here permanently:

https://www.portico.org/publishers/oae/