




fig2
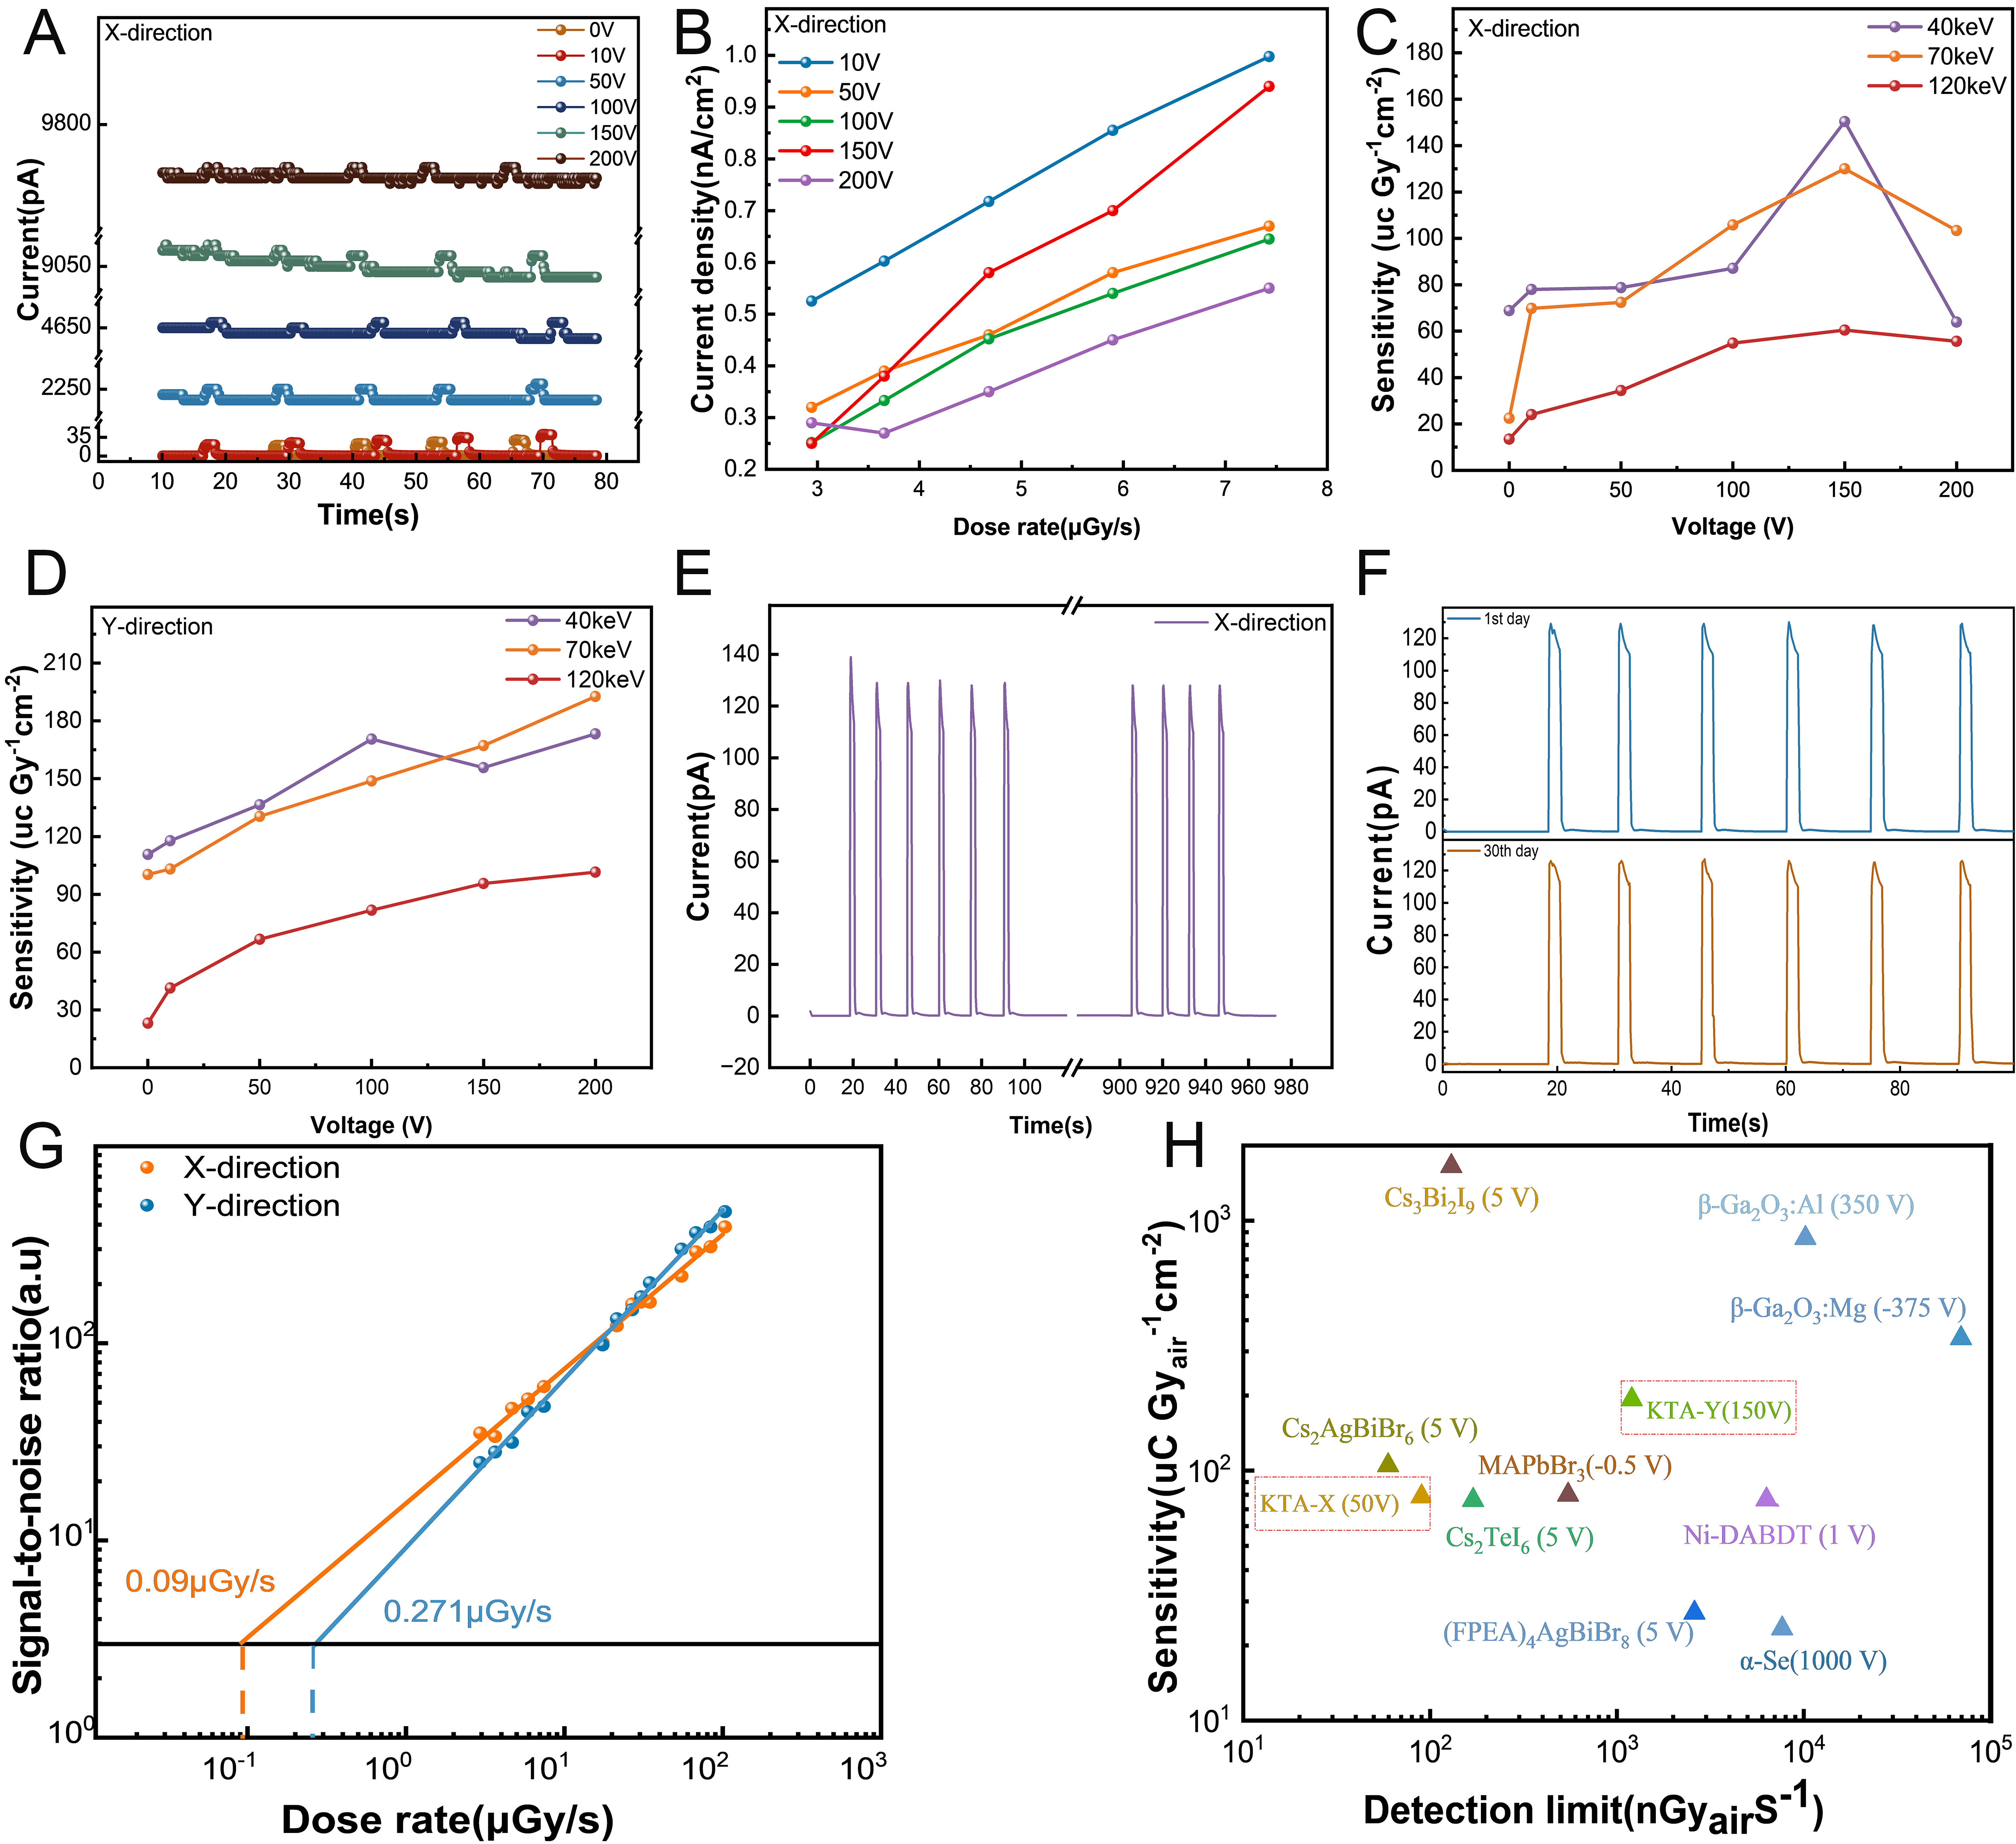
Figure 2. (A) Response of the KTA detector to X-rays at different bias voltages. (B) X-ray photocurrent generated by the KTA detector at different dose rates. (C) Sensitivity of the KTA detector along the X-axis under an applied bias voltage. (D) Sensitivity of the KTA detector along the Y-axis under an applied bias voltage. (E) Stability of the detector after 1,000 s of irradiation. (F) Photocurrent of the detector before and after 30 days of storage at room temperature. (G) Fitted detection limit of the KTA detector at a 50 V bias. (H) Comparison of the performance of KTA and other detector materials under an applied bias[30,32,34-42].