




fig1
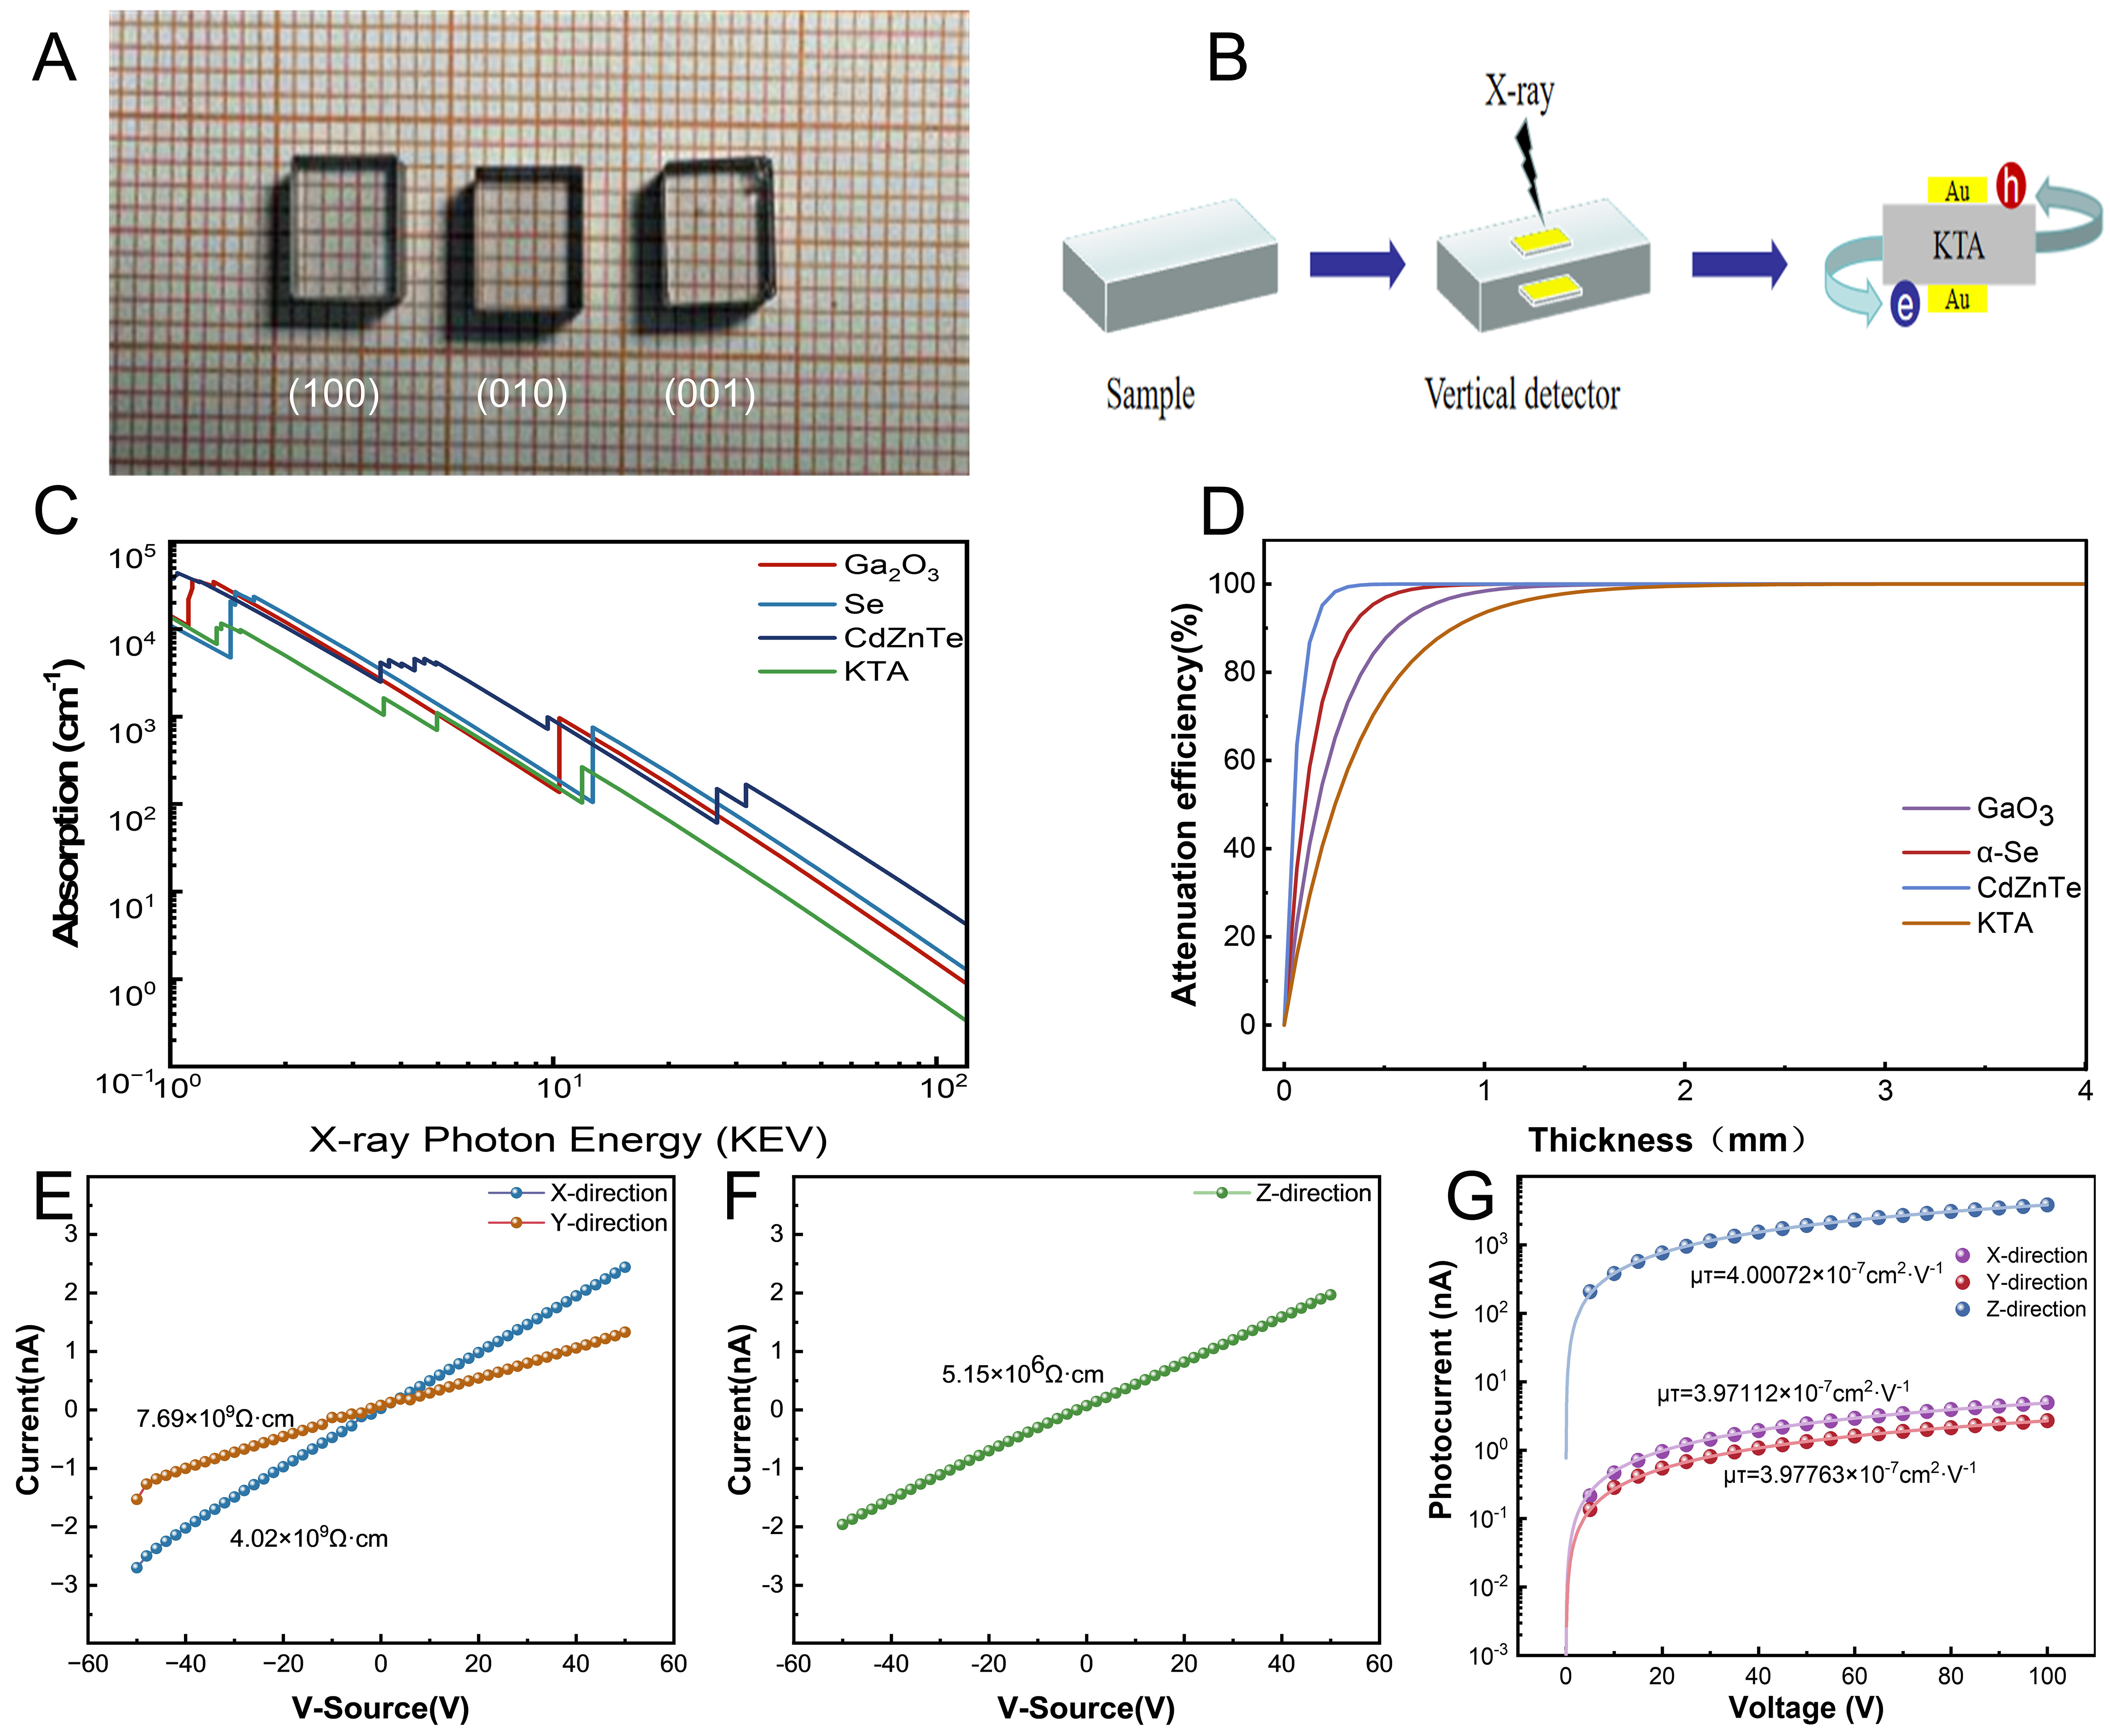
Figure 1. (A) Photograph of the KTA samples (original image by the authors). (B) Schematic of the X-ray detector configuration. (C) Comparison of X-ray absorption coefficients between KTA and other materials[33]. (D) Comparison of X-ray attenuation efficiency between KTA and other materials[33]. (E) Resistivity of the KTA crystal along the X and Y axes. (F) Resistivity of the KTA crystal along the Z axis. (G) Carrier mobility-lifetime product of the KTA crystal along the three principal axes.