


Exploring the oxygen vacancies and electrical properties in pyrochlore-type Ca1.46Ti1.38Nb1.11O7
 0
0 
Abstract
Pyrochlore-type oxides are considered potential oxide-ion conductors due to their high concentration of oxygen vacancies in the unit cell. In this work, the pyrochlore-type Ca1.46Ti1.38Nb1.11O7 was synthesized and its crystal structure was characterized by Rietveld refinement. A high oxygen vacancy concentration in the material was confirmed by thermogravimetry (TG) and X-ray photoelectron spectroscopy (XPS). TG, XPS, and electron paramagnetic resonance collectively demonstrated the change in oxygen vacancy concentration of the material following atmosphere switching. The electrical properties of Ca1.46Ti1.38Nb1.11O7 under different atmospheres were characterized by electrochemical impedance spectroscopy. The conductivity of Ca1.46Ti1.38Nb1.11O7 was
Keywords
INTRODUCTION
Since Nernst's discovery of oxide-ion conduction in Y2O3-ZrO2, the field has advanced significantly, and oxide-ion conductors now play a vital role in daily life and industrial applications[1-4]. Oxide-ion conductors have found extensive applications as catalytic, sensing, and conductive materials under various atmospheres, including oxidizing, reducing, inert, and mixed environments. High-performance oxide-ion conductors are key materials for enabling efficient operation in solid-state electrochemical devices, such as solid oxide fuel cells and oxygen sensors[5].
In addition to the charge carrier (e.g. oxygen vacancies or interstitial oxygen ions) concentration, the local crystalline structure around the charge carrier is a crucial factor for oxide-ion conduction[6]. Most of the conventional oxide-ion conductors are fluorite-type materials, such as yttria-stabilized zirconia (YSZ) and Gd- or Sm-doped CeO2 (GDC or SDC), the structure of which can provide large tolerances for disordered oxygen vacancies[7-10]. The pyrochlore structure is an intricate superstructure derived from the fluorite structure and inherently contains more oxygen vacancies[11]. Pyrochlore-type oxides have attracted high attention for a long time due to their potential applications such as thermal barrier coating materials, solid electrolytes, oxygen pumps, oxygen sensors, catalysts, and so on[12,13].
The typical pyrochlore structure consists of two types of cations, A and B, occupying different lattice sites, where A-site cations are larger and usually have a lower oxidation state, while B-site cations are smaller and have a higher oxidation state[14]. The A-site cations occupy the centers of oxygen octahedra, whereas the B-site cations, typically transition metals, reside within them[14]. Partial substitution of A-site or B-site ions with other metal ions not only disrupts the structural ordering of the pyrochlore lattice but also alters the unit cell size, thereby potentially decreasing the oxide-ion migration distance[15]. The presence of numerous oxygen vacancies in pyrochlore-type oxides is beneficial for oxide-ion conduction, as it provides pathways for ion migration[16]. The pyrochlore structure's coordination environment allows for diverse cationic configurations, supporting multiple oxidation states[17-19]. This structural arrangement, combined with its capability to incorporate a wide range of ions, significantly enhances the physical and chemical stability, making pyrochlore-type oxides suitable for use as oxide-ion conductors[20-26].
Roth et al.[27] reported the pyrochlore-type Ca1.46Ti1.38Nb1.11O7 and investigated its dielectric properties. Bond valence site energy (BVSE) calculations performed with the softBV software[28-30] indicate that the material exhibits a relatively low oxide-ion migration barrier (1.14 eV), suggesting its potential as an oxide-ion conductor. This work aims to investigate the conductive properties of Ca1.46Ti1.38Nb1.11O7 and elucidate its oxide-ion conduction mechanism. In particular, it seeks to clarify the structure-property relationship between oxygen vacancies and conductivity, as well as the formation mechanism of oxygen vacancies. The findings are expected to provide insights for future research on pyrochlore-type oxides.
EXPERIMENTAL PROCEDURE
Material synthesis
Ca1.46Ti1.38Nb1.11O7 was synthesized using a solid-state reaction method. High-purity CaCO3, TiO2 and Nb2O5 powders (≥ 99.9%, Aladdin Biochemical Technology Co., Ltd., China) were used as starting materials, which were dried in an oven (DHG-9075A, Yiheng Scientific Instrument Co., Ltd., China) to remove adsorbed water prior to weighing. The starting materials were ground in anhydrous ethanol (AR, ≥ 99.7%, Sinopharm Chemical Reagent Co., Ltd., China) for approximately 30 min. The mixtures were pressed into pellets and pre-sintered at 1,000 °C for 12 h, and then sintered at 1,350 °C for 8 h. The sintered sample was ground, pressed into pellets, and finally sintered at 1,350 °C for 8 h for densification. All sintering processes were carried out in Ar gas (≥ 99.999%, Dalian Special Gases Co., Ltd., China) using a horizontal tube furnace (GYS-1700C, Hefei Weiyuans Laboratory Equipment Co., Ltd., China).
Material characterization
The X-ray diffraction (XRD) pattern was obtained using a powder diffractometer (X'Pert3 Powder, PANalytical, The Netherlands) with Cu Kα radiation. Rietveld refinement and Maximum Entropy Method (MEM) analysis were carried out using the Z-Rietveld software. BVSE calculations were performed using the softBV program to calculate the oxide-ion migration barriers. Visualization of the results was achieved using VESTA software. The elemental composition of the sample was determined by X-ray fluorescence spectrometry (XRF) using a wavelength-dispersive spectrometer (S8 Tiger, Bruker, Germany). Field emission scanning electron microscopy (SEM) (JSM-7900F, JEOL Ltd., Japan) equipped with energy-dispersive X-ray spectroscopy (EDS) was employed to investigate the morphology of the pellet samples and the elemental distribution of the powder samples. The particle size distribution of the sample was determined using a laser particle size analyzer (BT-9300H, Dandong Bettersize Instruments Co., Ltd., China). For electrochemical impedance spectroscopy measurements, pellets (approximately 10 mm in diameter and 2 mm in thickness) were used. Platinum paste electrodes (55H-1800, Shenzhen Saiya Electronic Paste Co., Ltd., China) were coated on its opposite faces. The sample was then heated at 1,000 °C for 2 h in a horizontal tube furnace (GYS-1700C, Hefei Weiyuans Laboratory Equipment Co., Ltd., China) to form dense platinum electrodes. Electrochemical measurements were performed on an electrochemical workstation (SP-300, Bio-Logic, France; or DH7002A, Donghua Analytical Instrument Co., Ltd., China) using the two-electrode method during the heating process. The sample was heated to temperatures between 500 and 900 °C in either a tubular furnace (JS-G5012-S, Tianjin Jiusuo Technology Development Co., Ltd., China) or a solid oxide fuel cell test station (HBSOC-5B, Zhejiang H2-Bank Energy Technology Co., Ltd., China), followed by electrochemical measurements at each temperature. The process consisted of purging the system with various gases, including pure Ar, pure air, an Ar-H2 mixture, an H2-N2 mixture, and an N2-O2 mixture. All gases (including the component gases in the mixtures) were of high purity (≥ 99.999%) and supplied by Dalian Special Gases Co., Ltd., China. The impedance was measured over a frequency range of 7 MHz to
RESULTS AND DISCUSSION
Structural and morphological characterization
After the first sintering at 1,350 °C, the room-temperature XRD pattern of Ca1.46Ti1.38Nb1.11O7 confirmed the formation of the target phase, along with a small amount of TiO2 as an impurity. This suggests that sintering temperatures below 1,350 °C may result in higher impurity levels due to incomplete reaction. To eliminate the TiO2 impurity and achieve densification, the material was subjected to a second sintering at 1,350 °C for
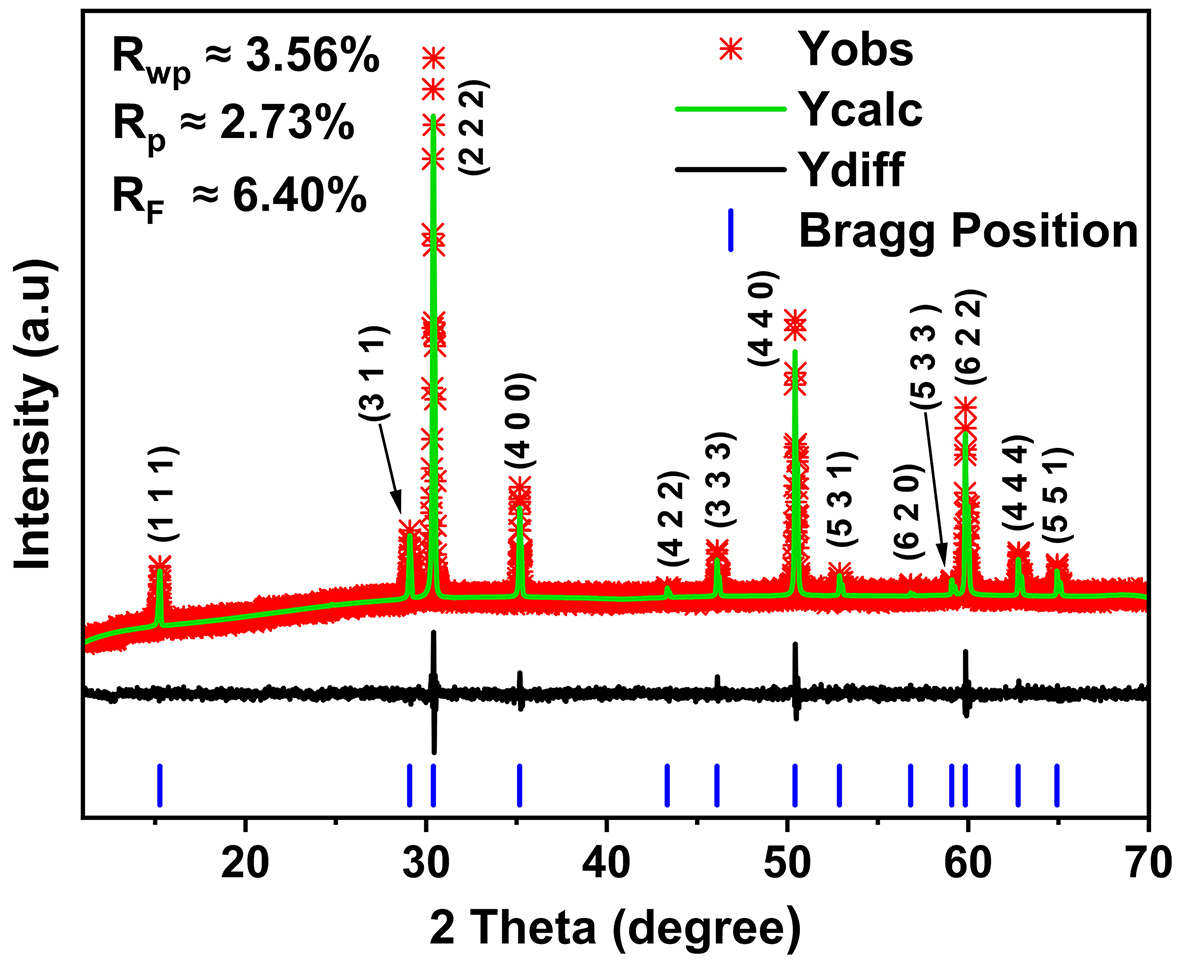
Figure 1. Refined XRD pattern of Ca1.46Ti1.38Nb1.11O7 obtained at 700 °C .
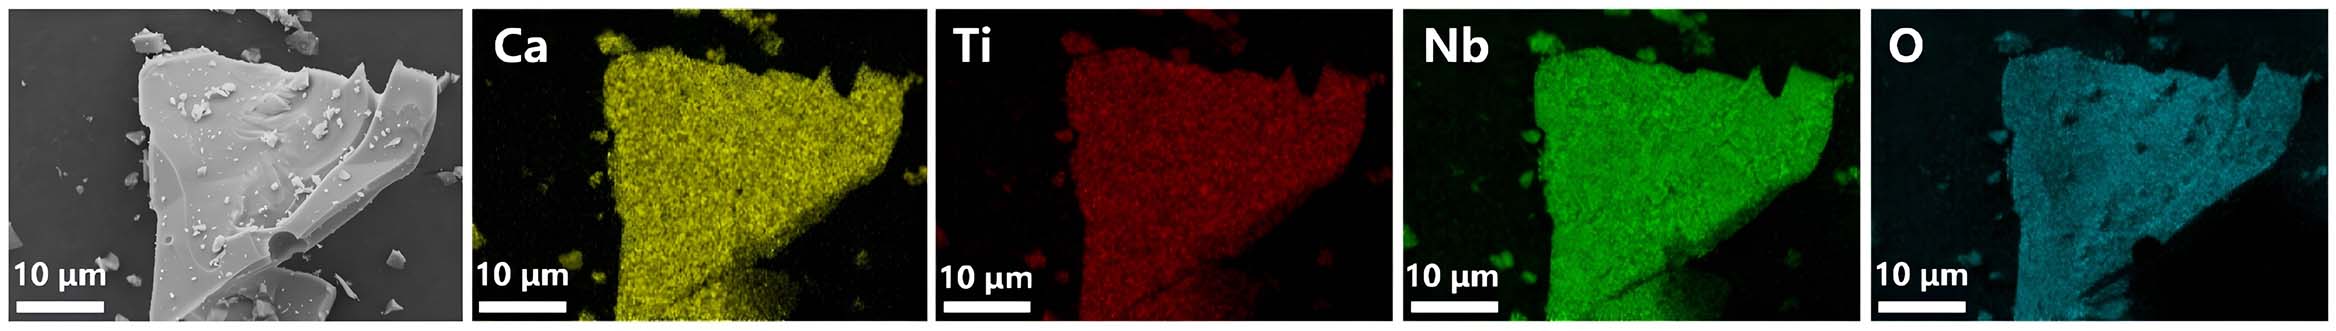
Figure 2. SEM image and corresponding elemental distribution maps of Ca1.46Ti1.38Nb1.11O7 powder.
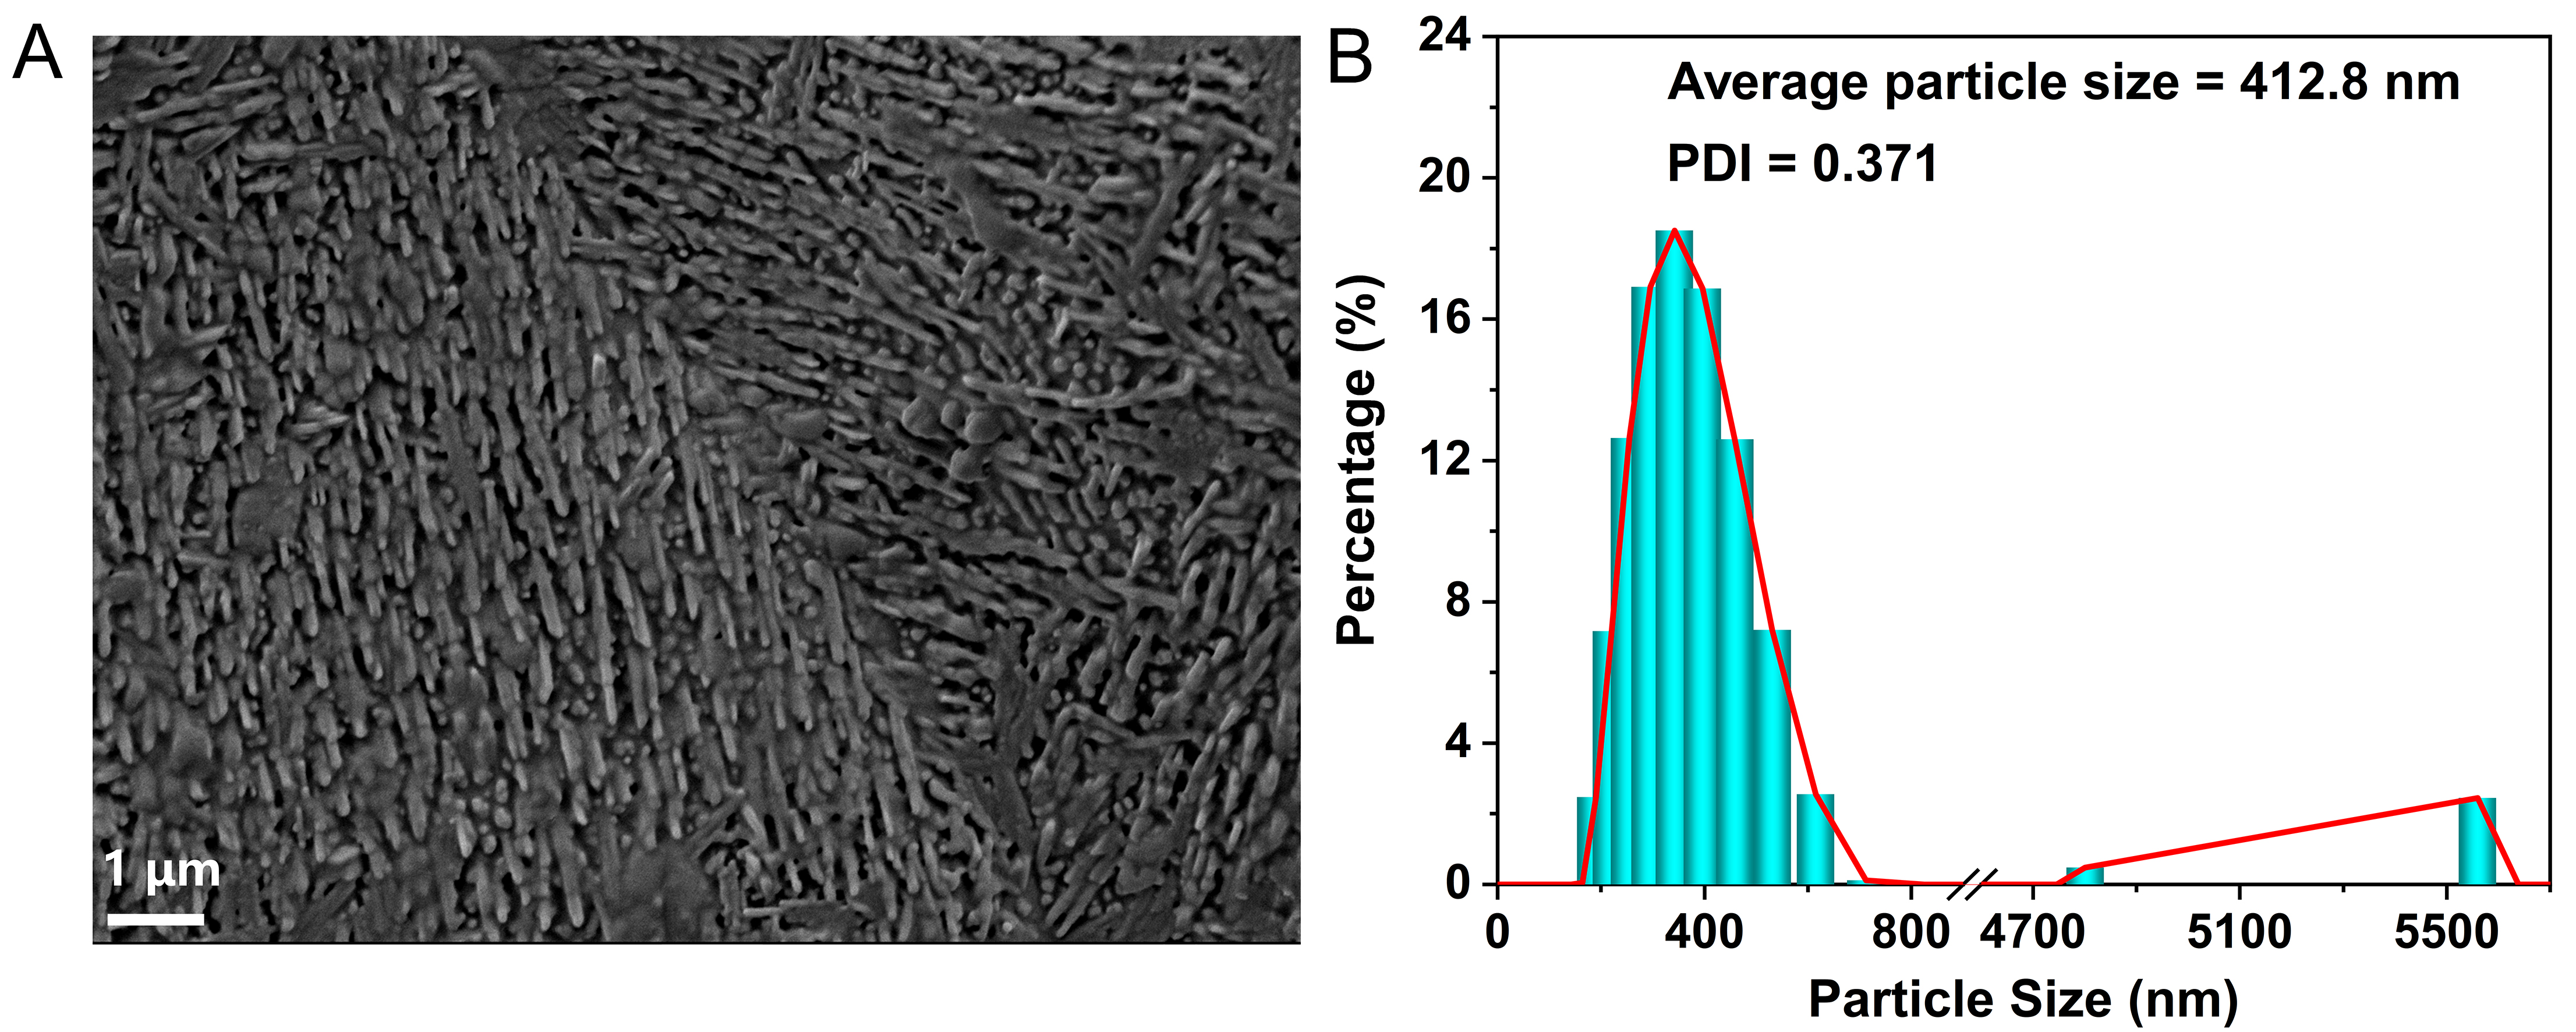
Figure 3. (A) Cross-sectional SEM image of the Ca1.46Ti1.38Nb1.11O7 pellet; (B) Particle size distribution of Ca1.46Ti1.38Nb1.11O7 measured by laser diffraction.
The final refined structural parameters for the sample Ca1.46Ti1.38Nb1.11O7 from XRD data at 700 °C: a = b = c = 10.302 Å
| Atoms | Site | x | y | z | Occupancy | U (Å2) | |||||
| Nb | 16c | 0.0000 | 0.0000 | 0.0000 | 0.5550 | 0.0124 | |||||
| Ti1 | 16c | 0.0000 | 0.0000 | 0.0000 | 0.4450 | 0.0129 | |||||
| Ca | 16d | 0.5000 | 0.5000 | 0.5000 | 0.7300 | 0.0160 | |||||
| Ti2 | 96g | 0.4681 | 0.4681 | 0.5595 | 0.0408 | 0.0059 | |||||
| U 11 (Å2) | U 22 (Å2) | U 33 (Å2) | U 12 (Å2) | U 13 (Å2) | U 23 (Å2) | ||||||
| O1 | 48f | 0.3229 | 0.1250 | 0.1250 | 0.9774 | 0.0720 | 0.0020 | 0.0020 | 0.0000 | 0.0000 | 0.0010 |
| O2 | 32e | 0.4013 | 0.4013 | 0.4013 | 0.2254 | 0.0250 | 0.0250 | 0.0250 | 0.0097 | 0.0097 | 0.0097 |
Electrical properties
Conductivity measurements were first performed in Ar to both prevent oxidation of the material and to assess its electrical response following sintering in Ar. Electrochemical impedance spectroscopy was used to characterize the electrical properties of Ca1.46Ti1.38Nb1.11O7. The resistance in the high frequency range represents the grain resistance, the resistance in the mid-frequency range corresponds to the grain-boundary resistance, and the resistance in the low-frequency range can be due to the polarization effect of the electrodes. The impedance plots [Figure 4A-C] exhibit a single, nearly symmetric semicircular arc, which arises from overlapping grain and grain-boundary responses and can be modeled using an equivalent circuit with a single RC (resistance-capacitance) element. The total conductivity (σb+gb, representing the sum of bulk and grain-boundary contributions) of Ca1.46Ti1.38Nb1.11O7 is presented in the Arrhenius plot in Figure 4D. These values were derived from the impedance spectra measured in Ar, 5% H2/Ar, and air atmospheres over the temperature range of 500-900 °C. The conductivity (σ) was calculated from the resistance using Equation (1)[32],
where R, l, and A represent the resistance, the spacing between the probes, and the cross-sectional area of the sample, respectively.
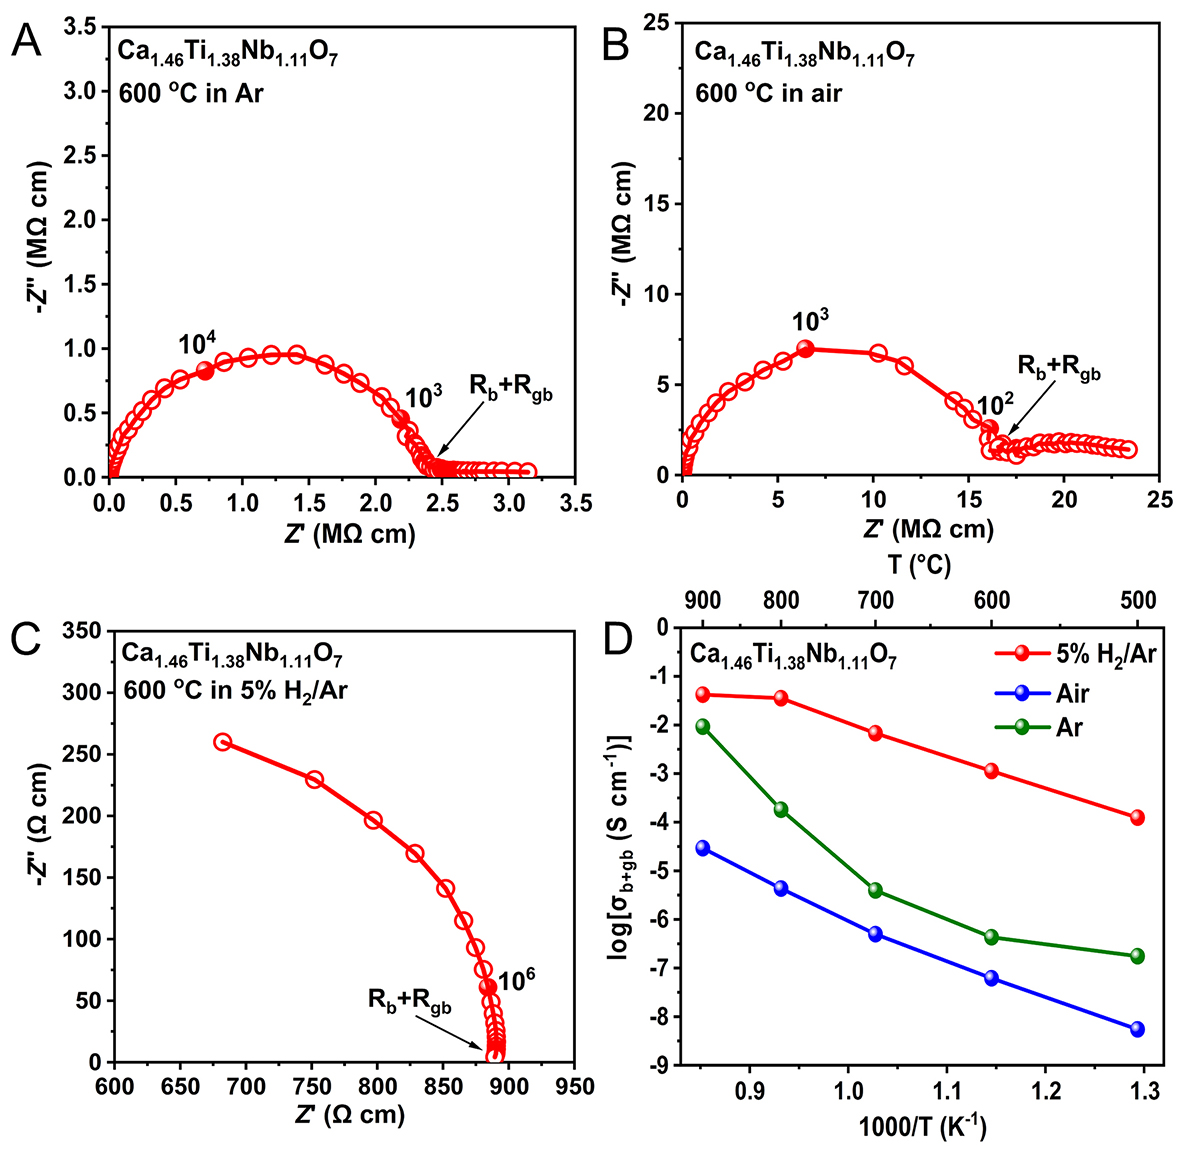
Figure 4. (A) The complex impedance plot obtained at
σb+gb of Ca1.46Ti1.38Nb1.11O7 increases gradually with increasing temperature from 500 to 900 °C, indicating a thermally activated ionic diffusion process. The conductivity of the sample varies approximately linearly with temperature in air. The temperature dependence of the conductivity in air can be described by Equation (2)[33],
where σ, T, σ0, E, and kB are the conductivity, absolute temperature, pre-exponential factor, activation energy, and Boltzmann constant, respectively.
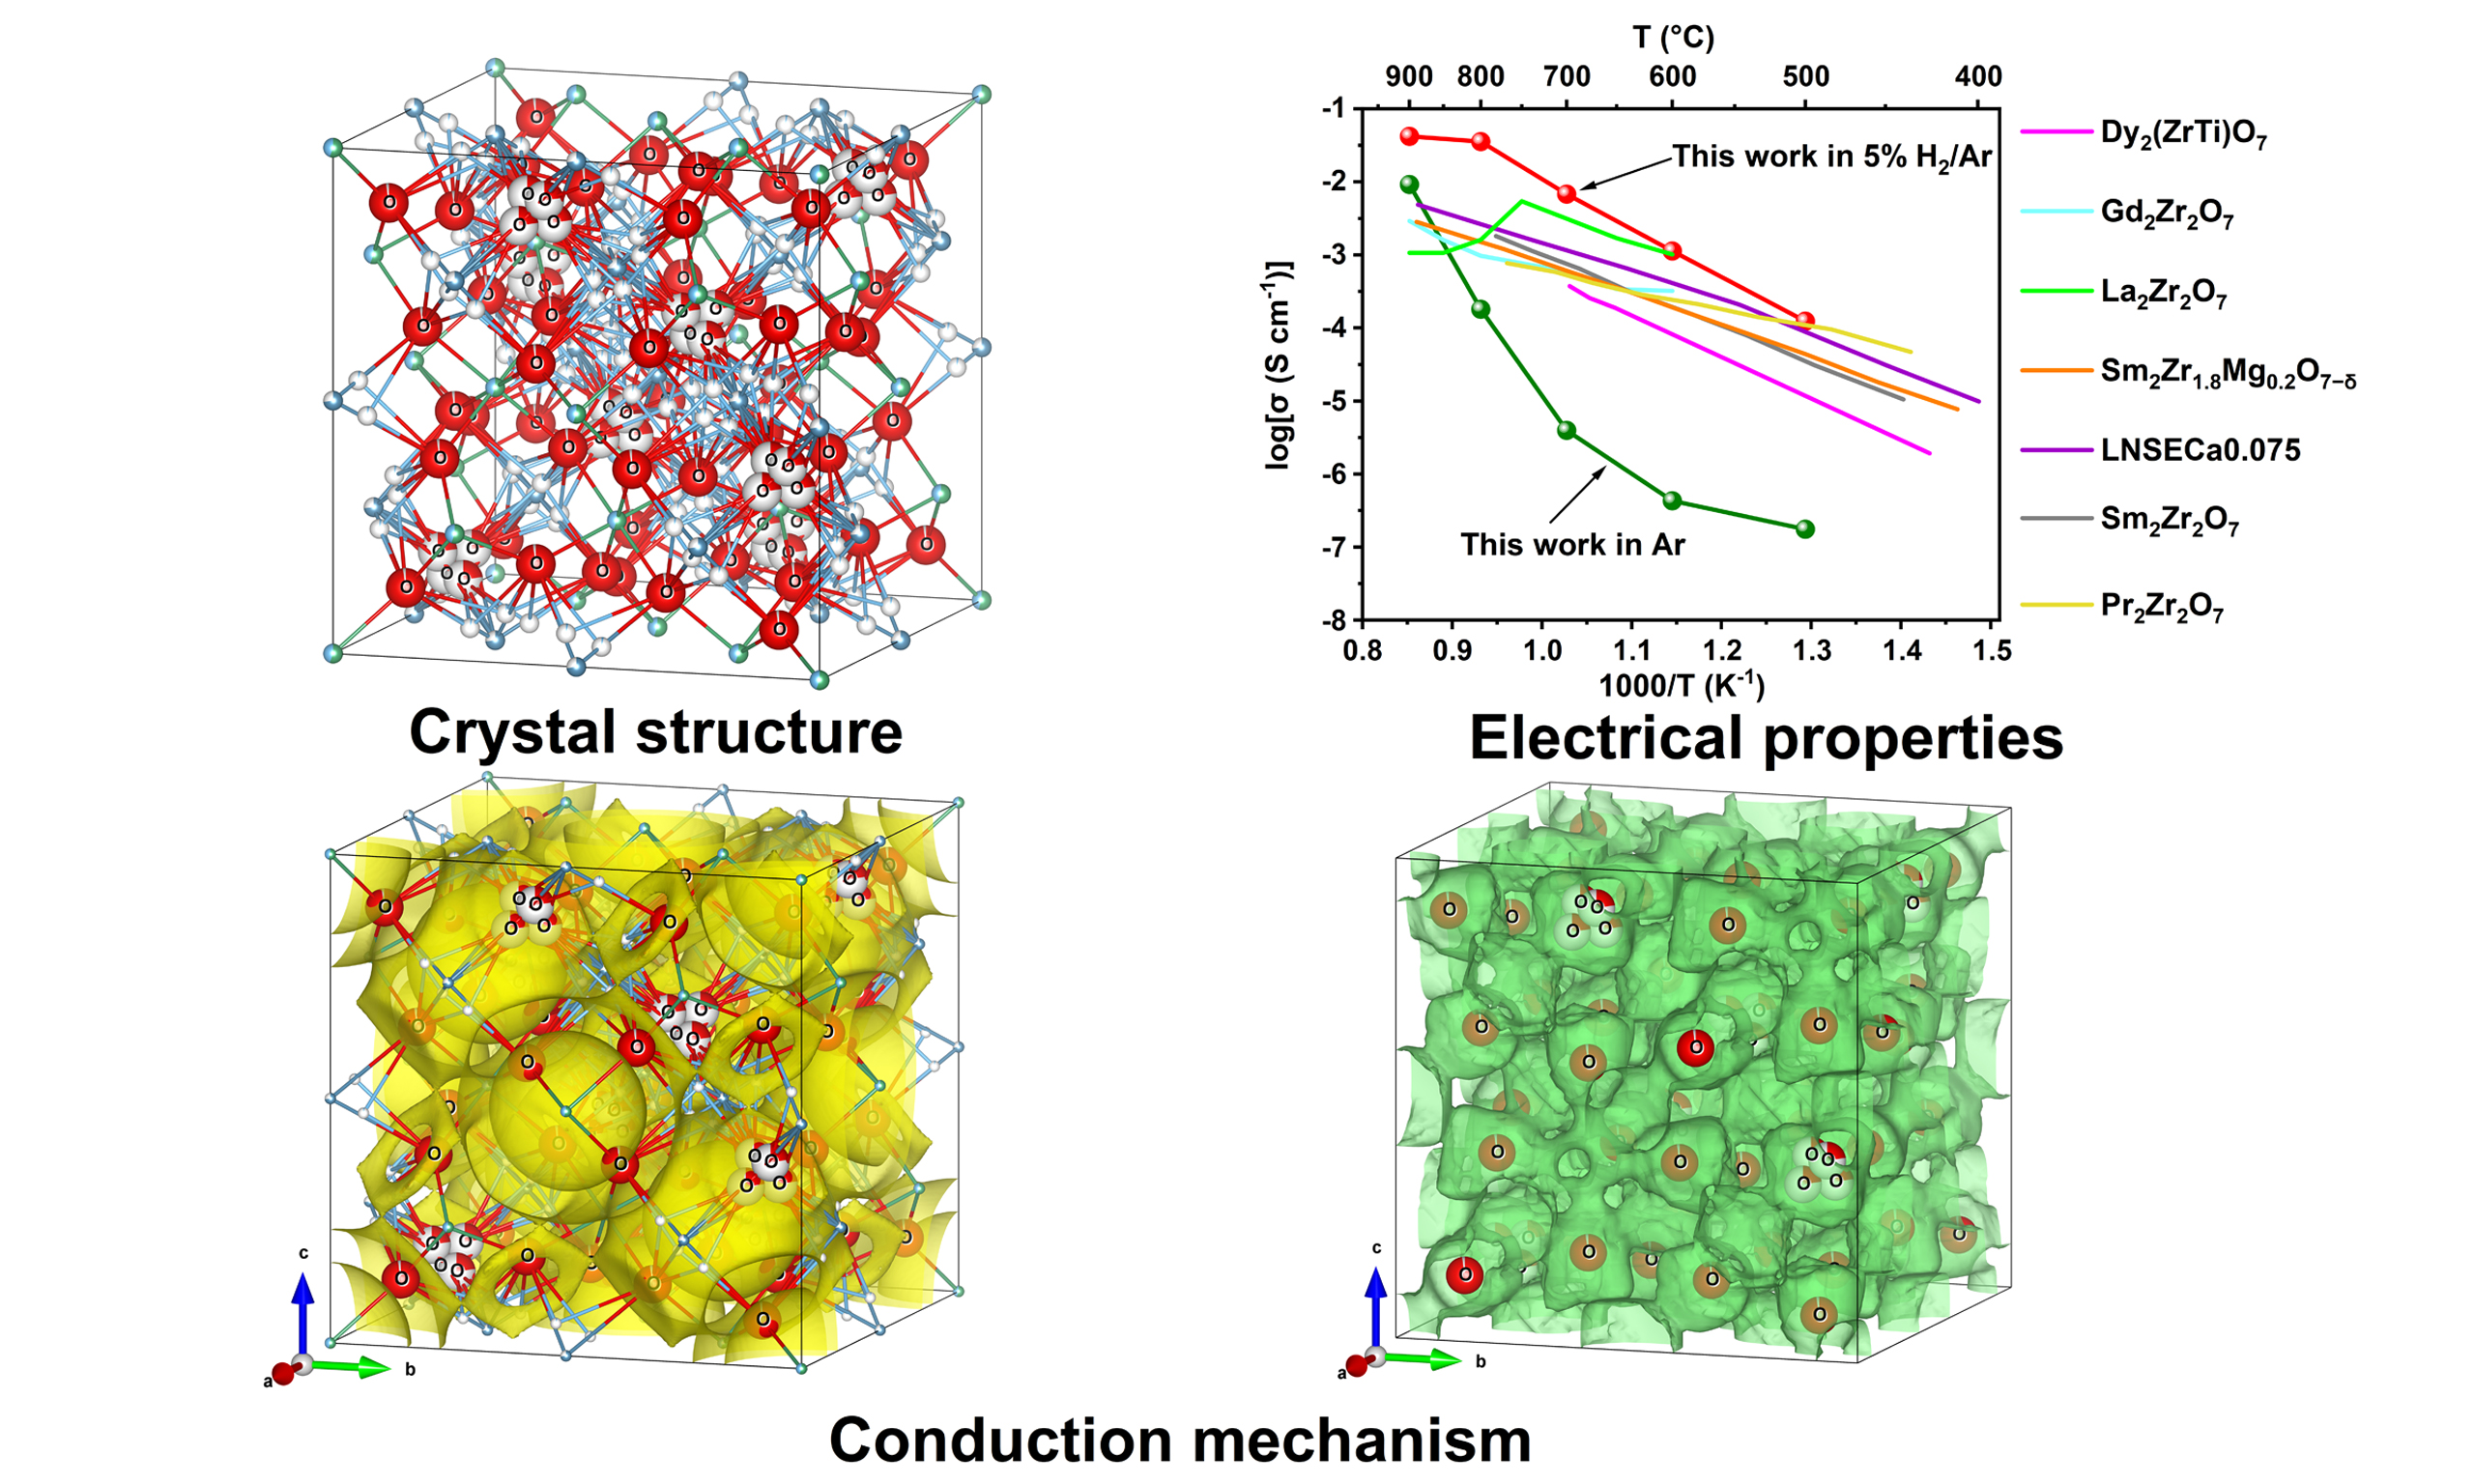
Across the entire temperature range, the conductivity follows the order: 5% H2/Ar > Ar > air, indicating that the material exhibits n-type conduction. The conductivity of Ca1.46Ti1.38Nb1.11O7 was 4.20 × 10⁻² S cm-1 in 5% H2/Ar, 9.22 × 10⁻³ S cm-1 in Ar and 2.92 × 10⁻⁵ S cm-1 in air at 900 °C. Figure 5 demonstrates that the change in conductivity upon gas switching is reversible. This sensitive and reversible conductivity response to different atmospheres suggests that the material is a promising candidate for gas sensor applications. The DC conductivity σDC of Ca1.46Ti1.38Nb1.11O7 as a function of oxygen partial pressure (pO2) is shown in Figure 6A. At 900 °C, σDC decreases with increasing pO2, which is consistent with n-type conduction. σDC changes little with the oxygen partial pressure in the range of 1.0 × 10⁻⁵ to 1.0 atm at 500 °C, indicating that the conductivity is primarily ionic at this temperature. Negligible proton conduction is observed because there is little difference in σDC of Ca1.46Ti1.38Nb1.11O7 under wet and dry air flows [Figure 6B]. Electromotive force (EMF) measurements were conducted to determine the ion transport number (tion) of the material under different atmospheres [Figure 7]. Using an air|N2 gas concentration cell, the tion value is 0.995 at 500 °C, indicating that the material is an almost pure oxide-ion conductor at this temperature. The tion values in the entire temperature range are above 0.8, suggesting that oxide-ion conduction is dominant in oxidizing (air, O2) and inert (Ar, N2) atmospheres. In contrast, EMF measurements using an air|5% H2/N2 gas concentration cell revealed a drastically different behavior. The tion values are below 0.25 in the whole temperature range, indicating that the material exhibits predominantly electronic conduction under a reducing atmosphere (e.g., 5% H2/N2, 5% H2/Ar). Figure 8 presents a comparison of the conductivity of Ca1.46Ti1.38Nb1.11O7 with that of recently reported pyrochlores. Compared with these pyrochlores, the conductivity of Ca1.46Ti1.38Nb1.11O7 is lower in air, comparable in Ar, and significantly higher in 5% H2/Ar. σDC remains stable over 27 h
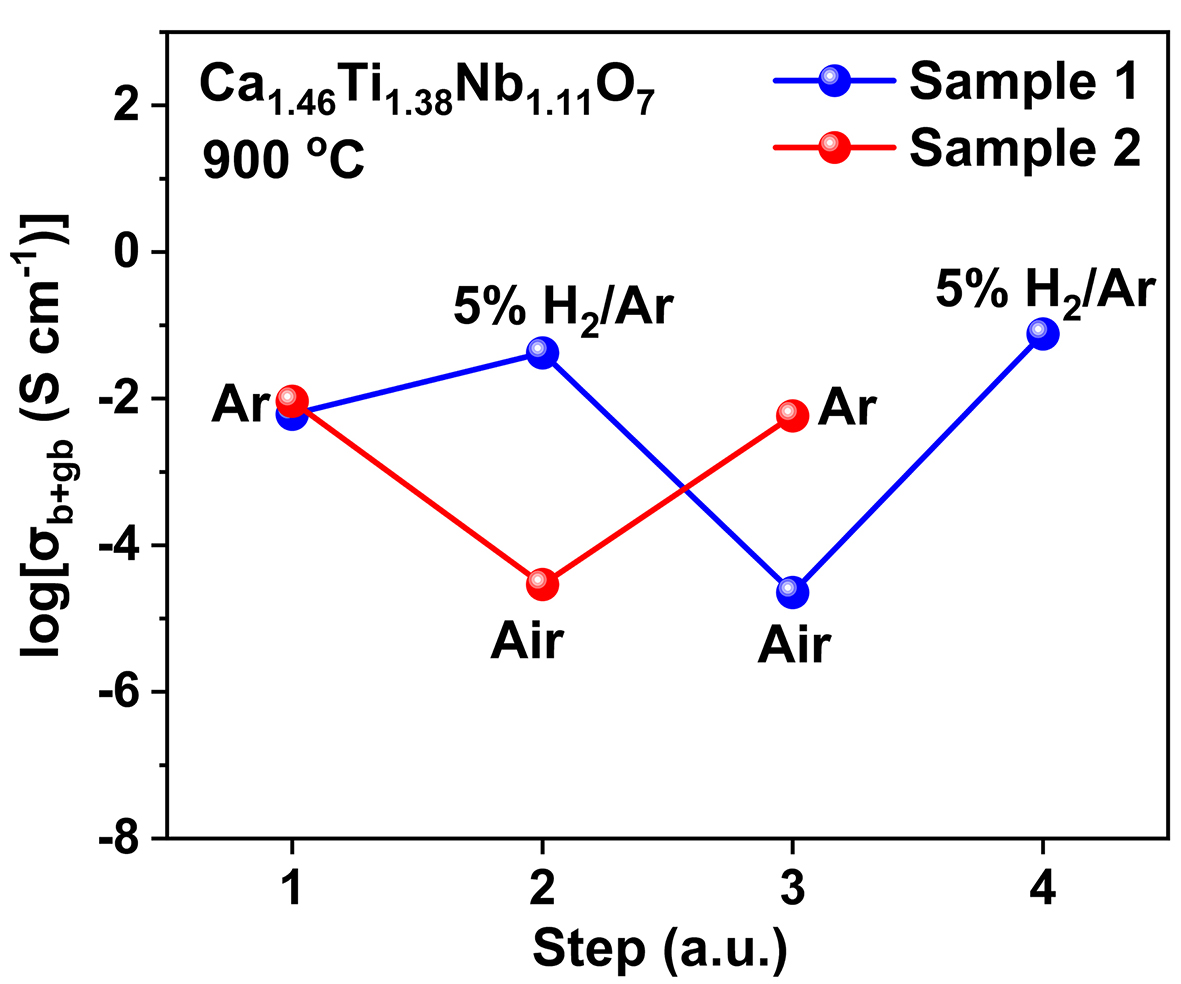
Figure 5. Reversibility of the conductivity of Ca1.46Ti1.38Nb1.11O7 upon switching between 5% H2/Ar, air and Ar at 900 °C.
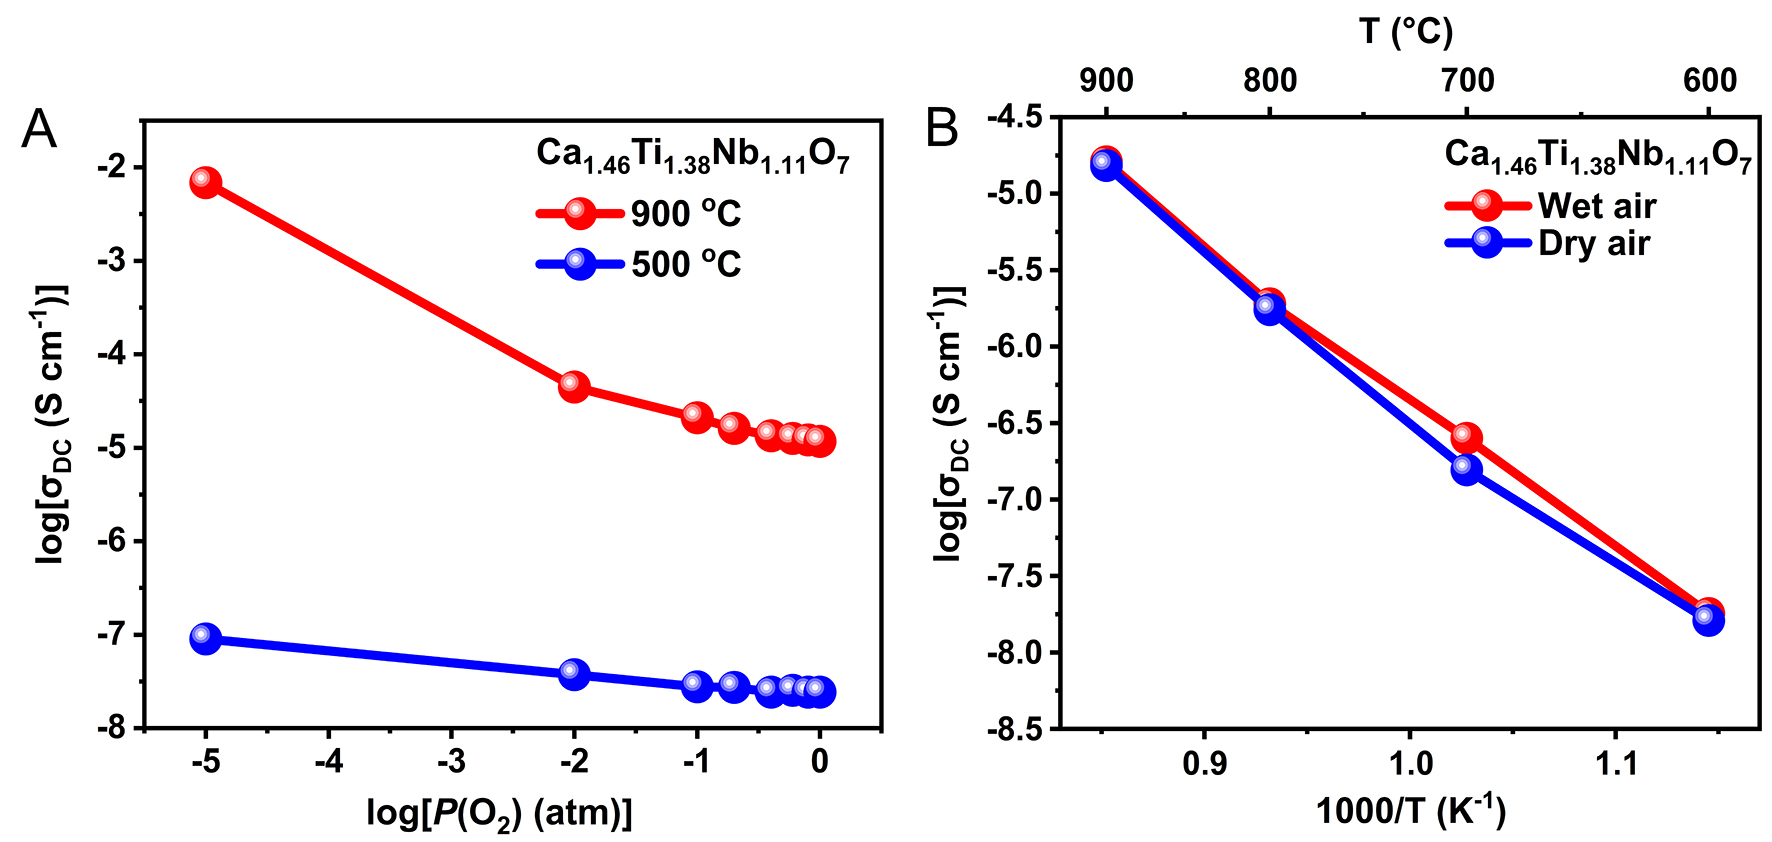
Figure 6. (A) Oxygen partial pressure pO2 dependence of the DC conductivity σDC of Ca1.46Ti1.38Nb1.11O7 at 500 and 900 °C; (B) Arrhenius plots of σDC of Ca1.46Ti1.38Nb1.11O7 in wet (water vapor pressure of 0.042 atm) and dry air.
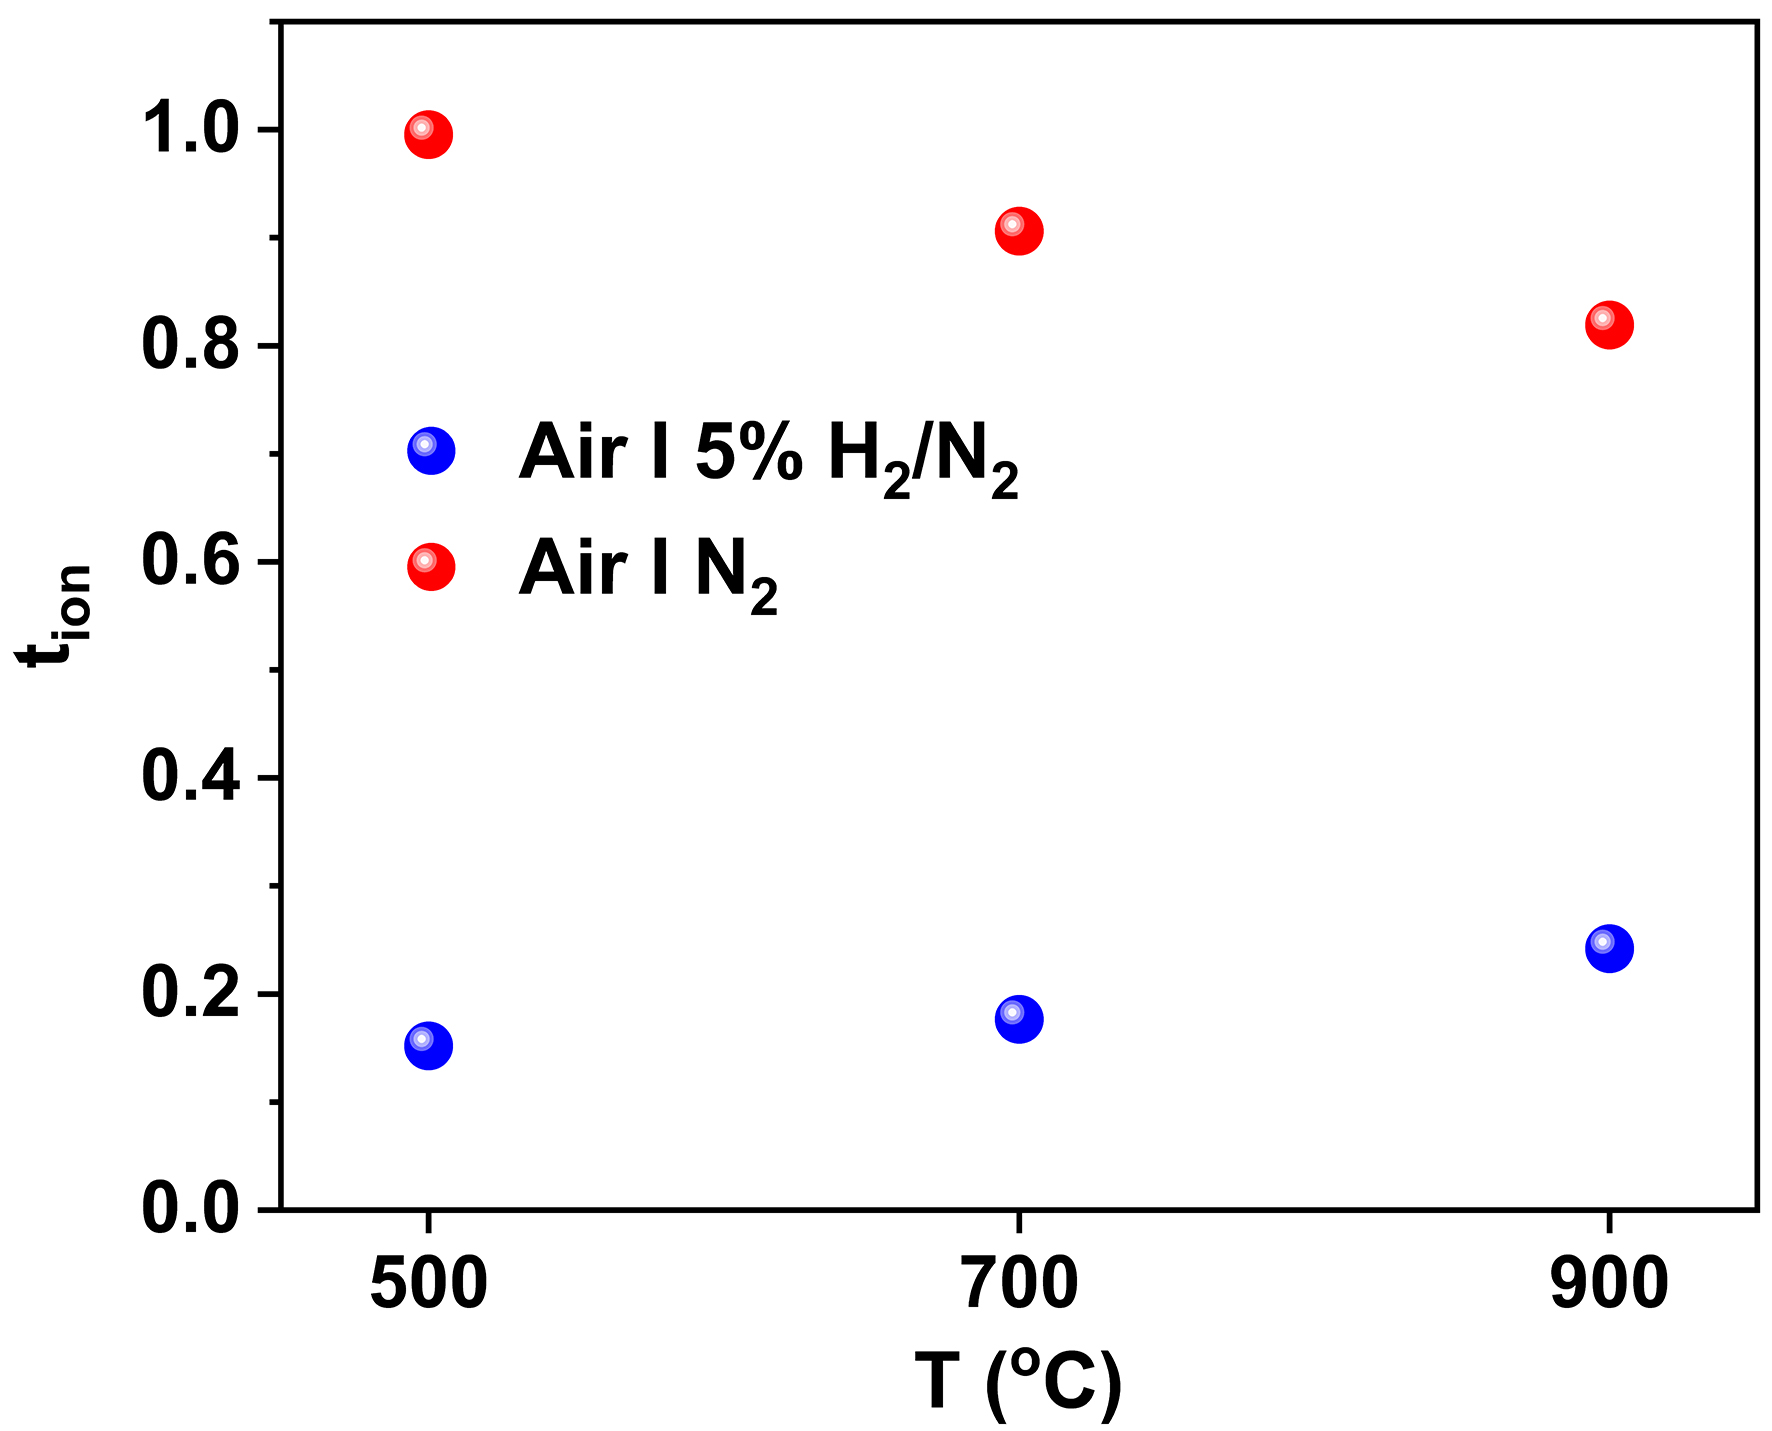
Figure 7. Ion transport number tion of Ca1.46Ti1.38Nb1.11O7 from EMF measurements using air|N2 and air|5% H2/N2 gas concentration cells.
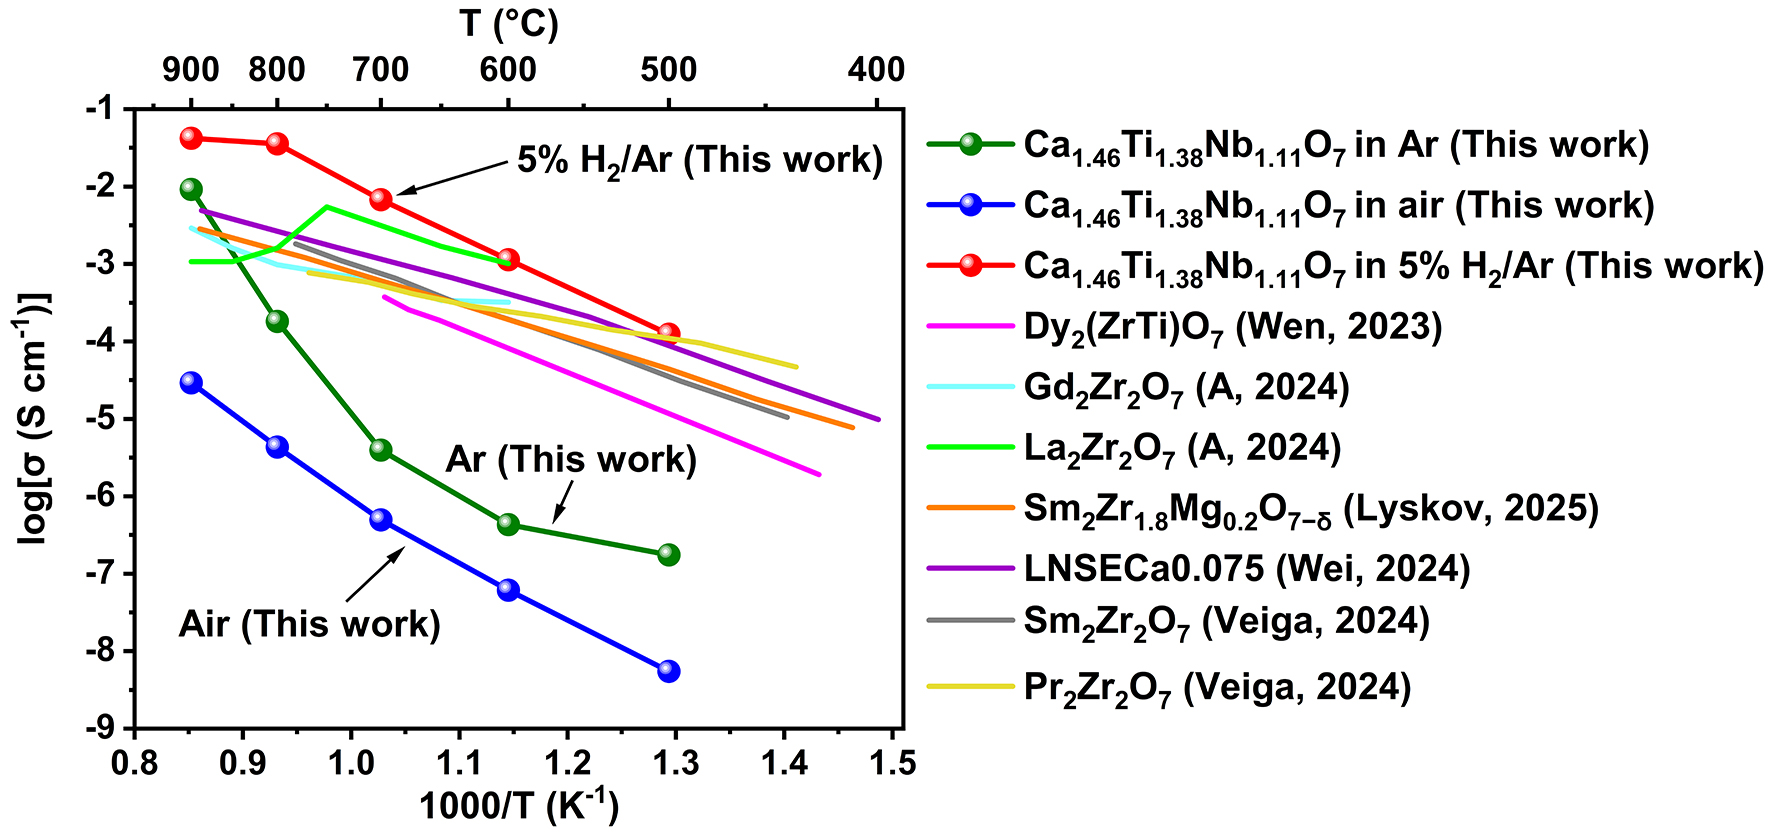
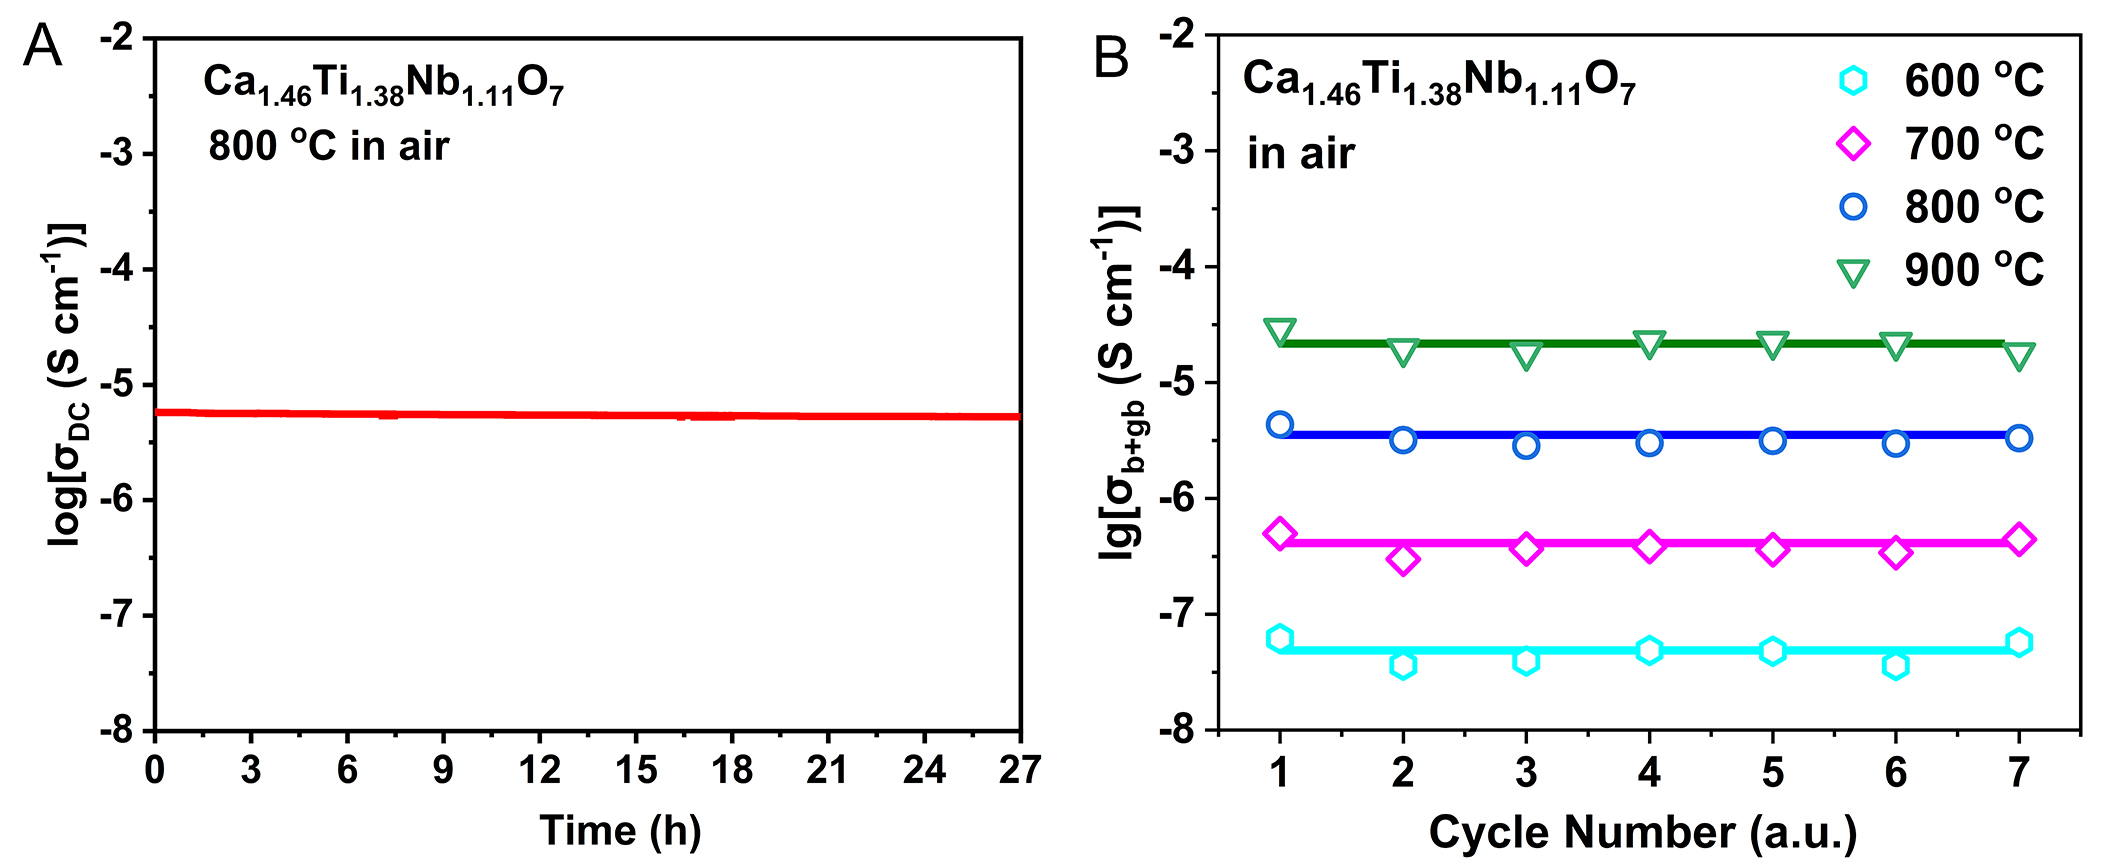
Figure 9. (A) Time dependence of the DC conductivity σDC of Ca1.46Ti1.38Nb1.11O7 at 800 °C in air; (B) The total conductivity σb+gb in air of Ca1.46Ti1.38Nb1.11O7 from 600 to 900 °C during the thermal cycling process between 100 and 900 °C.
Conduction mechanism
Thermogravimetry
The TG curve of Ca1.46Ti1.38Nb1.11O7 in air [Figure 10] showed an overall mass gain with increasing temperature, reaching 101.13% of the initial mass up to 1,000 °C. The mass gain is attributed to the addition of oxygen atoms in the air into the lattice. The incorporation of oxygen atoms decreases the oxygen vacancy concentration, thereby reducing the conductivity. Ca1.46Ti1.38Nb1.11O7 exhibited negligible mass change upon heating in Ar [Figure 10], owing to the extremely low oxygen partial pressure. It can be inferred from the TG curve in Ar that no significant change in oxygen vacancy concentration occurred during the conductivity measurements from 500 to 900 °C in Ar. Therefore, the oxygen vacancy concentration in the material is significantly higher during conductivity measurement in Ar than in air, leading to a notably higher conductivity in Ar.
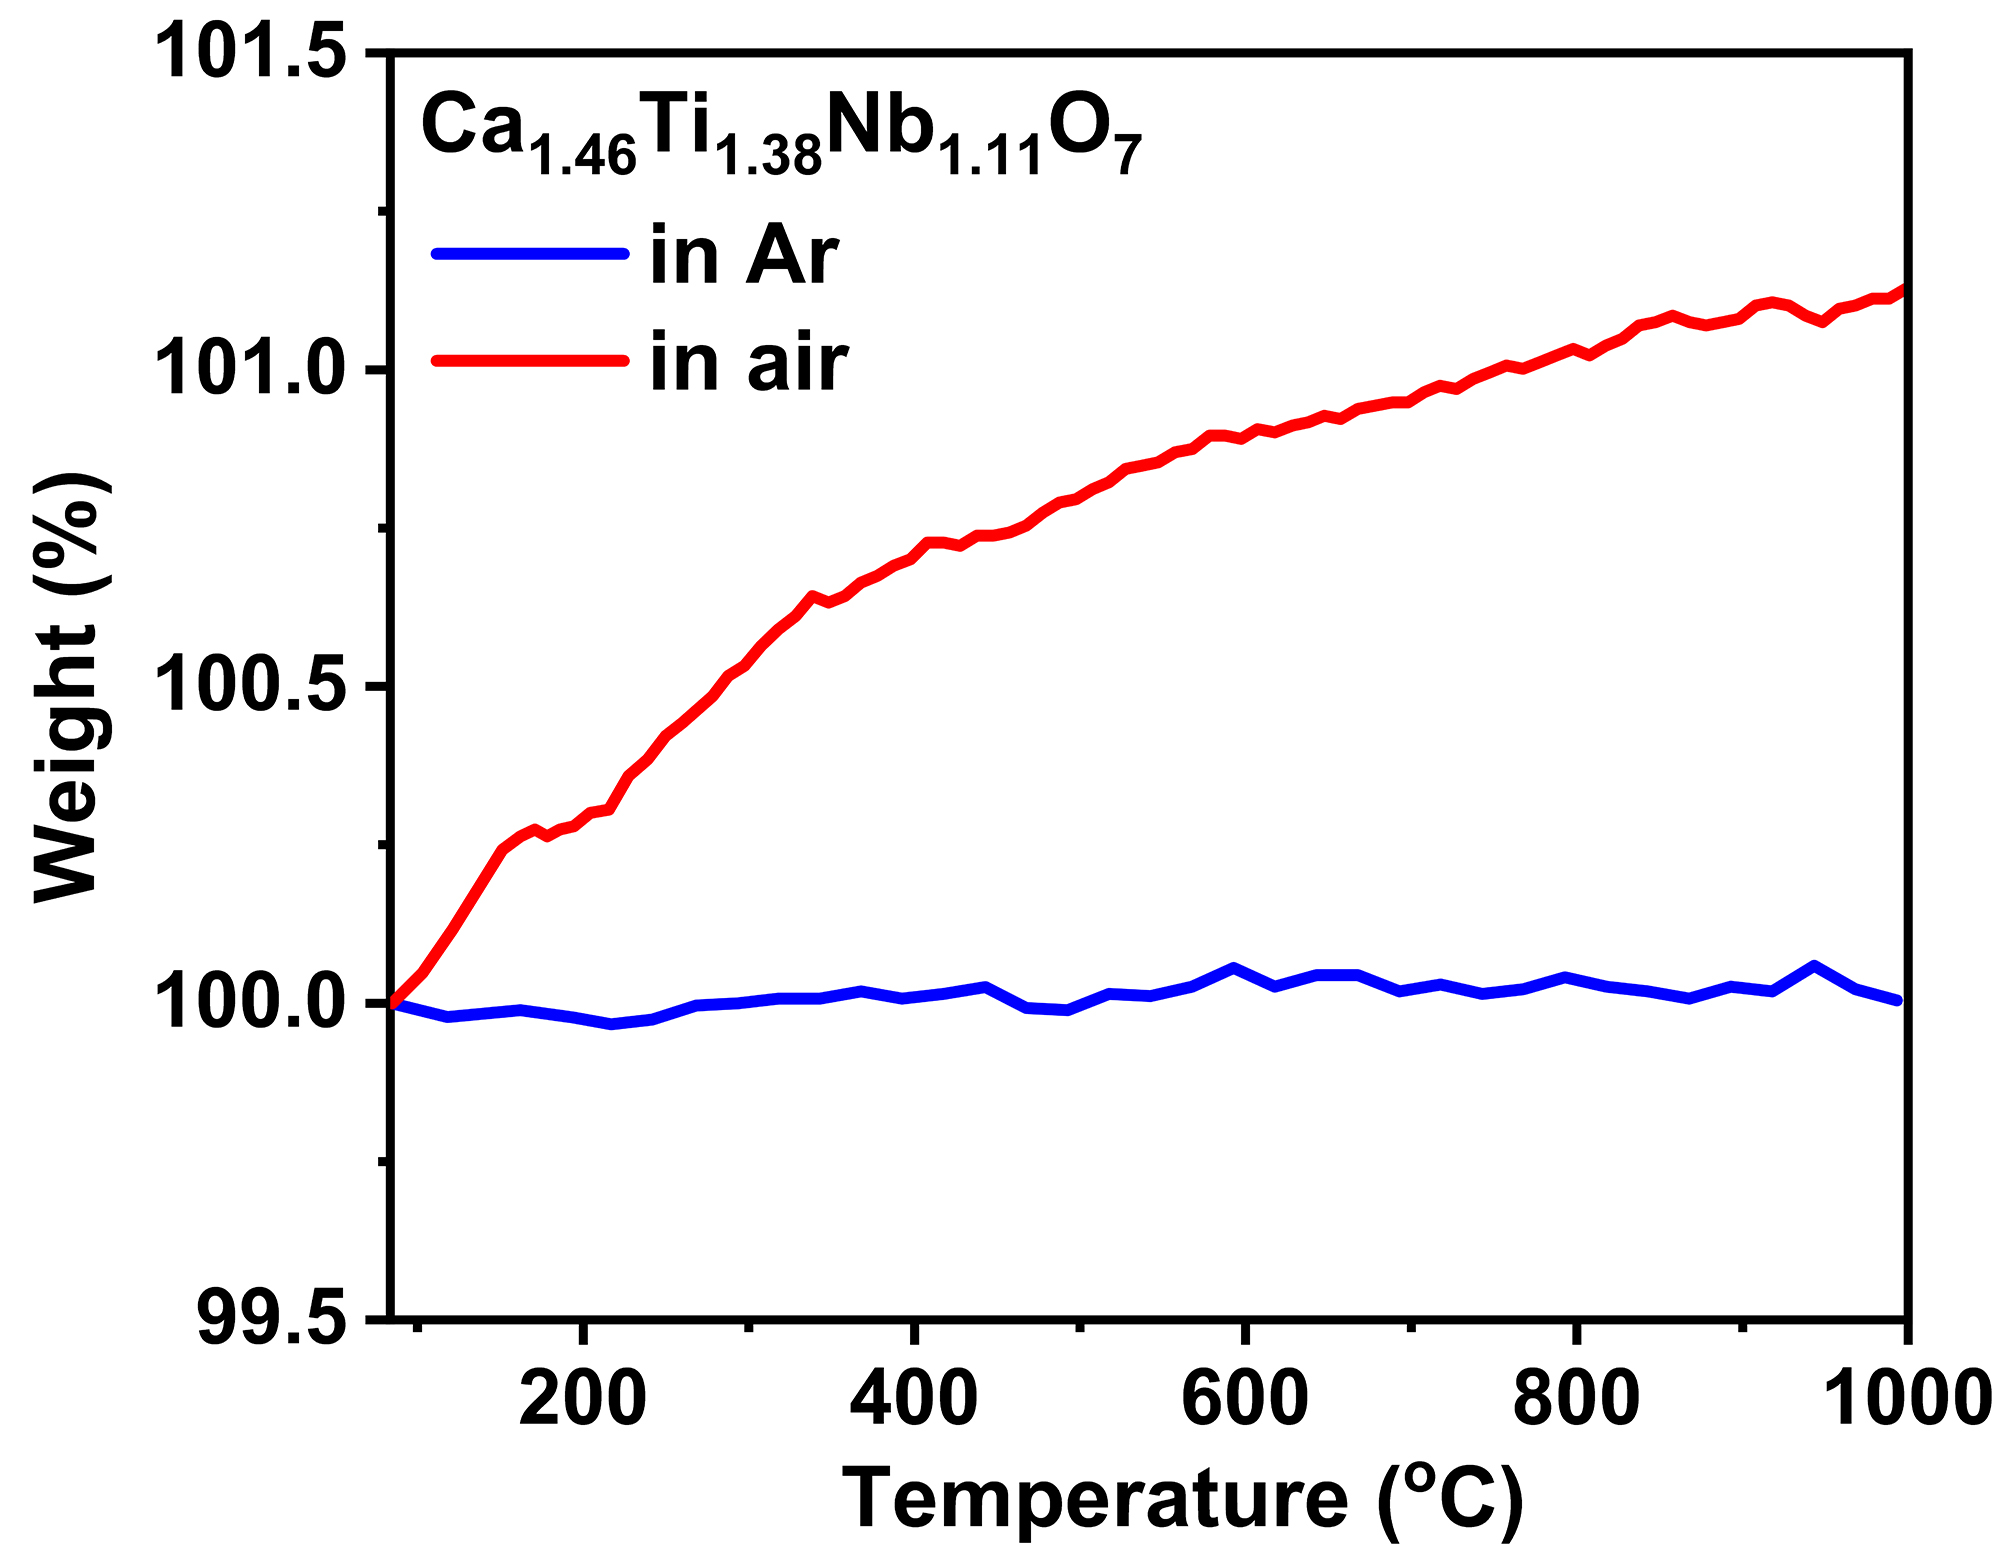
Figure 10. The TG curve of Ca1.46Ti1.38Nb1.11O7 in air and Ar.
X-ray photoelectron spectroscopy
To directly compare the oxygen vacancy concentrations in Ca1.46Ti1.38Nb1.11O7 under different atmospheres, the Ar-synthesized sample was subjected to annealing under contrasting atmospheres (in air and H2). The samples before and after annealing treatment were then characterized by XPS for comparison. The wide-survey XPS spectra [Figure 11] show all characteristic peaks of Ca1.46Ti1.38Nb1.11O7. The core-level peaks observed at 530.0, 458.1, 346.9, and 207.1 eV correspond to O 1s, Ti 2p, Ca 2p, and Nb 3d, respectively, confirming the presence of these elements. No other elements were observed in the wide-survey spectra, indicating that no impurities were incorporated during the preparation process. The Ca 2p spectra
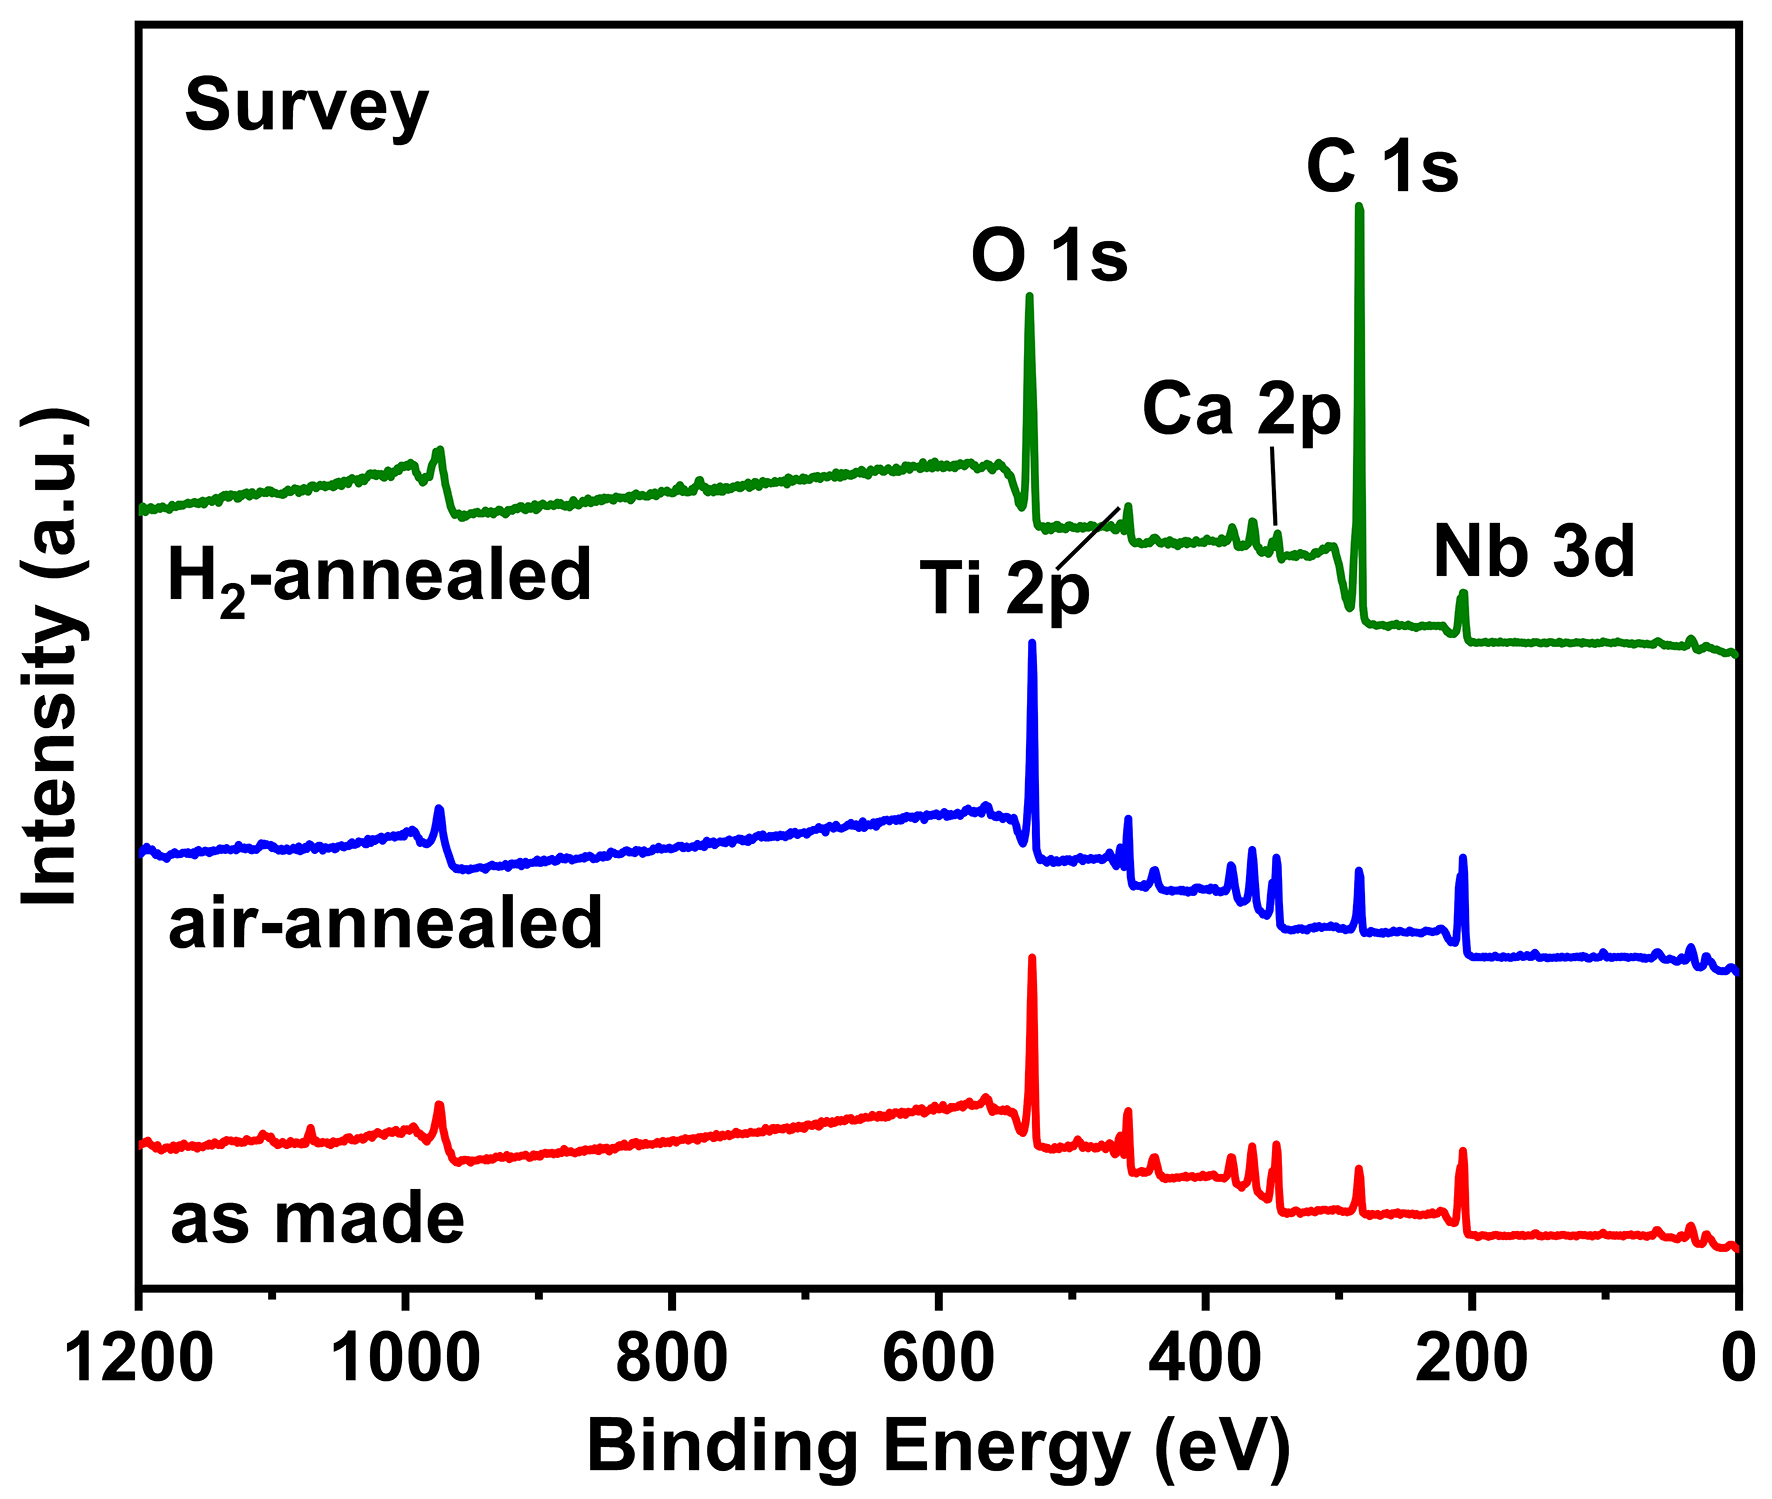
Figure 11. Wide XPS survey spectra of Ca1.46Ti1.38Nb1.11O7.
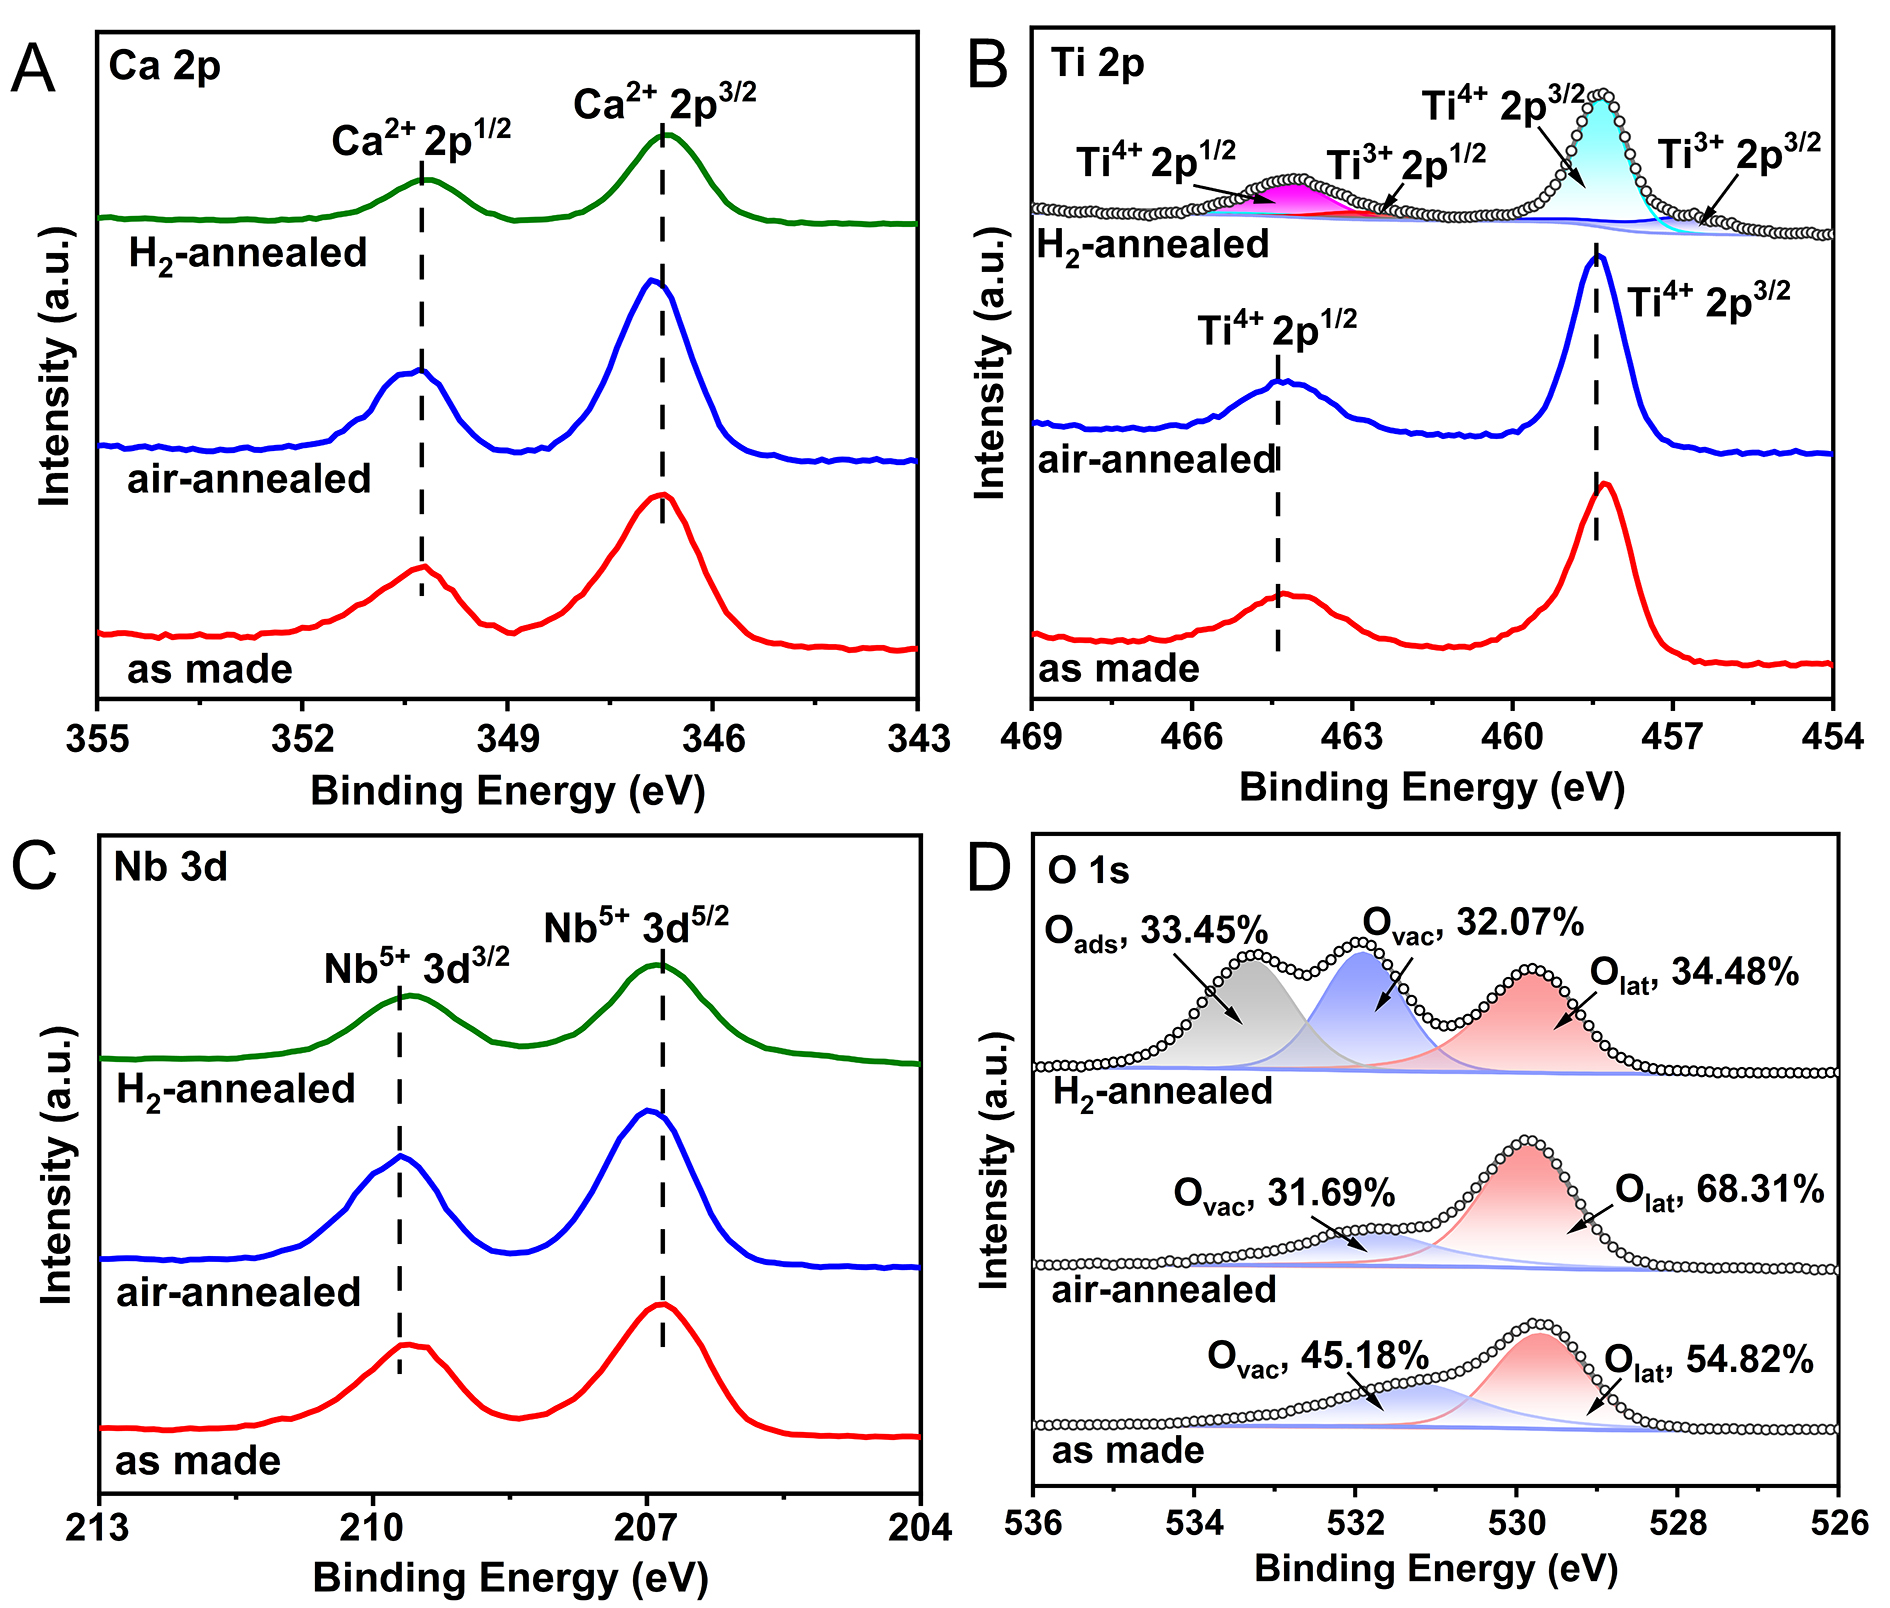
Figure 12. XPS spectra of Ca1.46Ti1.38Nb1.11O7. (A) Ca 2p spectra; (B) Ti 2p spectra; (C) Nb 3d spectra; (D) O 1s spectra.
Electron paramagnetic resonance
Although sintering in Ar generated a large number of oxygen vacancies in Ca1.46Ti1.38Nb1.11O7, the valence states of the metal elements remained unchanged. This phenomenon, where oxygen vacancies form without reduction of the metal cations, was also observed in R-WO₃ by Zhang et al.[43]. While the charge-compensating electrons from oxygen vacancies can be either trapped by metal ions or localized at the vacancy sites, Ca1.46Ti1.38Nb1.11O7 is an example of the latter[41]. The EPR spectrum [Figure 13] shows a symmetric signal at g = 2.0014, which is consistent with electrons being trapped at oxygen vacancies[43,50-56]. The weak intensity of the EPR signal indicates a very small number of unpaired electrons, suggesting a relatively minor contribution of electronic conduction in Ca1.46Ti1.38Nb1.11O7. This is supported by preceding EMF measurements under an air|N2 gas concentration cell, which revealed that the tion values are above 0.8 across the entire temperature range [Figure 7]. When heating Ca1.46Ti1.38Nb1.11O7 in Ar, the generation of oxygen vacancies can be described by Equation (3)[41],
where
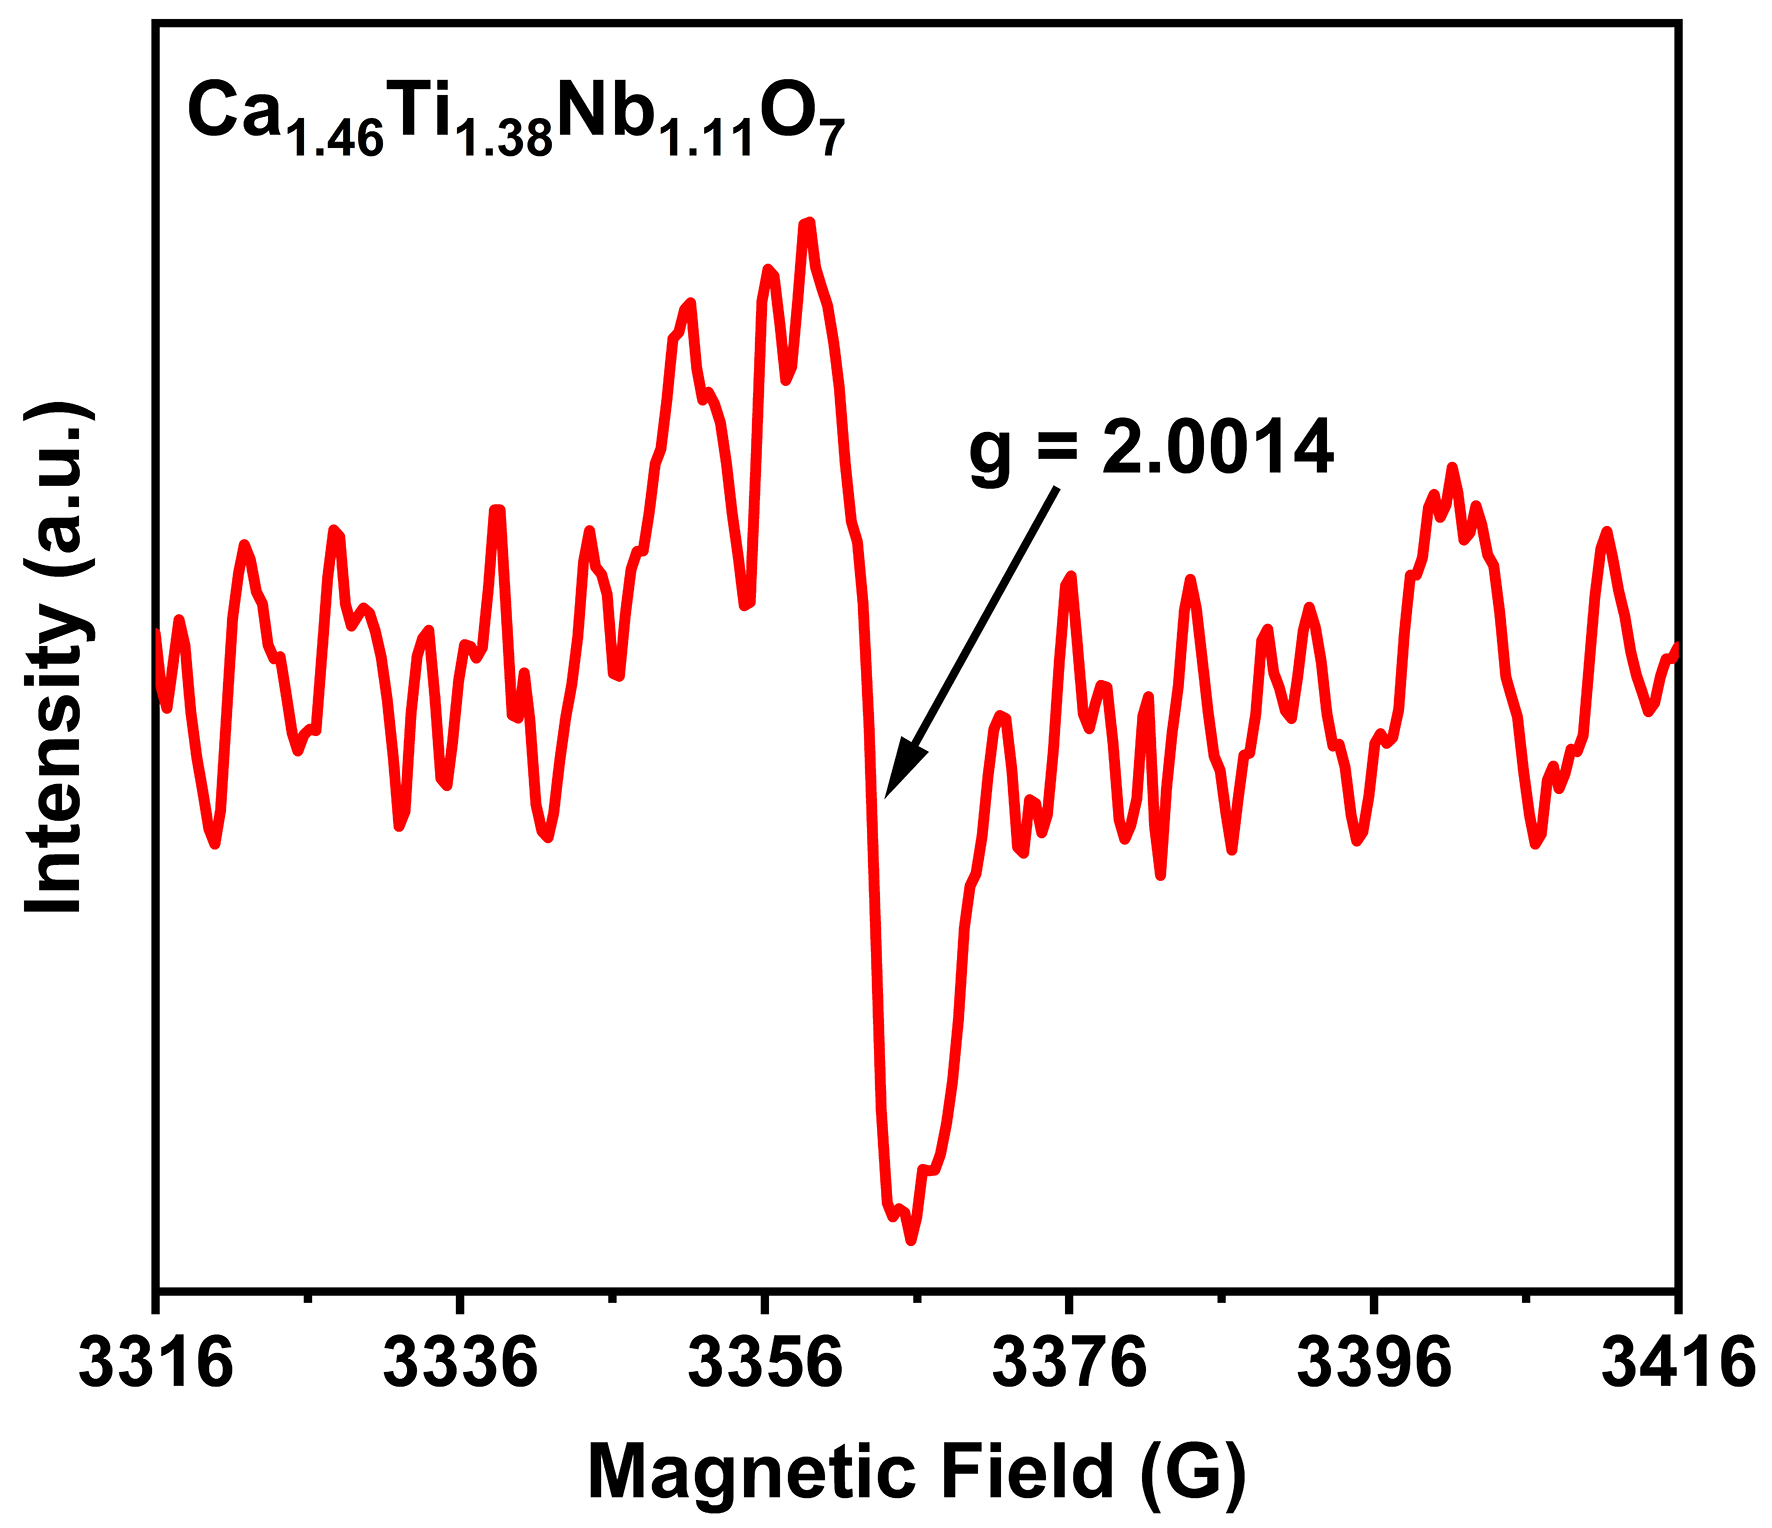
Figure 13. EPR spectrum at room-temperature of Ca1.46Ti1.38Nb1.11O7.
Accordingly, the equilibrium
where K is the equilibrium constant, kB is the Boltzmann constant, pO2 is the O2 partial pressure, ΔGf is the formation free energy of
Based on Equation (4), a decrease in pO2 leads to an increase in [
Bond valence site energy calculations and maximum entropy method
Studying the oxide-ion migration pathways is crucial for understanding the electrochemical behavior of the material. BVSE calculations, based on Pauling's principle of local charge neutrality, were performed by placing the mobile ion at all points of a three-dimensional grid that spans the unit cell[57]. This grid represents a fixed, rigid structural framework. The BVSE method has been extensively used to identify crystalline frameworks with infinite networks that facilitate the transport of ions. It also serves to rank materials based on the accessible volume within the crystal structure where the valence mismatch is low. The migration pathways are simulated through a two-step process: first, transition positions between equilibrium sites are identified by calculating the ion's valence state; then, the complete pathways are reconstructed by connecting these positions. The oxide-ion migration pathways in Ca1.46Ti1.38Nb1.11O7 were simulated by BVSE calculations. At an iso-surface value (oxide-ion migration barrier) of 0.55 eV, the O1-site atoms are interconnected [Figure 14A]. Simultaneously, O1 and O2 sites are connected. This indicates that oxide ion migration occurs through O1-O1 and O2-O1-O2 pathways within the lattice, confirming three-dimensional oxide-ion diffusion. The results highlight the importance of O1-site vacancies for oxide-ion migration, as O2-site atoms must pass through the O1 site during migration. Thus, creating oxygen vacancies at the O1 site will enhance the conductivity of O2-site atoms. The MEM electron density distribution of oxide ions along the migration pathway exhibits good agreement with the BVSE calculations [Figure 14B], thereby further confirming the reliability of the BVSE results. Notably, the oxide-ion migration barrier calculated in this work (0.55 eV) is lower than that derived from the crystal structure reported by Roth et al.[27] (1.14 eV). This difference can be attributed primarily to the different conditions under which the XRD data were obtained. The structure reported by Roth et al. was determined from room-temperature XRD data, whereas our calculations are based on crystal structure parameters refined from high-temperature XRD data. Oxide-ion conduction is a thermally activated process. Therefore, the high-temperature structure provides a more accurate representation of the conduction behavior. This structure more accurately captures the migration pathways and local coordination environments under operating conditions, thereby providing a more reliable basis for the calculated migration barrier. The reliability of our refined result is further supported by the high quality of the Rietveld refinement, with RF < 7% and both Rwp and Rp < 4%. These low residual factors ensure the accuracy of the refined crystal structure and further guarantee the credibility of the subsequent BVSE calculations. Therefore, the calculation results in this work represent the high-temperature conduction behavior of Ca1.46Ti1.38Nb1.11O7 more realistically.
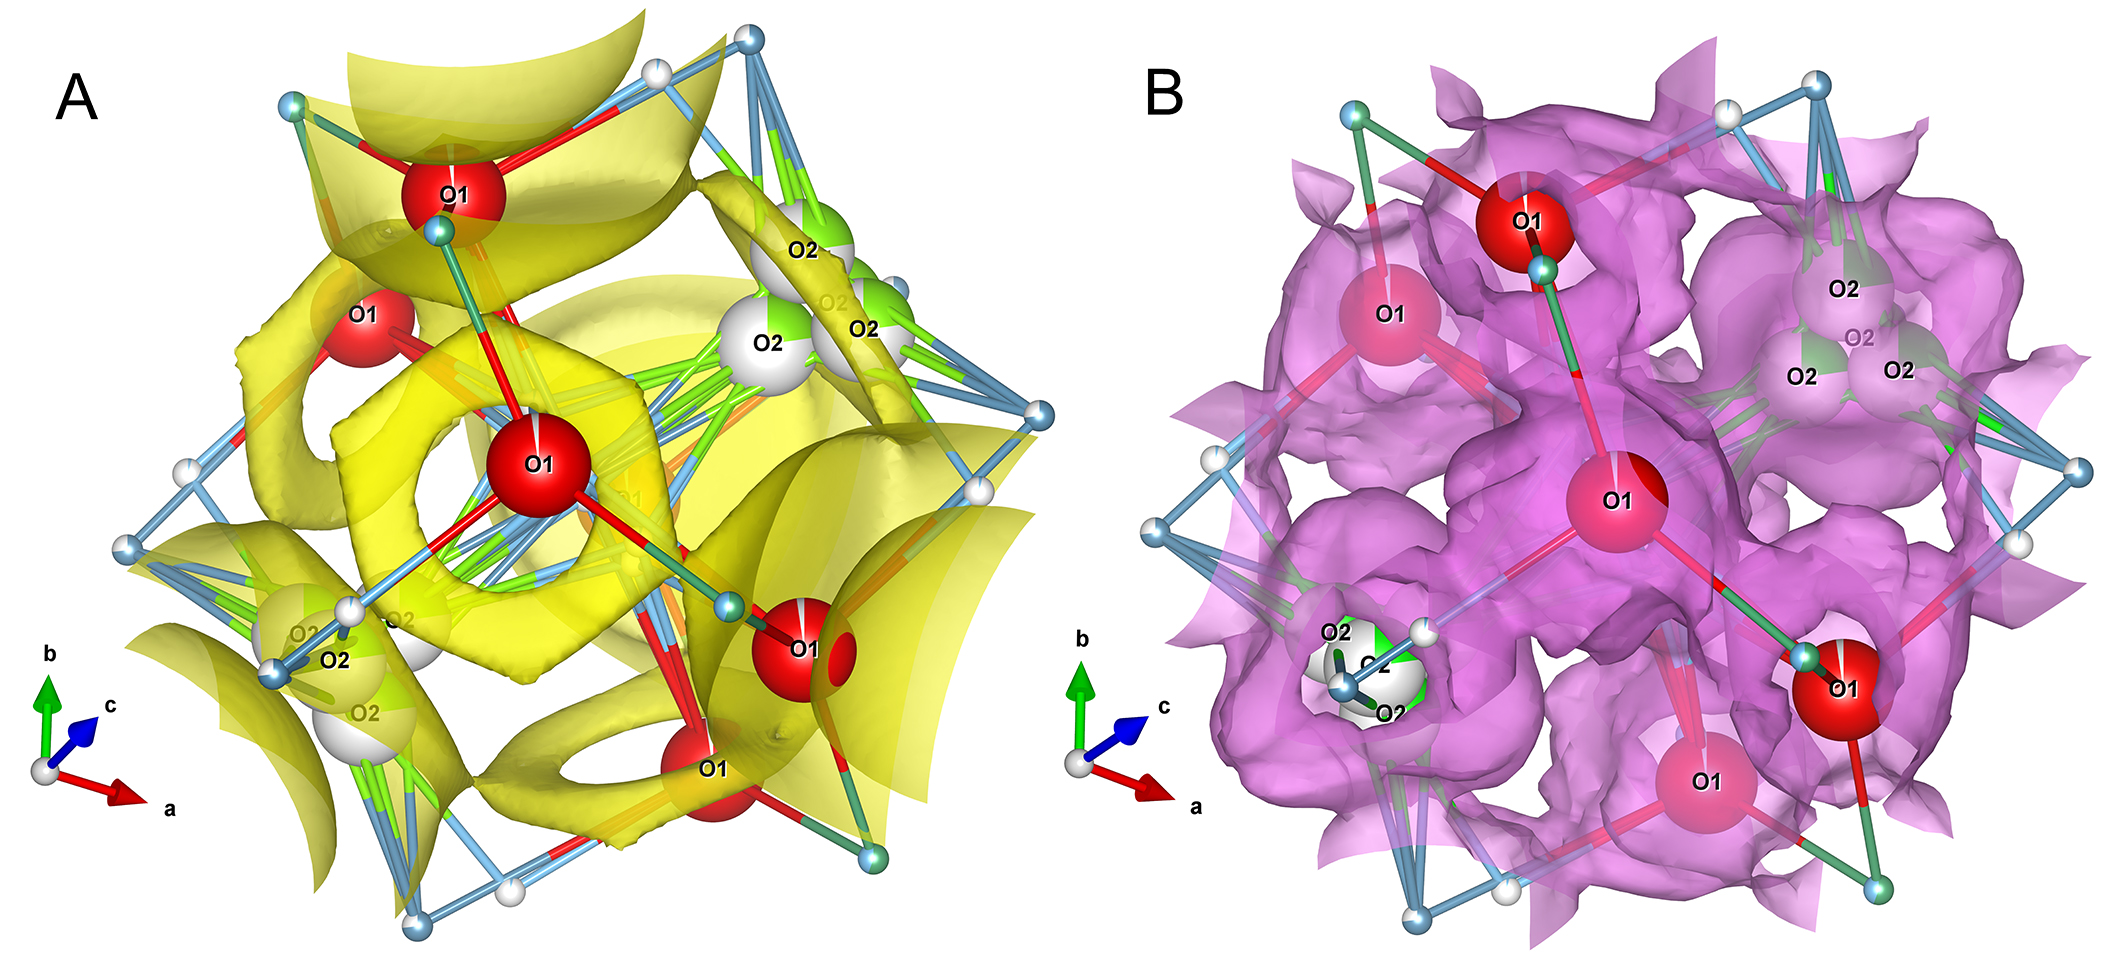
Figure 14. BVSE and MEM calculations for Ca1.46Ti1.38Nb1.11O7. (A) The calculated BVSE map of oxide ions with an iso-surface at 0.55 eV, where the iso-surface is marked by yellow areas; (B) MEM electron density distribution for oxide ions, where the electron density is marked by pink areas.
CONCLUSIONS
This work aims to investigate the conductive properties and conduction mechanism of Ca1.46Ti1.38Nb1.11O7. The conductivity of Ca1.46Ti1.38Nb1.11O7 is strongly dependent on the oxygen partial pressure, exhibiting significantly enhanced conductivity under a reducing atmosphere. The variations in conductivity across different atmospheres can be attributed to changes in the oxygen vacancy concentration and the valence states of the metal cations. These results confirm that creating oxygen vacancies through synthesis in a low-oxygen atmosphere is an effective strategy for enhancing ionic conductivity. Future research will focus on optimizing the defect chemistry by carefully controlling the synthesis atmosphere to further enhance the material's performance.
DECLARATIONS
Authors’ contributions
Methodology, data curation, investigation, writing - original draft: Yao, Y.
Methodology, investigation: Liu, S.; Sun, H.; Yao, J.
Funding acquisition, investigation, methodology, supervision: Li, W. C.
Data curation, funding acquisition, investigation, methodology, supervision, writing - original draft, writing – review & editing: Zhang, W.
Availability of data and materials
The original contributions presented in this study are included in the article. Further inquiries can be directed to the corresponding author.
AI and AI-assisted tools statement
Not applicable.
Financial support and sponsorship
This work was financially supported by National Natural Science Foundation of China (NSFC) (Nos. 22478066) and Fundamental Research Funds for the Central Universities, DUT23RC(3)024.
Conflicts of interest
All authors declared that there are no conflicts of interest.
Ethical approval and consent to participate
Not applicable.
Consent for publication
Not applicable.
Copyright
© The Author(s) 2026.
REFERENCES
1. Huan, Y.; Ma, M.; Su, Y.; Dong, D.; Hu, X.; Wei, T. Environmentally regulated intrinsic oxygen-ion transport for oxide-ion conductors. J. Materiomics. 2023, 9, 867-73.
2. Ueno, N.; Yaguchi, H.; Fujii, K.; Yashima, M. High conductivity and diffusion mechanism of oxide ions in triple fluorite-like layers of oxyhalides. J. Am. Chem. Soc. 2024, 146, 11235-44.
3. Kreysa, G.; Ota, K. I.; Savinell, R. F. Encyclopedia of applied electrochemistry. New York, NY: Springer; 2014.
4. Zhang, W.; Fujii, K.; Ishiyama, T.; Kandabashi, H.; Yashima, M. Dion-Jacobson-type oxide-ion conductor CsLa2Ti2NbO10-δ without phase transitions. J. Mater. Chem. A. 2020, 8, 25085-93.
5. Zhang, W.; Fujii, K.; Niwa, E.; Hagihala, M.; Kamiyama, T.; Yashima, M. Oxide-ion conduction in the Dion-Jacobson phase CsBi2Ti2NbO10-δ. Nat. Commun. 2020, 11, 1224.
6. Wang, H.; Ma, Y.; Yang, W.; et al. Understanding the conduction mechanism of acceptor-doped ceria oxygen ion conductors by photoluminescence analysis. Ceram. Int. 2022, 48, 27343-8.
7. Li, X.; Yang, L.; Zhu, Z.; et al. Borates as a new direction in the design of oxide ion conductors. Sci. China. Mater. 2022, 65, 2737-45.
8. Dunn, B.; Kamath, H.; Tarascon, J. M. Electrical energy storage for the grid: a battery of choices. Science 2011, 334, 928-35.
9. Kharton, V.; Marques, F.; Atkinson, A. Transport properties of solid oxide electrolyte ceramics: a brief review. Solid. State. Ion. 2004, 174, 135-49.
10. Kudo, T.; Obayashi, H. Oxygen ion conduction of the fluorite-type Ce1-xLnxO2-x/2 (Ln = Lanthanoid Element). Electrochem. Soc. 1975, 122, 142.
11. Raj, A. A.; Anantharaman, A. P. Exploring the defect formation and ionic migration in A2Zr2O7 (A = La, Ce, Nd, and Gd) pyrochlore solid-state electrolytes. Ceram. Int. 2024, 50, 48116-26.
12. Liu, Z.; Ouyang, J.; Sun, K.; Zhou, Y.; Xiang, J. Preparation, structure and electrical conductivity of pyrochlore-type Gd1-xEu2xSm1-xZr2O7 ceramics with a constant lattice parameter. Electrochim. Acta. 2011, 56, 7045-50.
13. Cao, X. Q.; Vassen, R.; Jungen, W.; Schwartz, S.; Tietz, F.; Stöver, D. Thermal stability of lanthanum zirconate plasma-sprayed coating. J. Am. Ceram. Soc. 2004, 84, 2086-90.
14. Dos Santos Veiga, E. L.; Beltrán-Mir, H.; Fourcade, S.; et al. Understanding the rapid reoxidation process and the electrical properties of Spark Plasma sintered pyrochlores. J. Eur. Ceram. Soc. 2024, 44, 4130-40.
15. Marrocchelli, D.; Madden, P. A.; Norberg, S. T.; Hull, S. Structural disorder in doped zirconias, part II: vacancy ordering effects and the conductivity maximum. Chem. Mater. 2011, 23, 1365-73.
16. Wen, L. C.; Li, Z. P.; Chen, H. S.; Tseng, S. C. Preparation and electrical properties of pyrochlore R2(ZrTi)O7 for solid oxide fuel cell electrolyte. J. Energy. Storage. 2023, 64, 107058.
17. Subramanian, M.; Aravamudan, G.; Subba, Rao. G. Oxide pyrochlores - A review. Prog. Solid. State. Chem. 1983, 15, 55-143.
18. Blundred, G. D.; Bridges, C. A.; Rosseinsky, M. J. New oxidation states and defect chemistry in the pyrochlore structure. Angew. Chem. Int. Ed. 2004, 43, 3562-5.
19. Mouta, R.; Silva, R. X.; Paschoal, C. W. Tolerance factor for pyrochlores and related structures. Acta. Cryst. B. 2013, 69, 439-45.
20. Mahato, N.; Banerjee, A.; Gupta, A.; Omar, S.; Balani, K. Progress in material selection for solid oxide fuel cell technology: a review. Prog. Mater. Sci. 2015, 72, 141-337.
21. Varcoe, J. R.; Atanassov, P.; Dekel, D. R.; et al. Anion-exchange membranes in electrochemical energy systems. Energy. Environ. Sci. 2014, 7, 3135-91.
22. Cioateră, N.; Voinea, E.; Spînu, C. 13 - Pyrochlores as cathodes in solid oxide fuel cells. In: Pyrochlore Ceramics. Elsevier; 2022. pp. 433-48.
23. Shlyakhtina, A.; Pigalskiy, K. Tolerance factor as the basic criterion in searching for promising oxygen-ion and proton conductors among Ln2-xDxM2O7-δ (Ln = La-Lu; M = Sn, Ti, Zr, Hf; D = Sr, Ca, Mg; x = 0, 0.1) 3+/4+ pyrochlores. Mater. Res. Bull. 2019, 116, 72-8.
24. Jiang, L.; Liu, Y.; Sun, W.; et al. Mixed potential type sensor based on Gd2Zr2O7 solid electrolyte and BiVO4 sensing electrode for effective detection of triethylamine. J. Hazard. Mater. 2022, 440, 129695.
25. Ganesan, M.; Jayaraman, V.; Selvaraj, P.; Mani, K. M.; Kim, D. Pyrochlore cerium stannate (Ce2Sn2O7) for highly sensitive NO2 gas sensing at room temperature. Appl. Surf. Sci. 2023, 624, 157135.
26. Jiang, L.; Wang, C.; Wang, J.; et al. Pyrochlore Ca-doped Gd2Zr2O7 solid state electrolyte type sensor coupled with ZnO sensing electrode for sensitive detection of HCHO. Sens. Actuat. B. Chem. 2020, 309, 127768-75.
27. Roth, R.; Vanderah, T.; Bordet, P.; et al. Pyrochlore formation, phase relations, and properties in the CaO-TiO2-(Nb,Ta)2O5 systems. J. Solid. State. Chem. 2008, 181, 406-14.
28. Chen, H.; Wong, L. L.; Adams, S. SoftBV - a software tool for screening the materials genome of inorganic fast ion conductors. Acta. Cryst. B. 2019, 75, 18-33.
29. Chen, H.; Adams, S. Bond softness sensitive bond-valence parameters for crystal structure plausibility tests. IUCrJ 2017, 4, 614-25.
30. Wong, L. L.; Phuah, K. C.; Dai, R.; Chen, H.; Chew, W. S.; Adams, S. Bond valence pathway analyzer - An automatic rapid screening tool for fast ion conductors within softBV. Chem. Mater. 2021, 33, 625-41.
31. Liu, F.; Sun, Y.; Li, Z.; Peng, P.; Wang, C.; Wang, H. Equivalent doping of Te leads to optimized electrical and thermal transport properties in thermoelectric Cu2MnSnSe4 alloys. Microstructures 2025, 5, 2025043.
32. Zheng, F.; Qiu, R.; Zhang, J.; Tao, Z.; Lei, L. Theoretical and experimental investigation on using Arrhenius equation to analyze conductivities of proton ceramic electrolytes. Mater. Sci. Eng. B. 2025, 322, 118580.
33. Liu, Z. G.; Ouyang, J. H.; Sun, K. N. Improvement of electrical conductivity of trivalent rare‐earth cation‐doped neodymium zirconate by co‐doping gadolinium and ytterbium. Fuel. Cells. 2010, 10, 1050-6.
34. Wei, H.; Chen, W.; Hou, K.; Duan, X.; Liu, L.; Xu, J. Phases, Electrical properties, and stability of high‐entropy pyrochlores [(La0.25Nd0.25Sm0.25Eu0.25)xCax]2Zr2Oδ oxides. Phys. Status. Solidi. A. 2024, 221, 2300753.
35. Lyskov, N.; Kolbanev, I.; Borunova, A.; et al. Study of Mg doping on the zirconium and lanthanide sites of Ln2Zr2O7 (Ln = Sm, Gd) pyrochlores. Ceram. Int. 2025, 51, 32808-20.
36. Batis, N. H.; Delichere, P.; Batis, H. Physicochemical and catalytic properties in methane combustion of La1-xCaxMnO3±y (0 ≤ x ≤ 1; -0.04 ≤ y ≤ 0.24) perovskite-type oxide. Appl. Catal. A. Gen. 2005, 282, 173-80.
37. Shi, Y.; Zhang, Z.; Dai, Y.; Li, J.; Chen, Z. Influence of current density on the photocatalytic activity of Nd:TiO2 coatings. J. Wuhan. Univ. Technol. Mat. Sci. Edit. 2024, 39, 32-8.
38. Dwivedi, C.; Mohammad, T.; Kumar, V.; Dutta, V. Ti3+ and oxygen defects controlled colored TiO2 nanoparticles by continuous spray pyrolysis. Vacuum 2020, 182, 109612.
39. Wen, P.; Zhang, Y.; Xu, G.; Ma, D.; Qiu, P.; Zhao, X. Ti3+ self-doped TiO2 as a photocatalyst for cyclohexane oxidation under visible light irradiation. J. Materiomics. 2019, 5, 696-701.
40. Gong, B.; Luo, X.; Bao, N.; Ding, J.; Li, S.; Yi, J. XPS study of cobalt doped TiO2 films prepared by pulsed laser deposition. Surf. Interface. Anal. 2014, 46, 1043-6.
41. Wang, Z.; Lin, R.; Huo, Y.; Li, H.; Wang, L. Formation, detection, and function of oxygen vacancy in metal oxides for solar energy conversion. Adv. Funct. Mater. 2021, 32, 2109503.
42. Kuneva, M. K.; Krastev, V. I. XPS-investigation of proton exchanged waveguides in LiNbO3. J. Mater. Sci. Mater. Electron. 2000, 11, 629-32.
43. Zhang, N.; Li, X.; Ye, H.; et al. Oxide defect engineering enables to couple solar energy into oxygen activation. J. Am. Chem. Soc. 2016, 138, 8928-35.
44. Sun, Q.; Yi, Q.; Luo, H.; Liu, Q.; Zhang, D. Improved piezo-photocatalytic activity by controlling the oxygen vacancy content of NaNbO3 powders. J. Alloys. Compd. 2025, 1010, 177687.
45. Easton, C. D.; Morgan, D. J. Critical examination of the use of X-ray photoelectron spectroscopy (XPS) O 1s to characterize oxygen vacancies in catalytic materials and beyond. J. Vac. Sci. Technol. A. 2025, 43, 053205.
46. Wang, J.; Mueller, D. N.; Crumlin, E. J. Recommended strategies for quantifying oxygen vacancies with X-ray photoelectron spectroscopy. J. Eur. Ceram. Soc. 2024, 44, 116709.
47. Raj, A. K.; H, Banerjee. R.; Sanwal, J.; et al. Ordering of oxygen vacancies in hydroxyapatite under electron irradiation. Mater. Chem. Phys. 2024, 322, 129609.
48. Zhang, M.; Duan, X.; Gao, Y.; et al. Tuning oxygen vacancies in oxides by configurational entropy. ACS. Appl. Mater. Interfaces. 2023, 15, 45774-89.
49. Li, C.; Zhou, Z.; Lou, Y.; Fu, L. Lattice softening in thermoelectric materials. Microstructures 2025, 5, 2025075.
50. An, W.; Wang, H.; Yang, T.; et al. Enriched photocatalysis-Fenton synergistic degradation of organic pollutants and coking wastewater via surface oxygen vacancies over Fe-BiOBr composites. Chem. Eng. J. 2023, 451, 138653.
51. Cancino-Moreno, A. D.; López-Marure, A.; Arellano-Ahumada, S. N.; Ramírez-Rosales, D.; García-Hernández, M. Correlation of EPR and Photoluminescence analysis for crystalline defects in Eu3+/Yb3+-doped lutetium silicate sol-gel powders. Inorganics 2025, 13, 343.
52. Liu, J.; Xiang, Y.; Chen, Y.; et al. Quantitative contribution of oxygen vacancy defects to arsenate immobilization on hematite. Environ. Sci. Technol. 2023, 57, 12453-64.
53. Sang, T.; Zhong, Y.; Hu, C.; et al. Grey SrCu2O2 with vacancy and pore structure: dual organic degradation properties and first-principles calculations. J. Mol. Struct. 2024, 1314, 138678.
54. Zhu, S.; Chen, S.; Zhang, H.; et al. Vanadium pentoxide nanosheets with rich oxygen vacancies as a high-performance electrode for supercapacitors. Ionics 2022, 28, 2931-42.
55. Ji, Y.; Xia, M.; Wang, H.; Yao, W. Defect-driven piezocatalysis in zinc hydroxystannate: role of oxygen vacancies and interfaces. Mater. Today. Commun. 2025, 44, 112046.
56. Benavides-Guerrero, J. A.; Gerlein, L. F.; Angel-Ospina, A. C.; et al. Room-temperature laser crystallization of oxygen vacancy-engineered zirconia for additive manufacturing. Addit. Manuf. 2025, 111, 104969.
Cite This Article
How to Cite
Download Citation
Export Citation File:
Type of Import
Tips on Downloading Citation
Citation Manager File Format
Type of Import
Direct Import: When the Direct Import option is selected (the default state), a dialogue box will give you the option to Save or Open the downloaded citation data. Choosing Open will either launch your citation manager or give you a choice of applications with which to use the metadata. The Save option saves the file locally for later use.
Indirect Import: When the Indirect Import option is selected, the metadata is displayed and may be copied and pasted as needed.
About This Article
Copyright

Data & Comments
Data
0


Comments
Comments must be written in English. Spam, offensive content, impersonation, and private information will not be permitted. If any comment is reported and identified as inappropriate content by OAE staff, the comment will be removed without notice. If you have any queries or need any help, please contact us at support@oaepublish.com.