


fig14
From: Exploring the oxygen vacancies and electrical properties in pyrochlore-type Ca1.46Ti1.38Nb1.11O7
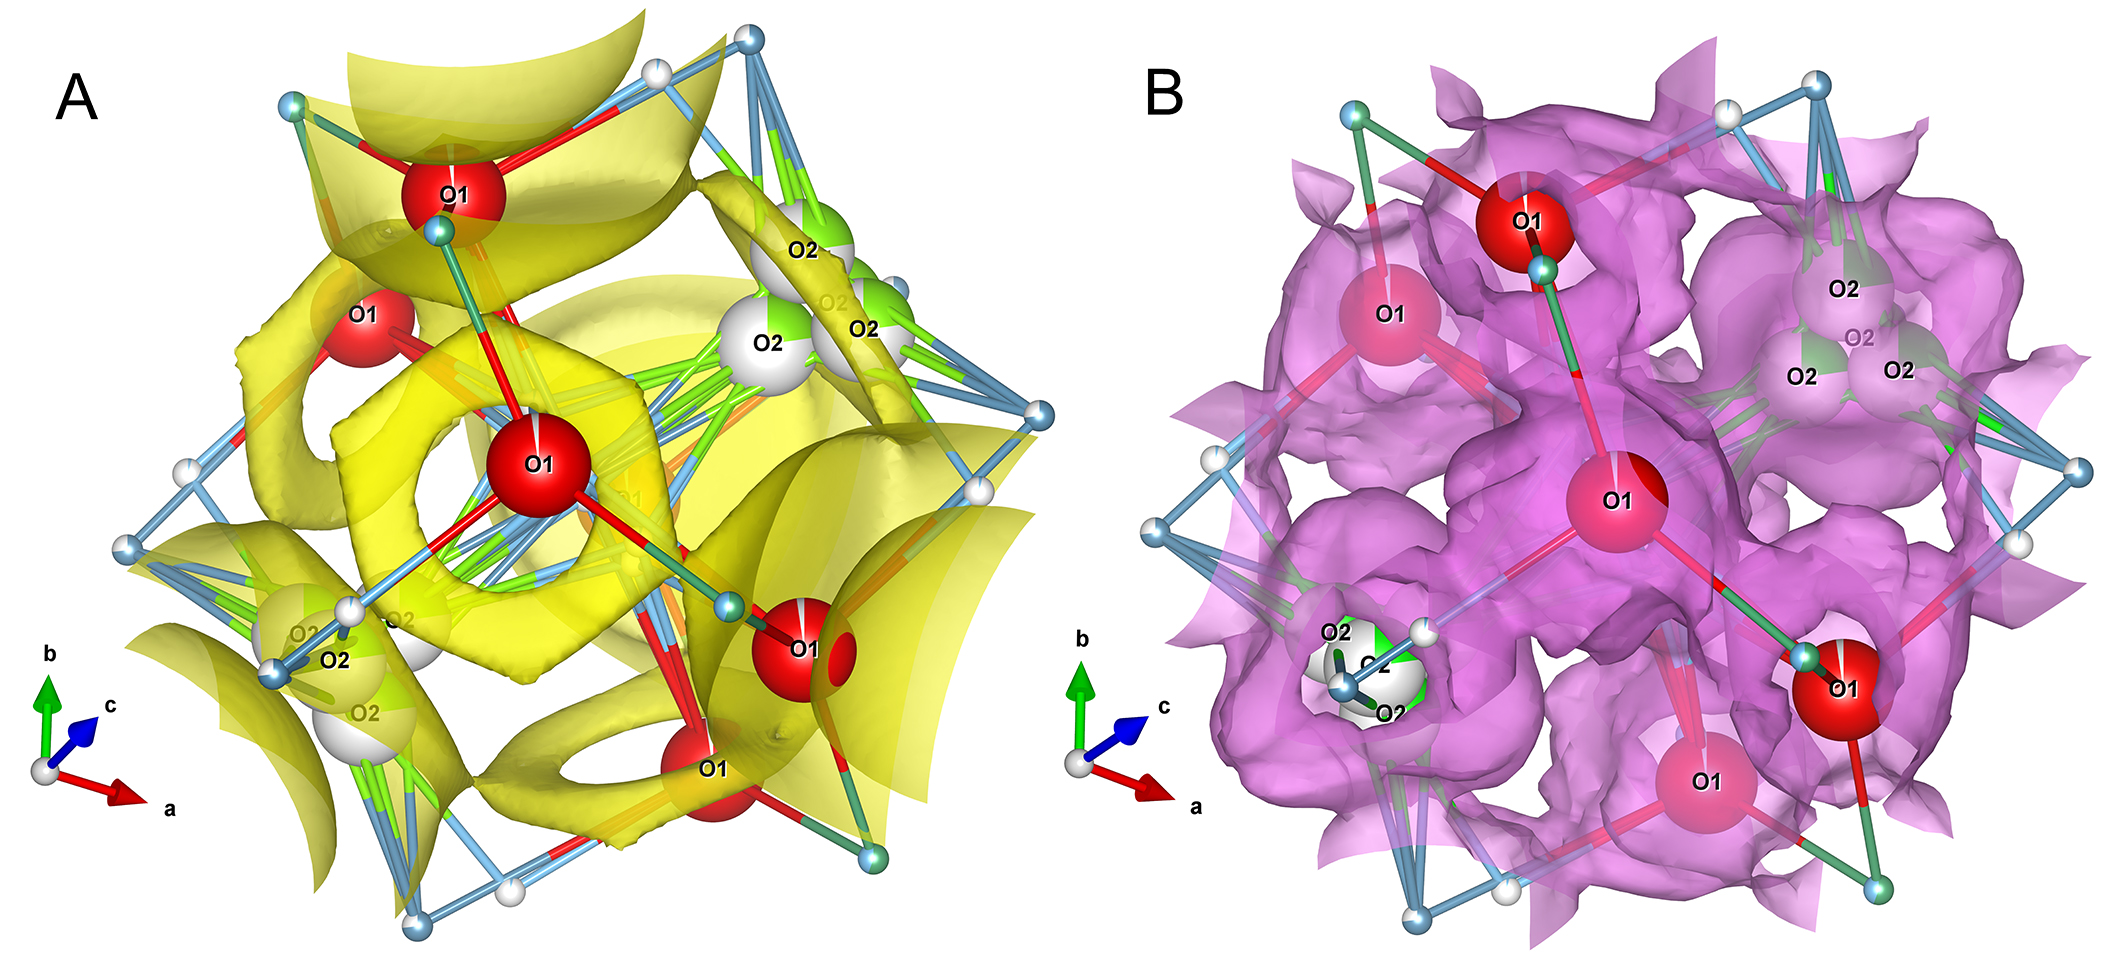
Figure 14. BVSE and MEM calculations for Ca1.46Ti1.38Nb1.11O7. (A) The calculated BVSE map of oxide ions with an iso-surface at 0.55 eV, where the iso-surface is marked by yellow areas; (B) MEM electron density distribution for oxide ions, where the electron density is marked by pink areas.


