


fig4
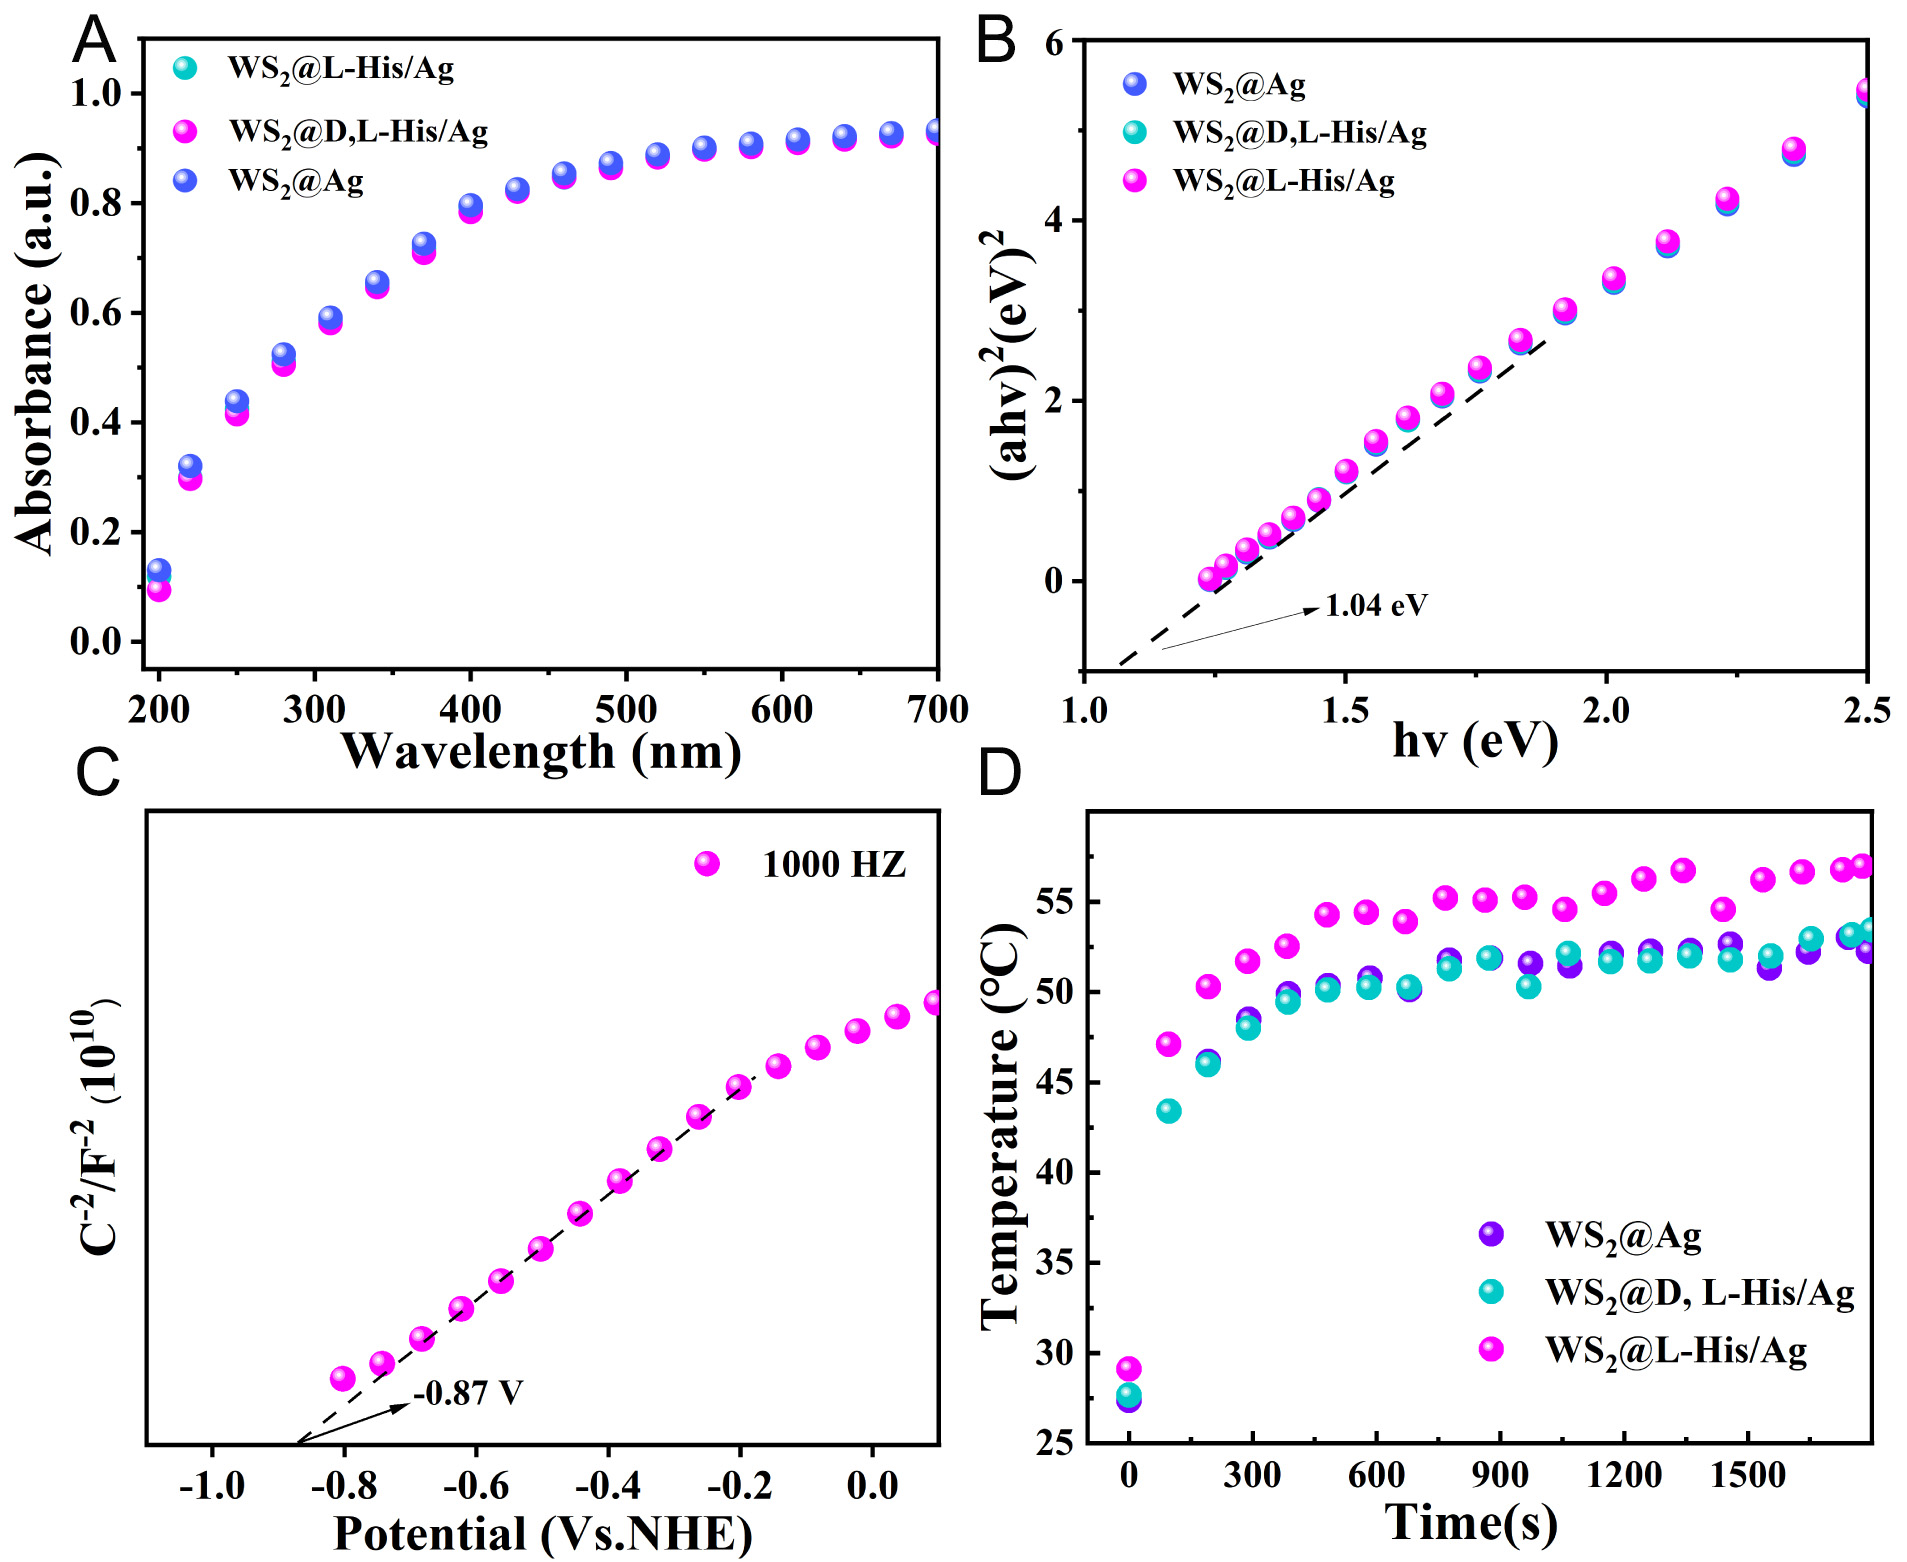
Figure 4. (A and B) UV absorption spectra and band gap calculations of WS2@D,L/L-His/Ag and WS2@Ag, (C) WS2@L-His/Ag Mott-Schottky plots, (D) Surface temperature change, of the WS2@L-His/Ag, WS2@D,L-His/Ag, and WS2@Ag composites.
Figure 4. (A and B) UV absorption spectra and band gap calculations of WS2@D,L/L-His/Ag and WS2@Ag, (C) WS2@L-His/Ag Mott-Schottky plots, (D) Surface temperature change, of the WS2@L-His/Ag, WS2@D,L-His/Ag, and WS2@Ag composites.


All published articles are preserved here permanently:
https://www.portico.org/publishers/oae/


