


fig2
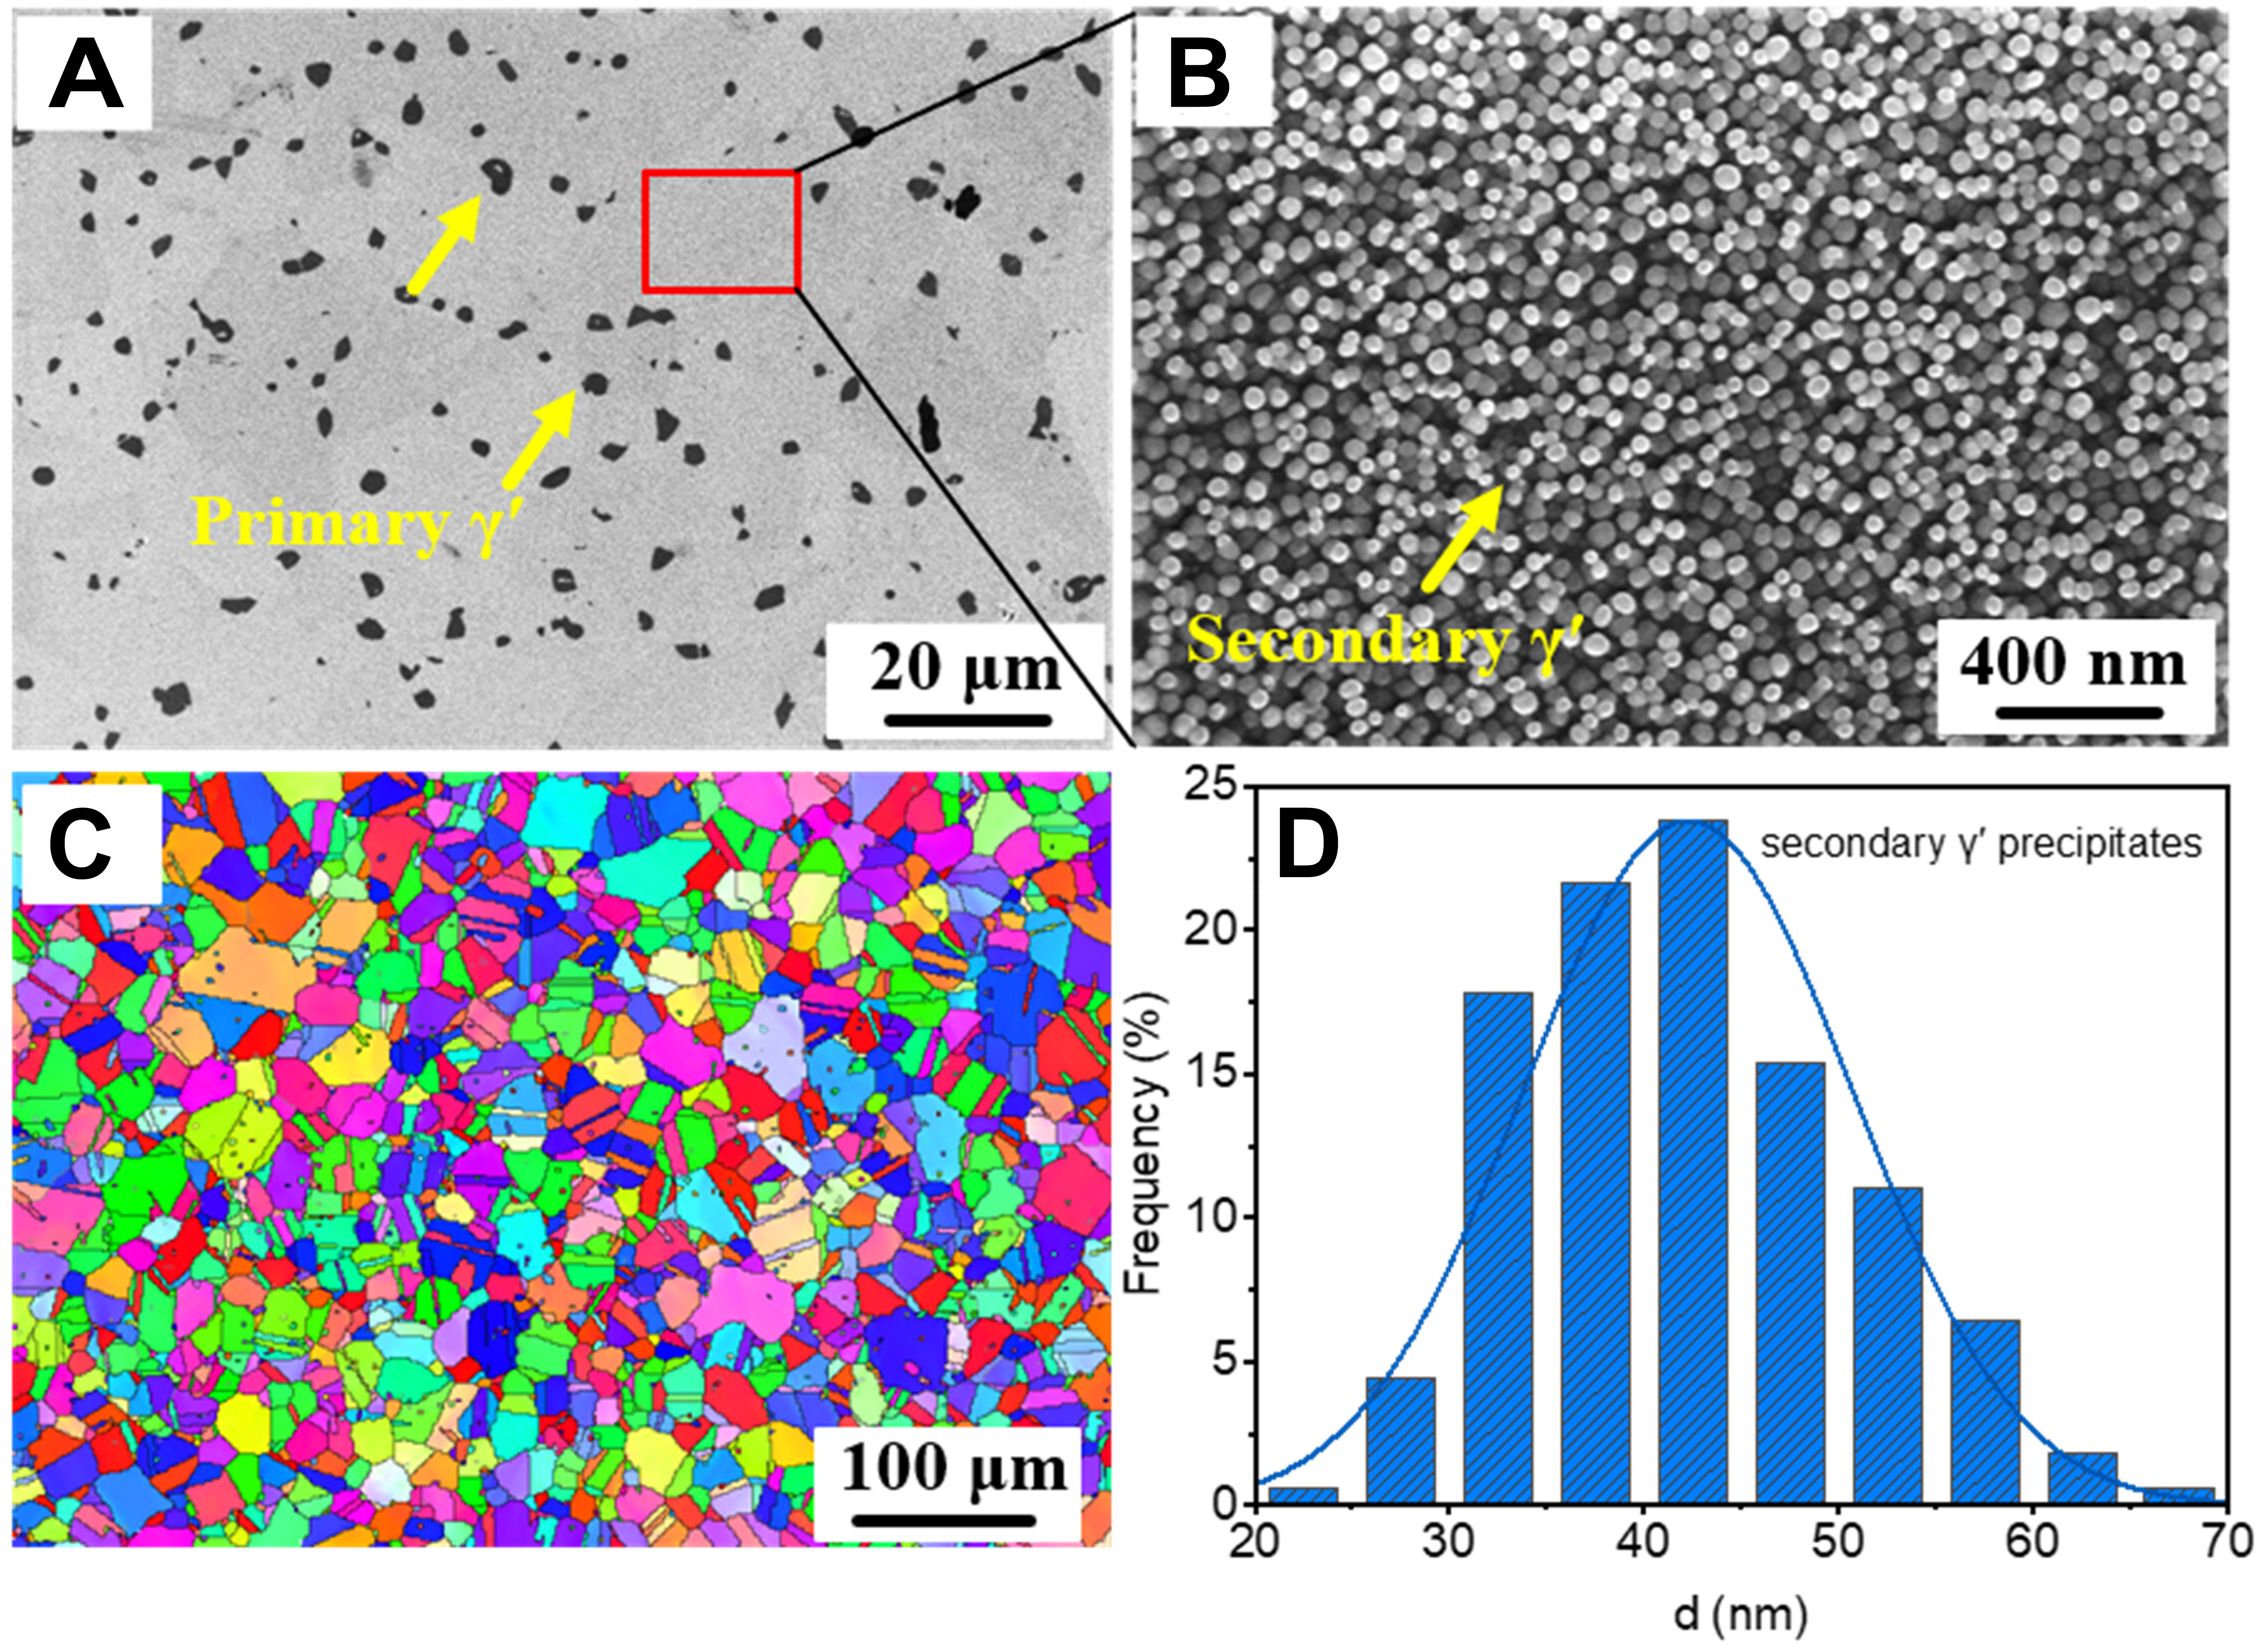
Figure 2. Microstructures of the HT specimen. (A) and (B) show the morphologies of primary and secondary γ′ phases, respectively; (C) The EBSD inverse pole figure (IPF) of the HT alloy; (D) The frequency distribution of secondary γ′ phases. HT: Heat-treated; EBSD: electron backscattered diffraction.


