


fig6
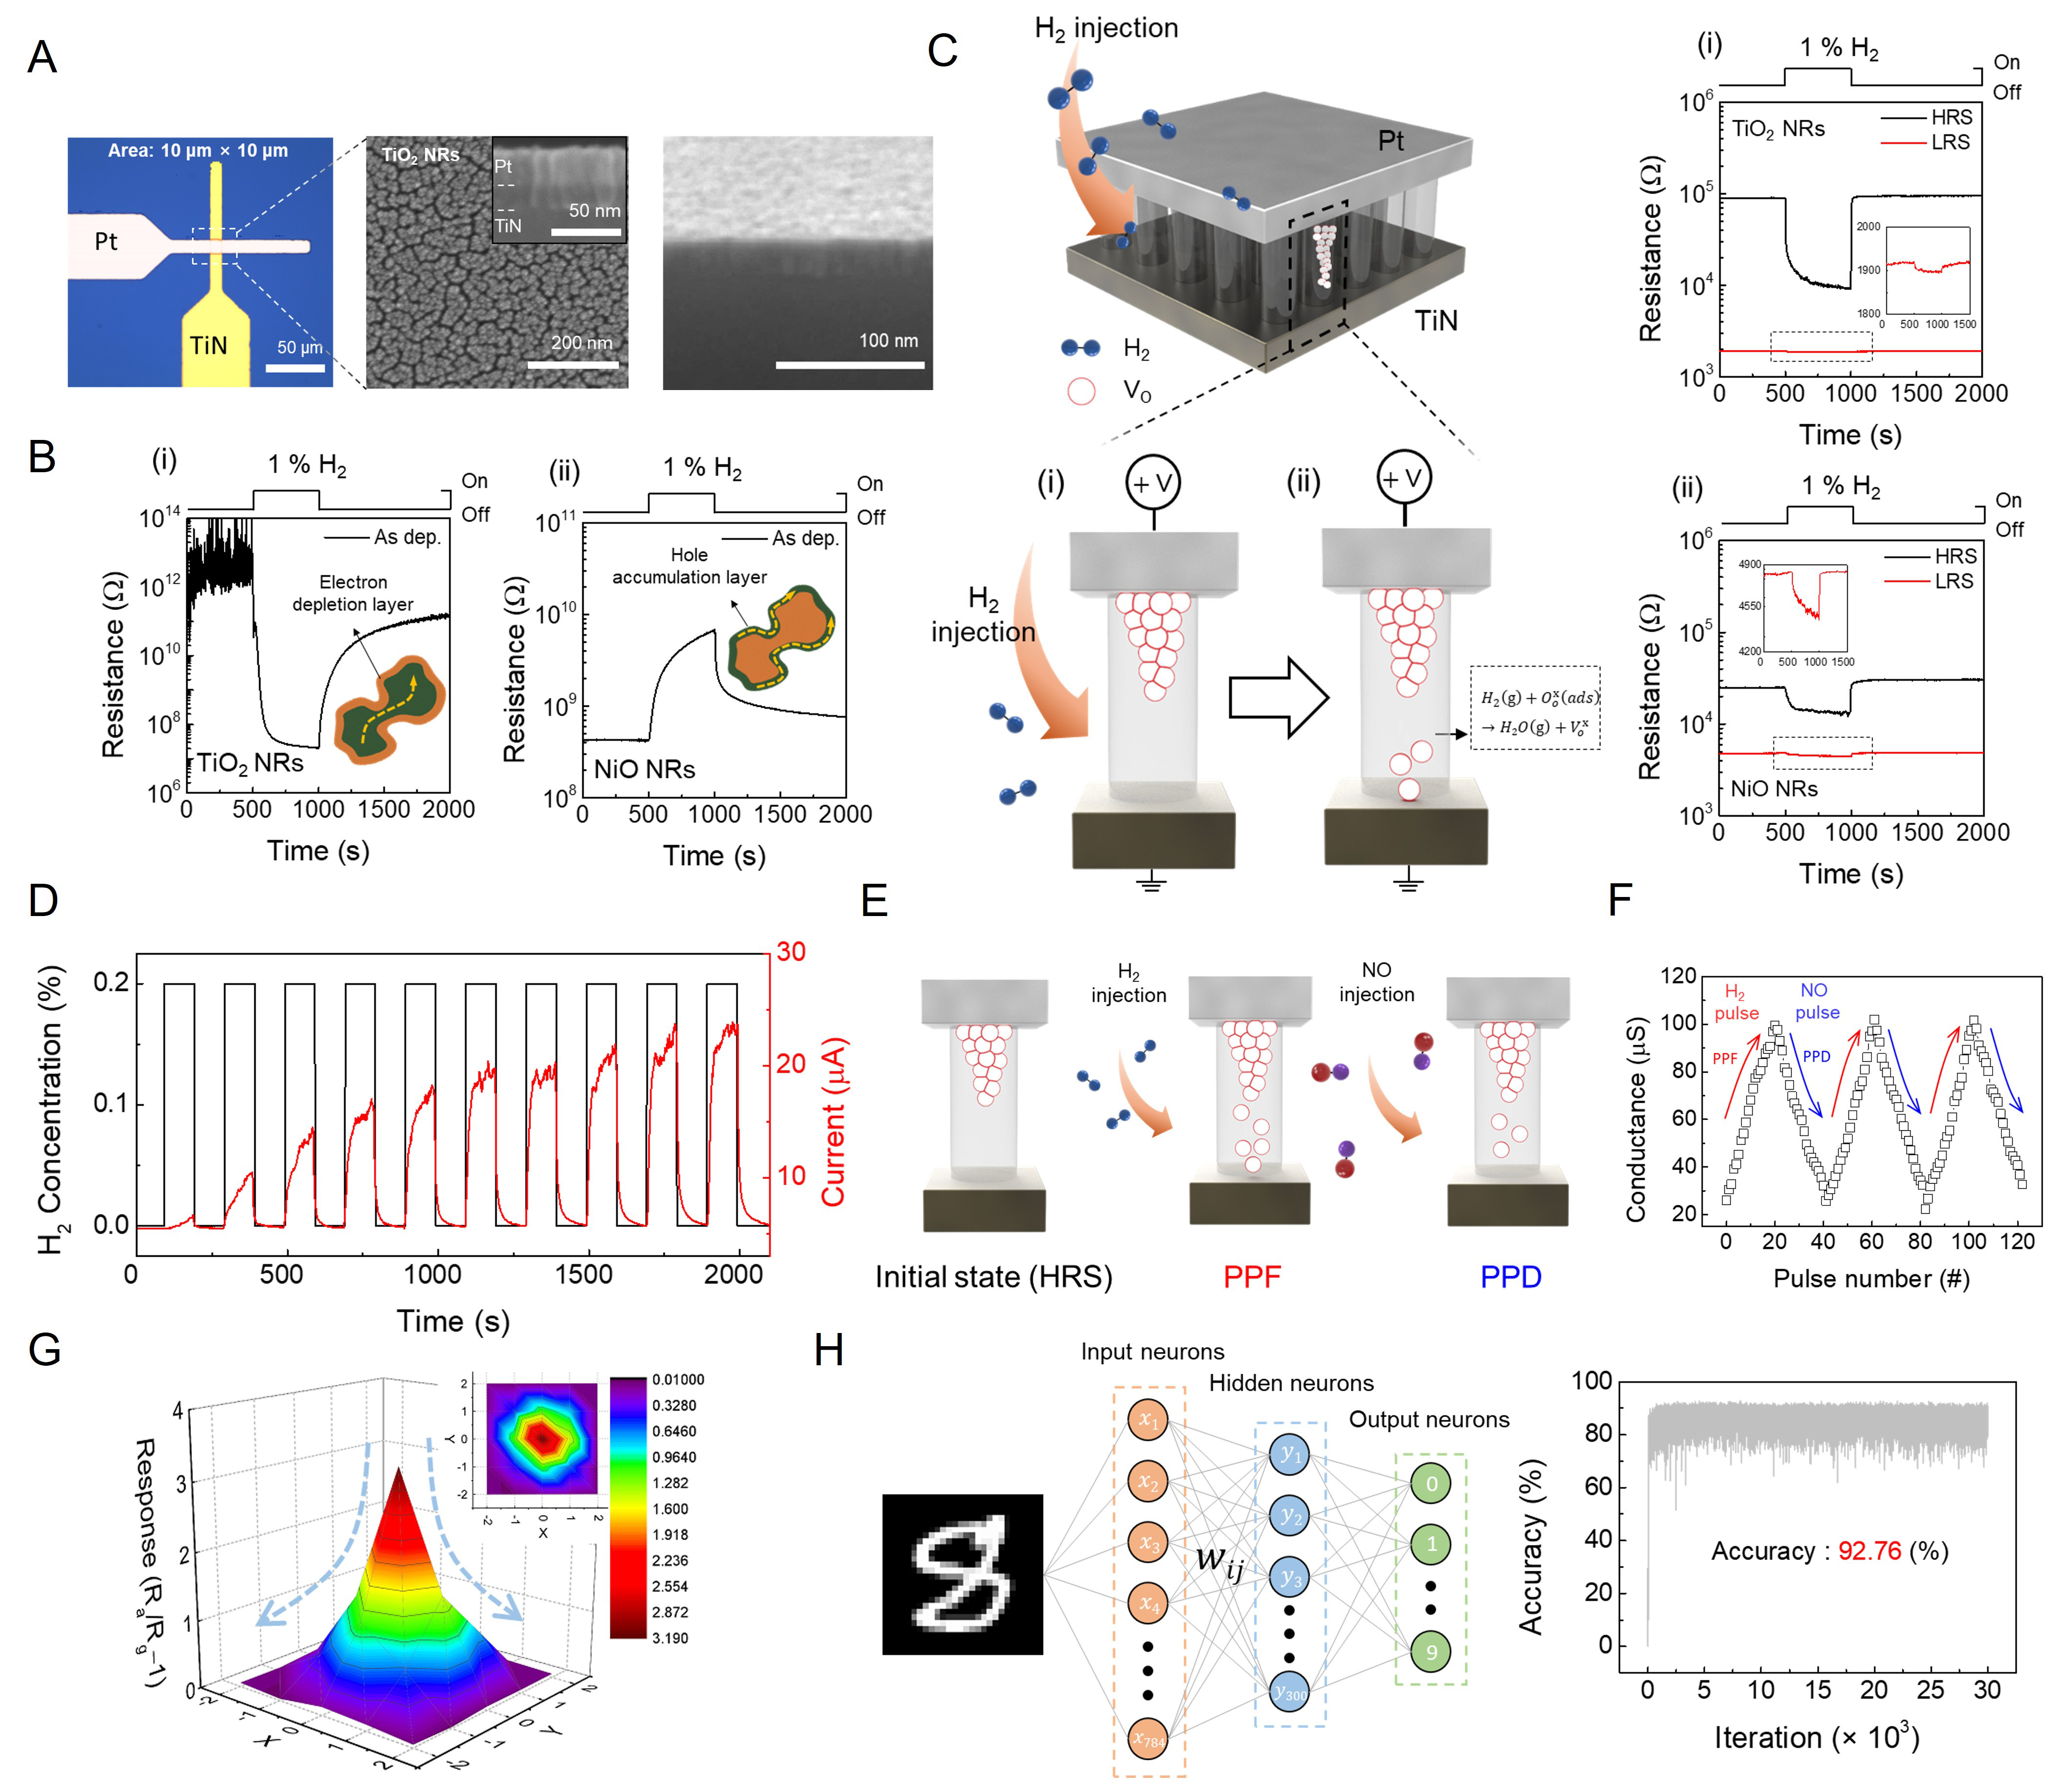
Figure 6. (A) Schematic and SEM images of the chemo-memristive gas sensor, showing the Pt/TiO2 nanorod/TiN crossbar structure and the highly porous morphology of TiO2 nanorods; (B) Response curves of TiO2 nanorods and NiO nanorods upon exposure to 1% H2 before electroforming; (C) Schematic illustration of the sensor response to H2 in the initial state and after the formation of oxygen vacancies induced by the reaction with H2. Response curves of TiO2 nanorods and NiO nanorods in high resistance state (HRS) and low resistance state (LRS) (red line in inset); (D) Hysteretic response curve of TiO2 nanorods to 10 consecutive 0.2% H2 pulses after electroforming; (E) Schematic illustration of controlling the synaptic weights based on the generation and elimination of oxygen vacancies using different target gases; (F) Three sequential conductance modulations based on the type of target gas (reducing or oxidizing); (G) 3D image of the trend in sensor response measured at 25 different locations; (H) MNIST-based neural network simulation for gas generation location inference and corresponding recognition accuracy (~ 92.76%). Reprinted with permission. Copyright 2023(A-H)[18], Wiley. Distributed under the terms of the CC BY-NC-ND license. No modifications have been made to the original images. PPF: Paired-pulse facilitation; PPD: paired-pulse depression; SEM: scanning electron microscopy; MNIST: Modified National Institute of Standards and Technology.


