


fig1
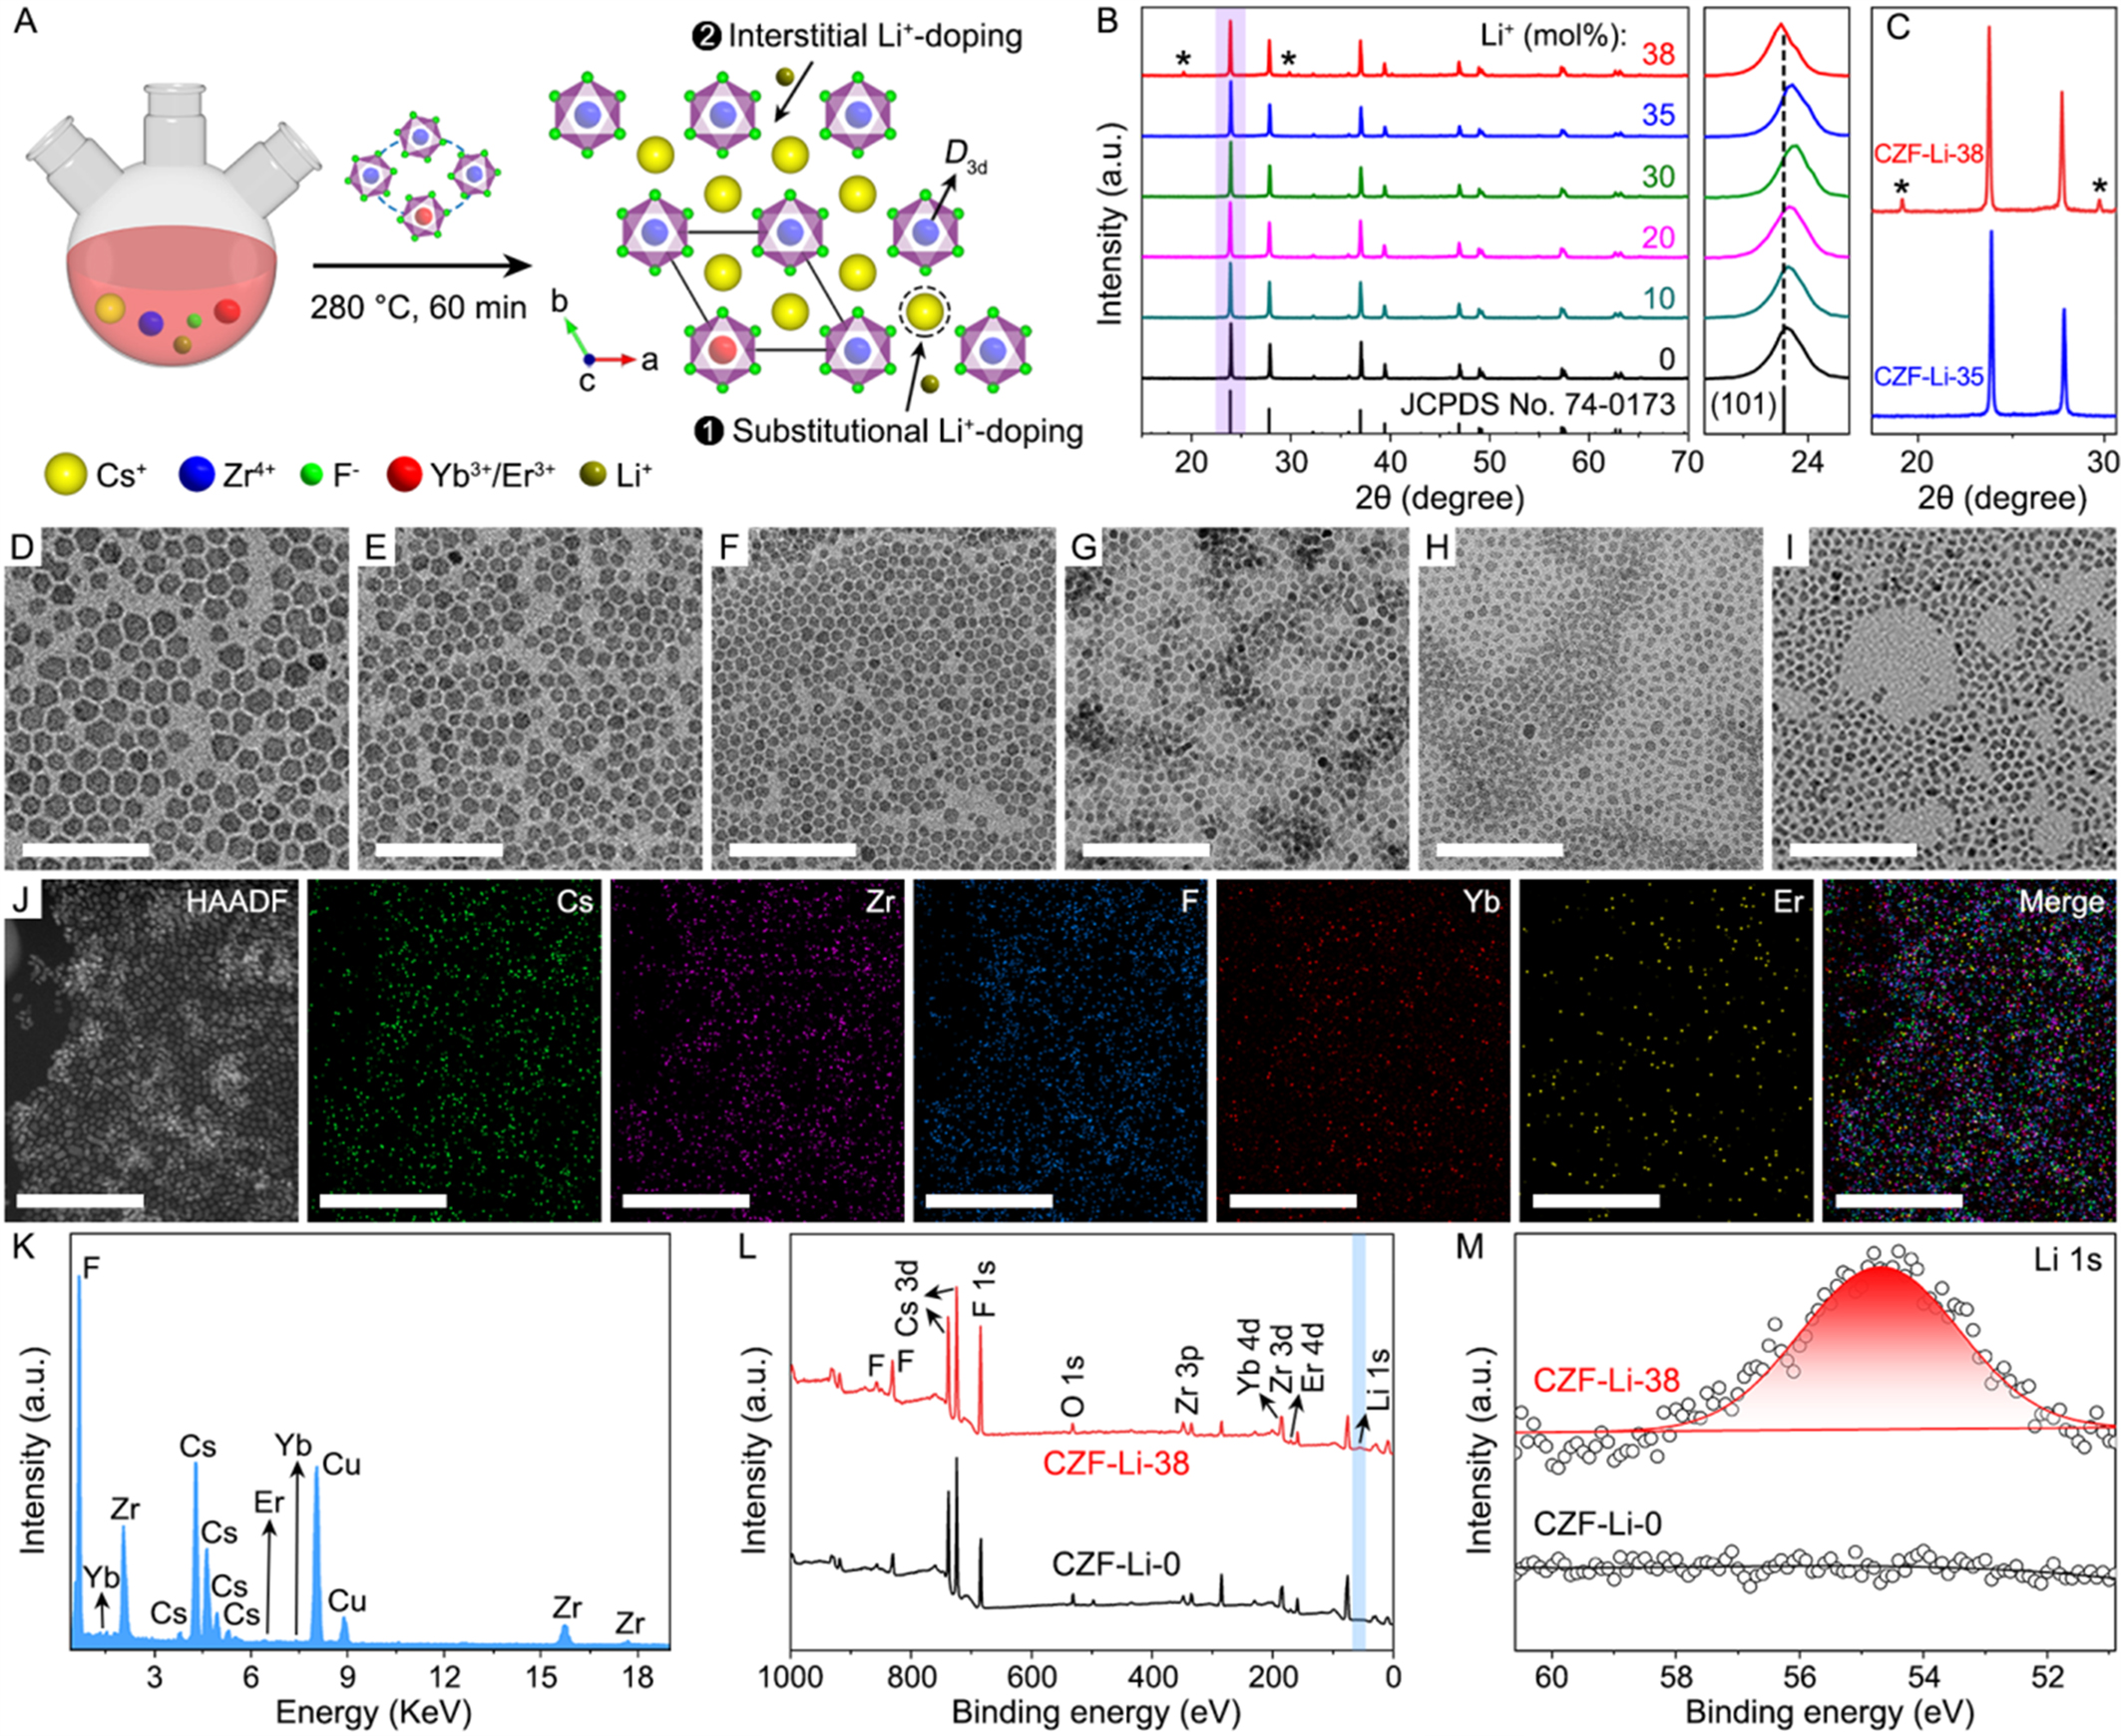
Figure 1. (A) Schematic illustration of the synthesis of Li+-doped Cs2ZrF6:Yb/Er NCs; (B) XRD patterns of Cs2ZrF6:Yb/Er NCs doped with different Li+ content, and the right panel displays the evolution of (101) diffraction peak; (C) Zoomed-in XRD patterns of the CZF-Li-35 and CZF-Li-38 NCs. TEM images of Cs2ZrF6:Yb/Er NCs doped with (D) 0, (E) 10, (F) 20, (G) 30, (H) 35, and (I) 38 mol% Li+, respectively; (J) HAADF-STEM image and corresponding elemental mapping images of Cs, Zr, F, Yb, and Er for the CZF-Li-38 NCs; (K) EDS spectrum of the CZF-Li-38 NCs. Comparison of XPS spectra for the CZF-Li-0 and CZF-Li-38 NCs: (L) full survey and (M) Li 1s. Scale bars in (D-J):


